Strategies I: Equities and Futures · Strategies
13Intraday Patterns
The US stock market trades from 9:30 to 4:00, but its futures trade around the clock, and Bondarenko and Muravyev found that four hours of the night, around the European open, account for the entire average return of the E-mini S&P 500; the other twenty hours average a noisy zero. The trading day has its own shape too: volume piles up at the open and the close, the closing auction sets the prices that index funds and dealers mark to, and in the last half hour the market tends to continue the day’s move, because dealers who are short gamma must hedge in its direction. This chapter decomposes the day, simulates the hedging flow and the closing imbalance, and measures what each pattern is worth to trade. The build is firm.intraday.
13.1 Overnight versus intraday returns
Definition 13.1 (Overnight return, intraday return)
A security’s overnight return is its return from one day’s close to the next day’s open; its intraday return is the return from the open to the close. Their sum (in logs) is the close-to-close return.
The split has been studied since the first intraday data: Cooper, Cliff and Gulen’s “like night and day” paper is the classic reference, and Lou, Polk and Skouras found that the profits of reversal and several momentum strategies were earned entirely overnight, with continuation within each part of the day and reversal across them (chapter 2). How much of the market’s own return is earned at night is harder to pin down than it looks. firm.intraday simulates twenty years of an index in half-hour bars with a 7% expected return spread in proportion to variance, a quarter of the variance arriving overnight, and so a quarter of the expected return: 1.75% a year overnight. Measured over the twenty years, the overnight share of the cumulative return is 54% (4.4% a year overnight, 3.7% by day). The standard error of a twenty-year mean return with a volatility of 16% is 3.6% a year, and of its overnight part 1.8%: twenty years cannot tell a quarter from a half. Bondarenko and Muravyev’s result is sharper because it rests on the futures’ whole clock and a Sharpe ratio of 1.6 in four hours, not on a split of a noisy mean.
13.2 The volume smile and the auctions
Definition 13.2 (Volume smile)
The volume smile is the U-shaped pattern of trading volume (and volatility) across the trading day: high at the open, low at midday, highest at the close, with the closing auction taking a large share.
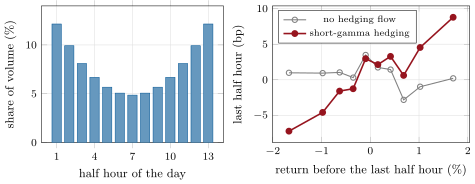
In the chapter’s model the first and last half hours each carry 12.1% of the day’s volume and the midday half hour 4.9%; a quarter of the volume trades in the first and last half hours together. The close is where benchmark prices are set: index funds (chapter 10), mutual funds that price their shares at the close, and dealers who mark their books all trade there, through the closing auction (Book 1, chapter 13).
As of September 2026 — The Nasdaq closing cross
In Nasdaq’s description of its closing cross (2019 edition of its FAQ), market-on-close, limit-on-close and imbalance-only orders are accepted before 3:50 p.m. Eastern Time; from 3:50 p.m. Nasdaq disseminates its Net Order Imbalance Indicator (every 10 seconds, then every second from 3:55 p.m.) and on-close orders can no longer be cancelled or modified; market-on-close entry stops at 3:55 p.m., limit-on-close entry at 3:58 p.m., imbalance-only orders are accepted until 4:00 p.m., when the closing process begins. Other exchanges run their own auctions with their own cut-offs.
s1_intraday.13.3 End-of-day hedging flows
Definition 13.3 (End-of-day hedging flow)
An end-of-day hedging flow is the trading that dealers and leveraged or inverse funds must do near the close to rebalance their exposure after the day’s move; when they are short gamma (Book 1, chapter 26), the hedge buys after rises and sells after falls, in the direction of the move.
Baltussen, Da, Lammers and Martens found market intraday momentum in over sixty futures on equities, bonds, commodities and currencies from 1974 to 2020: the return of the last thirty minutes before the close is positively predicted by the return from the previous close to that point, significantly and in all asset classes, and the effect reverts over the following days. They linked it to the gamma hedging of option market makers and leveraged ETFs. The chapter’s model plants that mechanism: dealers who are short gamma add 5% of the day’s move so far to the last half hour, and half of the push reverses overnight.
| twenty synthetic years | no hedging flow | short-gamma hedging |
|---|---|---|
| slope of the last half hour on the rest of the day; | ; | 0.044; 9.2 |
| last-half-hour momentum: hit rate; Sharpe ratio after costs | 48.8%; | 54.1%; 1.05 |
| last-half-hour momentum: return a year | 5.5% | |
| closing-imbalance fade: Sharpe ratio; return a year | 1.09; 8.8% | 1.08; 8.7% |
| next overnight return on the last half hour (slope) |
Without hedging flow the last half hour is unpredictable (slope , ), and a trade that follows the day’s direction for the last half hour loses its costs of one basis point a day: a year. With it the slope is 0.044 (), the direction is right 54.1% of the time, and the trade earns 5.5% a year at a Sharpe ratio of 1.05 (Figure 13.1, right). The trade is only as good as the hedging demand behind it: when option dealers are long gamma (after investors sell options to them), the hedge trades against the move and the pattern reverses. Measuring the dealers’ net gamma is the practitioner’s version of this chapter’s gamma parameter.
13.4 Close imbalances
The closing auction publishes its imbalance before it prints. In the model an imbalance of one standard deviation pushes the close by ten basis points, and 60% of the push reverses overnight. A trade that takes the other side of the published imbalance at the close and exits at the next open earns 8.8% a year at a Sharpe ratio of 1.09. The logic is chapter 10’s in miniature: whoever must trade at the close pays whoever can wait until the open. The risk is also the same: an imbalance may carry information, and the part that does not revert is the loss on the trades that should not have been made.
13.5 Strategy files
Strategy file 13.1 — Overnight drift
Who pays you, and why. Investors who hold risk overnight, when uncertainty is resolved around the European open, and are paid for it.
Instruments and venues. Index futures traded around the clock.
Signal. The time of day: long in the hours around the European open.
Sizing and execution. Enter before, exit after the window; small, repeated positions.
Costs. Two futures trades a day.
How it dies. As a risk premium it pays with losses in bad nights; crowding into the same window.
Horizon, capacity, infrastructure. Hours; a round-the-clock futures desk.
Backtest honestly. Futures prices at the exact times; costs; the COVID period in and out of the sample.
Sources. Bondarenko and Muravyev (2022): the entire average return in four hours around the European open, Sharpe ratio 1.6.
Strategy file 13.2 — Last-half-hour momentum
Who pays you, and why. Dealers and leveraged funds that must hedge in the direction of the day’s move.
Instruments and venues. Index and other liquid futures.
Signal. The return from the previous close to 30 minutes before the close.
Sizing and execution. In the direction of that return for the last half hour; flat at the close.
Costs. One round trip a day in the most liquid contracts.
How it dies. When dealers are long gamma; when others trade the same half hour first.
Horizon, capacity, infrastructure. Half an hour; intraday data and execution.
Backtest honestly. Prices at the exact bar boundaries; costs; the reversal the next day.
Sources. Baltussen, Da, Lammers and Martens (2021); Gao, Han, Li and Zhou (2018, chapter 5).
Strategy file 13.3 — Close imbalance reversal
Who pays you, and why. Traders who must trade at the close and push its price.
Instruments and venues. Stocks and their closing auctions.
Signal. The published imbalance before the auction.
Sizing and execution. Offset the imbalance in the auction; exit at the next open or through the next day.
Costs. Auction fees; overnight risk.
How it dies. Imbalances that carry information; competition to offset them.
Horizon, capacity, infrastructure. Overnight; auction imbalance feeds and order-entry cut-offs.
Backtest honestly. The imbalance as published at the cut-off, not the final one; fills in the auction.
Sources. This chapter’s simulation; the auction rules in the dated box.
Strategy file 13.4 — Hedging-flow timing
Who pays you, and why. Dealers’ mechanical hedging, when their gamma exposure is known or estimable.
Instruments and venues. Index futures and options.
Signal. An estimate of dealers’ net gamma from option open interest, combined with the day’s move.
Sizing and execution. Scale the last-half-hour trade with the estimated gamma; reverse it when gamma is positive.
Costs. As for last-half-hour momentum.
How it dies. Wrong gamma estimates; changes in who is short gamma.
Horizon, capacity, infrastructure. Intraday; option positioning data.
Backtest honestly. Gamma estimates from data before each day.
Sources. Baltussen, Da, Lammers and Martens (2021) on the link to gamma hedging.
Strategy file 13.5 — Open-auction reversal
Who pays you, and why. Overnight order flow that pushes the open, reversed during the day.
Instruments and venues. Stocks and the opening auction.
Signal. The overnight return, against the stock’s own history and its peers.
Sizing and execution. Against the overnight move from the open, flat by the close.
Costs. Wider spreads just after the open.
How it dies. Continuation within the day; news behind the move.
Horizon, capacity, infrastructure. Hours; opening auction data.
Backtest honestly. Official opening prices; no signal from prices that could not be traded.
Sources. Lou, Polk and Skouras (2019) on cross-period reversal; chapter 2.
13.6 Tutorial: the market makes its money at night
Goal. Simulate the day in half hours, with and without hedging flow, and measure the split of returns, the last-half-hour predictability and the closing-imbalance trade. End state: the table and Figure 13.1.
The day: overnight and half-hour returns, the hedging push and the imbalance.
def simulate_days(n: int, cfg: DayConfig | None = None, rng=None):
    cfg = cfg or DayConfig()
    rng = rng or np.random.default_rng(13)
    var_d = cfg.vol**2 / 252
    w = volume_curve(BARS, cfg.u)
    sd_bar = np.sqrt((1 - cfg.night_share) * var_d * w)
    sd_on = math.sqrt(cfg.night_share * var_d)
    mu_d = cfg.mu / 252
    on = mu_d * cfg.night_share + sd_on * rng.standard_normal(n)
    bars = mu_d * (1 - cfg.night_share) * w + sd_bar * rng.standard_normal((n, BARS))
    imb = rng.standard_normal(n)
    rest = on + bars[:, :-1].sum(axis=1)
    hedge = cfg.gamma * rest                                     # short-gamma dealers buy after rises, sell after falls
    bars[:, -1] += hedge + cfg.imbalance_impact * imb
    on[1:] -= cfg.imbalance_revert * cfg.imbalance_impact * imb[:-1] + cfg.hedge_revert * hedge[:-1]
    return {"overnight": on, "bars": bars, "imbalance": imb, "volume": w}
Listing 13.1. The day model. code/firm/intraday/firm_intraday.py The regression: the last half hour on the rest of the day.
def last_half_hour(bars, overnight):
    b = np.asarray(bars, float)
    x = np.asarray(overnight, float) + b[:, :-1].sum(axis=1)
    y = b[:, -1]
    slope, icpt = np.polyfit(x, y, 1)
    e = y - icpt - slope * x
    se = math.sqrt(e.var(ddof=2) / ((x - x.mean()) ** 2).sum())
    return float(slope), float(slope / se)
Listing 13.2. Last-half-hour predictability. code/firm/intraday/firm_intraday.py - Run
summary(0.0),summary(0.05)andfig_intraday.py.
What to change next. Make dealers long gamma on some days and short on others, and give the trade a noisy estimate of which; run a hundred twenty-year samples and plot the distribution of the measured overnight share.
13.7 Build: the trading day
Purpose. A half-hour model of the trading day with its volume smile, hedging flow and closing imbalance, and the decompositions that study them.
Interface. DayConfig, simulate_days(n, cfg, rng), decompose(open_, close), last_half_hour(bars, overnight), volume_curve(bars, u).
Rules. Expected returns in proportion to variance unless planted otherwise; the hedge and the imbalance act on the last half hour and revert overnight.
Acceptance tests. code/firm/intraday/tests/: the volume curve and the decomposition by hand; the variance split; no predictability without hedging, and the planted slope with it.
Stretch. Stock-level days with opening auctions; a gamma estimate from option open interest; Book 7, chapter 2’s tape for the order-level version.
Sources and further reading
- O. Bondarenko and D. Muravyev, “Market return around the clock: a puzzle”, Journal of Financial and Quantitative Analysis 58(3), 2022 (online; issue of 2023).
- D. Lou, C. Polk and S. Skouras, “A tug of war: overnight versus intraday expected returns”, Journal of Financial Economics 134(1), 2019.
- G. Baltussen, Z. Da, S. Lammers and M. Martens, “Hedging demand and market intraday momentum”, Journal of Financial Economics 142(1), 2021.
- M. J. Cooper, M. T. Cliff and H. Gulen, “Return differences between trading and non-trading hours: like night and day”, working paper, 2008.
- Nasdaq, Nasdaq Closing Cross FAQ.
13.8 Exercises
Exercise 13.1 ★
With an annual volatility of 16%, what is the standard error of a twenty-year mean return? Of its overnight part, if a quarter of the variance is overnight?
Solution
Solution of Exercise 13.1.
a year for the whole return; the overnight part has a volatility of , so a year.
Exercise 13.2 ★
If expected returns are proportional to variance and a quarter of the variance is overnight, how much of a 7% annual return is earned overnight?
Solution
Solution of Exercise 13.2.
A quarter: a year overnight, 5.25% by day.
Exercise 13.3 ★
An imbalance of one standard deviation pushes the close ten basis points and 60% reverts overnight. What does fading it earn, and what would earning that every day give over a year?
Solution
Solution of Exercise 13.3.
basis points per standard deviation of imbalance, before costs; six basis points every day would be a year. The model’s trade earns 8.8% because imbalances vary in size, the trade takes a fixed position whatever the imbalance, and it pays a basis point a day.
Exercise 13.4 ★★
Dealers are short gamma and the market is up 2% by 3:30. With a hedging coefficient of 0.05, what push does the model add to the last half hour?
Solution
Solution of Exercise 13.4.
, ten basis points of buying pressure in the last half hour.
Exercise 13.5 ★★
Why does a short-gamma hedge trade in the direction of the move, and a long-gamma hedge against it?
Solution
Solution of Exercise 13.5.
A short-gamma book’s delta falls as the price rises (it becomes shorter), so its hedger buys after rises and sells after falls: with the move. A long-gamma book’s delta rises with the price, so its hedger sells into rises and buys into falls: against the move.
Exercise 13.6 ★★
Why can twenty years of data not establish that most of the market’s return is earned overnight, while Bondarenko and Muravyev’s result is convincing?
Solution
Solution of Exercise 13.6.
A twenty-year mean return has a standard error of 3.6 points a year and its overnight part 1.8 points: the model’s planted quarter was measured as 54%. Bondarenko and Muravyev’s result concentrates the return in four hours with a Sharpe ratio of 1.6, which is detectable in a way that a split of a noisy annual mean is not.
Exercise 13.7 ★★★
Coding. Run summary(0.0) and summary(0.05); explain why the closing-imbalance fade is the same in both and the last-half-hour trade is not.
Solution
Solution of Exercise 13.7.
The fade depends only on the closing imbalance and its overnight reversal, which do not depend on the dealers’ hedging: 1.09 and 1.08. The last-half-hour trade exists only when hedging makes the last half hour follow the day: without it, 1.05 with it.
Exercise 13.8 ★★★
Find the flaw. “Overnight returns have been higher than daytime returns in our sample, so we hold the market only overnight and double our Sharpe ratio.”
Solution
Solution of Exercise 13.8.
A sample average of overnight minus daytime returns is noisy (the model measures 54% overnight when a quarter is planted), and holding only overnight halves the time invested and doubles the trading. Test the split on a long, round-the-clock sample, with costs, and ask why the premium would be earned at night.
13.9 Problem: The Market Makes Its Money at Night
Problem 13.1
Weekend problem — the shape of the day
The chapter’s day model and the public record.
Part I — Night and day.
- Define overnight and intraday returns.
- What did Bondarenko and Muravyev, and Lou, Polk and Skouras, find?
- What share of the model’s return is planted overnight, and what share is measured?
- Why do the two differ?
Part II — The close.
- Define the volume smile and give the model’s shares.
- Describe the closing cross’s timeline.
- Who trades at the close, and why?
- What does the closing-imbalance fade earn?
Part III — Hedging flow.
- Define end-of-day hedging flow.
- What did Baltussen and co-authors find?
- Give the last-half-hour slope and trade with and without hedging.
- What happens to the pattern when dealers are long gamma?
Part IV — The verdict.
- State the named result: the share of the cumulative return earned overnight and the last-half-hour predictability with and without hedging flow.
- Which pattern is a risk premium and which is a liquidity trade?
- How would you estimate dealers’ gamma?
- What costs matter most for these trades?
- What would you check before trading the overnight window?
- Which strategy file has the most capacity?
- How do these patterns interact with chapter 10’s index events?
- In one sentence: what makes the close special?
Solution
Solution of Problem 13.1.
- Close to next open; open to close.
- The entire average E-mini return in four hours around the European open; reversal and momentum profits earned overnight, with cross-period reversal.
- A quarter planted (1.75% a year); 54% measured (4.4% overnight, 3.7% by day).
- Sampling error: a twenty-year mean is too noisy to split.
- The U-shaped pattern of volume across the day; 12.1% in each of the first and last half hours, 4.9% at midday.
- Before 3:50 p.m. on-close orders; from 3:50 imbalance data; MOC cut-off 3:55, LOC 3:58; the cross at 4:00.
- Index funds, funds pricing at the close, dealers marking their books: the benchmark price is set there.
- 8.8% a year at a Sharpe ratio of 1.09.
- Trading near the close to rebalance exposure after the day’s move; with the move when short gamma.
- The last 30 minutes follow the rest of the day in over sixty futures, 1974–2020, reverting over the next days, linked to gamma hedging.
- Slope and a losing trade () without; 0.044 () and a Sharpe ratio of 1.05 with.
- The hedge trades against the move and the pattern reverses.
- Named result. 54% of the model’s cumulative return is measured overnight where a quarter is planted, a sampling error of a twenty-year mean; the last half hour’s slope on the rest of the day is () without hedging flow and 0.044 () with it.
- The overnight window is a risk premium; the last-half-hour and imbalance trades are liquidity trades.
- From option open interest and dealers’ likely side, aggregated into net gamma by strike.
- Spreads and fees on daily round trips; auction fees.
- The whole clock of futures data, its costs, and the stability of the result across periods.
- The overnight window in index futures.
- Reconstitution days concentrate index flow in the closing auction, where the imbalance trade and chapter 10’s liquidity provision meet.
- It is where the benchmark prices are set, so those who must trade at them pay those who can wait.
13.10 Interview questions
Interview question 13.1 ★ trader
Why is volume highest at the open and the close?
Solution
Solution of Interview question 13.1.
At the open, overnight news and orders are traded; at the close, benchmark prices are set and funds, index trackers and hedgers trade there; midday has neither.
Interview question 13.2 ★★ researcher, trader
What is market intraday momentum, and what might cause it?
Solution
Solution of Interview question 13.2.
The last half hour’s return tends to follow the day’s return up to that point. Hedging by short-gamma dealers and leveraged ETFs, which must trade with the move near the close, and late-informed trading.
Interview question 13.3 ★★ trader
How would you trade the closing auction’s published imbalance?
Solution
Solution of Interview question 13.3.
Take the other side of a large published imbalance in the auction, sized to the auction’s depth, and exit at the next open or during the next day, avoiding names where the imbalance may carry news.
Interview question 13.4 ★★ researcher
Most of the market’s return seems to come overnight. How would you test whether that is real?
Solution
Solution of Interview question 13.4.
Use round-the-clock futures, not open and close prices; compute returns by hour; account for costs; test stability across periods and markets; and compare the size of the effect with the sampling error of the split.
Interview question 13.5 ★★ risk
What risks does a strategy that holds positions only overnight carry?
Solution
Solution of Interview question 13.5.
Gap risk at the open, with no chance to trade out; news concentrated overnight; the cost of two trades a day; and, if the premium is compensation for overnight risk, its losses come in bad nights.
Interview question 13.6 ★★★ researcher
Dealers are short gamma in dollar terms and hedge at the close. Derive the size of their hedge trade after a market move , and the price push under a linear impact per dollar traded.
Solution
Solution of Interview question 13.6.
The delta of a book with gamma changes by after a move ; a short-gamma dealer () must buy to stay hedged after a rise. Under linear impact the price moves by , in the direction of the original move: a feedback proportional to the dealers’ gamma.