Strategies I: Equities and Futures · Strategies
25Short-Term Futures Strategies
Lucca and Moench found large average excess returns on US equities in the hours before scheduled Federal Reserve policy decisions: returns that had grown over time, accounted for a sizable share of the market’s annual return, appeared in other countries’ indices, and had no counterpart before other macroeconomic announcements. Once published, such an effect is everybody’s. Short-term futures strategies live on patterns like it, inside the trading day: the first half hour, the moves that bounce back within minutes, the hours before a scheduled release. On this chapter’s synthetic sessions the pre-announcement hold earns 40.6 basis points per event before its planted crowding and 18.8 after, a Sharpe ratio of 1.21 falling to 0.58; a fade of large five-minute moves earns a Sharpe ratio of 2.86 before costs and after half a spread each way. The build is firm.futintraday.
25.1 Sessions in bars
The index future’s regular session is simulated in one-minute bars (Listing 25.1): ten years of 390-minute sessions, 16.2% volatility a year with a quarter of the variance in the overnight gap, a U-shaped intraday profile (twice as volatile at the open and close as at midday), a daily trend drift with a standard deviation of 0.4% over the session, and a bounce of in one-minute returns. Eight times a year a scheduled announcement arrives at minute 270; a drift of 0.5% is planted from the previous day’s midday to the announcement, and from the sixth year it is cut to 30% of that: the crowding that follows publication. Book 7’s message-level firm.tape and event-driven firm.evbt are the tools for queue-level questions; for ten years of sessions, bars suffice, and the tape supplies the cost. On one simulated tape session (a price of 100.00, a tick of 0.01, so a tick is a basis point) the time-weighted quoted spread is 1.08 ticks; each trade here pays half of it, 0.54 basis points.
25.2 Opening ranges and intraday mean reversion
Definition 25.1 (Opening range breakout)
An opening range breakout records the highest and lowest prices of the first minutes of the session (the opening range) and takes a position in the direction of the first later move outside it, held to the close or a stop.
Definition 25.2 (Intraday mean reversion)
Intraday mean reversion is the tendency of short intraday price moves to be partly reversed within minutes, from bid–ask bounce and liquidity providers’ inventory; a mean-reversion strategy fades moves larger than a threshold and exits after a fixed holding time.
The two rules bet on opposite features of the synthetic session (Listing 25.2). The breakout bets on the trend day: once the session has moved outside its first minutes’ range, the day’s drift is more likely in that direction. The fade bets on the bounce: after the price has moved more than standard deviations in five minutes, sell the move and exit five minutes later.
| opening range (minutes) | 15 | 30 | 60 |
|---|---|---|---|
| breakout: Sharpe ratio before costs | 0.56 | 0.77 | 1.49 |
| breakout: Sharpe ratio after costs | 0.35 | 0.55 | 1.25 |
| breakout: mean daily return after costs (bp) | 1.88 | 2.77 | 5.62 |
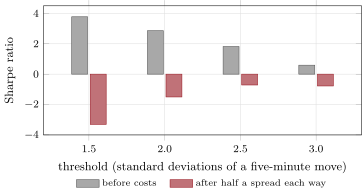
A longer range gives a later, surer read of the day’s direction: the planted drift is spread evenly over the session, so an hour reveals more of it than a quarter hour, and the breakout trades once a day at most, so costs matter little. The fade is the opposite (Figure 25.1): the bounce is strong enough for Sharpe ratios of 0.59 to 3.78 before costs, and at 0.54 basis points each way every threshold loses. The bounce gives back a tenth of the last minute’s move, a small part of a five-minute move, and that part is smaller than a spread.
s1_futures.fade_table.25.3 Scheduled announcements
Definition 25.3 (Pre-announcement drift)
A pre-announcement drift is an average price move in the hours before a scheduled announcement, in a direction that does not depend on the announcement’s content; the pre-FOMC drift in US equities is the best-known case.
As of September 2026 — FOMC meetings in 2026
The Federal Reserve’s calendar lists eight FOMC meetings in 2026: January 27–28, March 17–18, April 28–29, June 16–17, July 28–29, September 15–16, October 27–28 and December 8–9; the March, June, September and December meetings include a Summary of Economic Projections.
Lucca and Moench’s drift is unusual in two ways: it precedes the news instead of following it, and it has a sign regardless of what is announced. It also sits in equities only; they found none in Treasuries or money-market futures, and none before other major announcements. That makes it a risk premium or a behavioural pattern, not information, and it makes it easy to trade: hold the equity index future from the day before to the announcement.
| pre-announcement hold, after costs | years 1–5 | years 6–10 (crowded) |
|---|---|---|
| events | 39 | 40 |
| mean return per event (bp) | 40.6 | 18.8 |
| t-statistic | 2.7 | 1.3 |
| Sharpe ratio a year (eight events) | 1.21 | 0.58 |
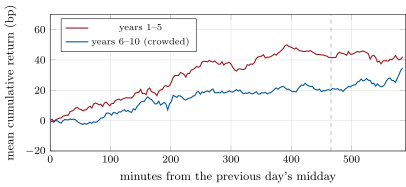
The planted drift is 50 basis points before the crowding and 15 after. The measured means, 40.6 and 18.8, are within a standard error of them: with a day’s volatility of about 1% per event, 39 events measure the mean to about 16 basis points (Figure 25.2). That is the practical difficulty with event strategies: eight events a year is a small sample, and a decay to a third of the effect is barely visible in five years. The published drift is a strong prior, and a live book can only confirm it slowly.
s1_futures.announcement_path.25.4 What makes a short-term edge survive
Three features decide. Turnover against edge: the fade trades about seven times a day for a fraction of a basis point each and loses; the breakout trades once and keeps most of its edge. Sample size against decay: an event strategy with eight events a year cannot see its own crowding for years. And the mechanism: a bounce is real but belongs to the liquidity providers who earn the spread; a trend day’s direction and a scheduled drift are harder to explain and therefore harder to be sure of. The overnight gap and the reaction after announcements are further candidates; the strategy files record them without a verified performance figure.
25.5 Strategy files
Strategy file 25.1 — Opening range breakout
Who pays you, and why. Traders who react late to the day’s direction.
Instruments and venues. Liquid index, rates and commodity futures.
Signal. The first move outside the opening range.
Sizing and execution. One position a day, held to the close or a stop; volatility-scaled.
Costs. Low: one round trip a day.
How it dies. Days without trends; crowding at the range’s edges.
Horizon, capacity, infrastructure. Hours; intraday bars.
Backtest honestly. Fills at the breakout level plus slippage; the range’s length chosen before the test.
Sources. No performance figure verified; this chapter: 0.55 after costs with a 30-minute range, synthetic.
Strategy file 25.2 — Intraday futures mean reversion
Who pays you, and why. Impatient traders who push prices briefly; in practice the liquidity providers collect this.
Instruments and venues. Liquid futures.
Signal. Five-minute moves beyond a threshold.
Sizing and execution. Fade, hold minutes; passive entry if possible.
Costs. Decisive: aggressive orders pay the spread on every trade.
How it dies. Costs; faster liquidity providers.
Horizon, capacity, infrastructure. Minutes; queue-aware execution (Book 7’s level-2 backtester).
Backtest honestly. The spread on every aggressive fill; queue position for passive ones.
Sources. This chapter: 2.86 before costs, after, synthetic.
Strategy file 25.3 — Pre-FOMC drift
Who pays you, and why. Unclear: a premium for bearing announcement risk, or investors’ behaviour before policy news.
Instruments and venues. Equity index futures.
Signal. The FOMC calendar.
Sizing and execution. Long from the day before to the announcement.
Costs. One round trip per meeting.
How it dies. Publication and crowding.
Horizon, capacity, infrastructure. A day, eight times a year; large capacity.
Backtest honestly. Meeting dates and statement times as scheduled; unscheduled meetings excluded; enough events to judge decay.
Sources. Lucca and Moench (2015); this chapter: 40.6 basis points per event before crowding, 18.8 after.
Strategy file 25.4 — Post-announcement momentum
Who pays you, and why. Traders who adjust to scheduled news gradually.
Instruments and venues. Rates and index futures around data releases.
Signal. The direction of the first minutes after a release, relative to the surprise.
Sizing and execution. Follow, hold hours.
Costs. Wide spreads at releases.
How it dies. Machines that finish the reaction in seconds (chapter 17).
Horizon, capacity, infrastructure. Minutes to hours; low-latency release data.
Backtest honestly. Release timestamps to the second; spreads at the release.
Sources. No performance figure verified.
Strategy file 25.5 — Overnight gap fade
Who pays you, and why. Overnight orders that overshoot at the open.
Instruments and venues. Index futures at the cash open.
Signal. The gap between the previous close and the open, against its volatility.
Sizing and execution. Fade large gaps, exit within the morning.
Costs. Wide opening spreads.
How it dies. Gaps that carry news continue.
Horizon, capacity, infrastructure. Hours.
Backtest honestly. The tradeable opening price, not the print; news days separated.
Sources. No performance figure verified; chapter 13’s overnight return.
25.6 Tutorial: before the announcement
Goal. Simulate ten years of one-minute futures sessions with a trend-day drift, a bounce and a crowded pre-announcement drift; take the cost of a trade from Book 7’s tape; test the breakout, the fade and the pre-announcement hold. End state: the tables and the two figures.
Sessions: the U-shaped profile, the bounce, the trend day and the planted announcements.
def simulate_sessions(cfg: SessionConfig | None = None, rng=None):
    cfg = cfg or SessionConfig()
    rng = rng or np.random.default_rng(25)
    D, M = cfg.days, cfg.minutes
    day_sd = cfg.vol / math.sqrt(252)
    m_sd = day_sd * math.sqrt(1 - cfg.gap_share) / math.sqrt(M) * _profile(cfg)
    e = rng.standard_normal((D, M)) * m_sd
    r = e.copy()
    r[:, 1:] += cfg.reversal * e[:, :-1]                      # MA(1) bounce: negative autocorrelation
    drift = cfg.trend_sd * rng.standard_normal(D)
    r += drift[:, None] / M
    gap = day_sd * math.sqrt(cfg.gap_share) * rng.standard_normal(D)
    ann = np.zeros(D, bool)
    ann[cfg.every // 2::cfg.every] = True
    size = np.where(np.arange(D) >= cfg.crowd_day, cfg.crowd_after, 1.0) * cfg.pre_drift
    for d in np.flatnonzero(ann):
        if d == 0:
            continue
        k = size[d] / 3                                       # a third on the previous afternoon, two thirds before
        r[d - 1, M // 2:] += k / (M - M // 2)
        r[d, :cfg.ann_minute] += 2 * k / cfg.ann_minute
    return {"r": r, "gap": gap, "ann": ann, "ann_minute": cfg.ann_minute, "drift": drift}
Listing 25.1. Ten years of one-minute sessions. code/firm/futintraday/firm_futintraday.py The rules: the opening range breakout and the fade.
def orb(S, window: int = 30, cost: float = 0.0):
    r = S["r"]
    p = np.cumsum(r, axis=1)
    hi, lo = p[:, :window].max(1), p[:, :window].min(1)
    out = np.zeros(len(r))
    for d in range(len(r)):
        after = p[d, window:]
        up = np.flatnonzero(after > hi[d])
        dn = np.flatnonzero(after < lo[d])
        first = min(up[0] if len(up) else 10**9, dn[0] if len(dn) else 10**9)
        if first == 10**9:
            continue
        side = 1.0 if len(up) and up[0] == first else -1.0
        entry = window + first
        out[d] = side * (p[d, -1] - p[d, entry]) - 2 * cost
    return out


def fade(S, lookback: int = 5, z: float = 2.0, hold: int = 5, cost: float = 0.0):
    r = S["r"]
    sd = r.std(axis=0)
    out = np.zeros(len(r))
    c = np.concatenate([np.zeros((len(r), 1)), np.cumsum(r, axis=1)], axis=1)
    band = z * sd.mean() * math.sqrt(lookback)
    for d in range(len(r)):
        t = lookback
        while t + hold < r.shape[1]:
            m = c[d, t] - c[d, t - lookback]
            if abs(m) > band:
                out[d] += -np.sign(m) * (c[d, t + hold] - c[d, t]) - 2 * cost
                t += hold
            else:
                t += 1
    return out
Listing 25.2. Opening range breakout and intraday fade. code/firm/futintraday/firm_futintraday.py - Run
tape_cost(),orb_table(),fade_table(),announcements()andannouncement_path(), andfig_futures.py.
What to change next. Enter the fade passively at the far side of the spread and model the fill probability; run the pre-announcement strategy on forty years of events to see how long the crowding takes to detect; replace the bars with firm.tape sessions for the announcement minutes.
25.7 Build: intraday futures toolkit
Purpose. Bar-level futures sessions with planted features, and the breakout, fade and pre-announcement strategies with costs.
Interface. SessionConfig(…), simulate_sessions(cfg, rng), orb(S, window, cost), fade(S, lookback, z, hold, cost), pre_announcement(S, cost).
Rules. Decisions from bars already closed; one position at a time; two costs per round trip.
Acceptance tests. code/firm/futintraday/tests/: the session’s volatility and bounce, and a breakout and a pre-announcement hold by hand.
Stretch. Passive fills; gap strategies; announcements with surprises and post-announcement dynamics.
Sources and further reading
- D. O. Lucca and E. Moench, “The pre-FOMC announcement drift”, Journal of Finance 70(1), 2015.
- Board of Governors of the Federal Reserve System, FOMC meeting calendars.
25.8 Exercises
Exercise 25.1 ★
At a price of 100.00 and a tick of 0.01, how many basis points is a tick? What is the round-trip cost at a quoted spread of 1.08 ticks?
Solution
Solution of Exercise 25.1.
basis point. A round trip at 1.08 ticks of spread pays half the spread twice: 1.08 basis points.
Exercise 25.2 ★
The planted drift of 50 basis points is cut to 30%. What is left, and what annual Sharpe ratio multiplier does trading eight events a year give a per-event Sharpe ratio?
Solution
Solution of Exercise 25.2.
basis points. Eight events a year multiply a per-event Sharpe ratio by ; with the chapter’s spacing of 32 trading days, .
Exercise 25.3 ★
Why does a longer opening range work better here?
Solution
Solution of Exercise 25.3.
The planted trend drift is spread evenly over the session, so the longer the range, the more of the day’s direction it has seen when the breakout fires, and the breakout trades at most once a day, so the later entry costs little.
Exercise 25.4 ★★
With a per-event standard deviation of about 1%, what is the standard error of a mean over 39 events, and what t-statistic does a true drift of 50 basis points have on average?
Solution
Solution of Exercise 25.4.
basis points; a true 50 basis points gives on average (2.7 in the sample).
Exercise 25.5 ★★
Why does the fade lose after costs at every threshold, even though it wins before?
Solution
Solution of Exercise 25.5.
Its gross edge per trade, the part of a move that bounces back, is smaller than half a spread in and half a spread out; with several trades a day the costs grow with the number of trades, the edge does not.
Exercise 25.6 ★★
A bounce of in one-minute returns reduces a day’s session variance. By how much does it reduce a day’s volatility when the session carries three quarters of the variance?
Solution
Solution of Exercise 25.6.
The session’s daily sum is scaled by about , so its variance by 0.81; with three quarters of the variance in the session, the day’s volatility is multiplied by .
Exercise 25.7 ★★★
Coding. Run fade_stats(2.0). How much does the fade earn a day before costs, how many trades does it make, and what cost per side would it break even at?
Solution
Solution of Exercise 25.7.
At a threshold of two standard deviations the fade earns 5.18 basis points a day before costs on 7.3 trades a day: it breaks even at 0.35 basis points per side, below the tape’s 0.54. A passive entry at the far side of the spread on one leg would bring it near break-even; both legs passive, with fills uncertain, is what a liquidity provider does.
Exercise 25.8 ★★★
Find the flaw. “The pre-FOMC drift earned 40 basis points per meeting over the last five years, so the edge is intact.”
Solution
Solution of Exercise 25.8.
Forty events have a standard error of about 16 basis points: a mean of 40 is consistent with a true drift anywhere from about 10 to 70, including one decayed to a third. Five years cannot confirm that the edge is intact; the paper’s prior, the costs and how crowded the trade has become matter more.
25.9 Problem: Before the Announcement
Problem 25.1
Weekend problem — three intraday edges
The chapter’s synthetic sessions and the public record.
Part I — Sessions.
- Describe the bar model and what is planted in it.
- How is the cost of a trade obtained from Book 7’s tape?
- Define the opening range breakout and intraday mean reversion.
- What feature of the session does each bet on?
Part II — Rules.
- Give the breakout’s Sharpe ratios by range length.
- Give the fade’s Sharpe ratios before and after costs.
- Why does one survive costs and not the other?
- Who earns the bounce in real markets?
Part III — Announcements.
- Define the pre-announcement drift; what did Lucca and Moench find?
- What does the dated box list?
- Give the per-event returns and Sharpe ratios before and after crowding.
- Why is crowding hard to detect?
Part IV — The verdict.
- State the named result: the pre-announcement drift’s Sharpe ratio before and after the planted crowding.
- List the three features that decide whether a short-term edge survives.
- How would you backtest the pre-FOMC drift honestly?
- Which strategy file depends most on latency?
- How does this chapter relate to chapter 13’s intraday patterns?
- What would you need to run the fade profitably?
- Why is the pre-FOMC drift not information?
- In one sentence: what do short-term futures strategies sell?
Solution
Solution of Problem 25.1.
- One-minute bars over ten years: U-shaped volatility, overnight gap, daily trend drift, bounce, and a pre-announcement drift cut after year five.
- Half the time-weighted quoted spread of a tape session: 0.54 basis points.
- A position on the first move outside the first minutes’ range; fading short moves that bounce back.
- The trend day; the bounce.
- 0.35, 0.55 and 1.25 after costs for 15, 30 and 60 minutes.
- 3.78, 2.86, 1.82 and 0.59 before; , , and after, for thresholds of 1.5 to 3.
- The breakout trades once a day for a large edge; the fade trades often for a small one.
- The liquidity providers who earn the spread.
- A move before a scheduled announcement whatever its content; large US equity returns before FOMC decisions, none in Treasuries or before other announcements.
- The eight 2026 FOMC meetings.
- 40.6 and 18.8 basis points per event, Sharpe ratios of 1.21 and 0.58.
- Eight events a year give a standard error of about 16 basis points in five years.
- Named result. The pre-announcement hold earned 40.6 basis points per event after costs () and a Sharpe ratio of 1.21 before the planted crowding, and 18.8 basis points () and 0.58 after it.
- Turnover against edge, sample size against decay, and the mechanism.
- Scheduled meeting dates only, statement times as scheduled, costs, and enough years to measure decay.
- Post-announcement momentum.
- Chapter 13 measured where the day’s return and volume fall; this chapter trades inside the session on those patterns.
- Passive fills and a lower cost than the bounce’s size, which means being a liquidity provider.
- It has a sign whatever the decision; information would move prices in the direction of the news.
- Immediacy and risk around predictable moments.
25.10 Interview questions
Interview question 25.1 ★ trader
What is an opening range breakout, and when does it fail?
Solution
Solution of Interview question 25.1.
It takes a position in the direction of the first move outside the session’s first minutes’ range; it fails on range days, when breakouts reverse, and when many traders’ stops sit at the same levels.
Interview question 25.2 ★★ researcher
How would you test whether a published pre-announcement drift still exists?
Solution
Solution of Interview question 25.2.
Measure it only after the publication date, with the same definition; compare its size with the published one and its standard error; check other markets and other announcements as controls; and check whether positioning before meetings has grown.
Interview question 25.3 ★★ researcher
Your intraday strategy has a Sharpe ratio of 3 before costs. What do you check first?
Solution
Solution of Interview question 25.3.
Costs: the number of trades times the spread and fees against the gross edge per trade; then whether fills are realistic (queue position, adverse selection) and whether prices used were tradeable.
Interview question 25.4 ★★ developer
What does a backtester need to simulate an intraday futures strategy faithfully?
Solution
Solution of Interview question 25.4.
Bars or messages with exact timestamps, the spread at each trade, a fill model for passive orders, session calendars and rolls, scheduled event times, and latency between signal and order.
Interview question 25.5 ★★ risk
What are the risks of holding index futures into scheduled announcements?
Solution
Solution of Interview question 25.5.
A jump at the announcement against the position, wider spreads and thinner books around it, and a crowded exit if many hold the same position.
Interview question 25.6 ★★★ researcher
One-minute returns are with independent of variance . A trader fades the last minute’s return and holds one minute. Derive the expected P&L per trade and the cost per trade at which it breaks even.
Solution
Solution of Interview question 25.6.
Holding over the next minute earns , with expectation
for Gaussian shocks, positive for . With a cost each way it breaks even when equals that expectation: for the edge is about 8% of a minute’s volatility, which must exceed a spread.