Strategies I: Equities and Futures · Strategies
8Short Interest, Borrow and Crowding
In January 2021 the short interest in GameStop reached 122.97% of its float: more shares had been sold short than were available to trade, because the same shares had been lent, sold and lent again. On January 27 the stock closed at $347.51, more than 1 600% above its close sixteen days earlier. The SEC’s staff later found that short sellers covering their positions had contributed to some of the sharpest rises, though their buying was a small fraction of all buying. Short interest is usually read as a signal, since short sellers tend to be informed; in a crowded name it is also a position that can be forced shut. This chapter builds a lending market on the synthetic stocks, measures what short interest and borrow fees predict, what the fees cost, and what a crowded short book can lose. The build is firm.lendsig.
8.1 Short interest as a signal
Short interest (Book 1, chapter 16) is the number of shares sold short and not yet bought back, reported as a share of the shares outstanding or of the float, or in days of average volume (days to cover). The evidence that it predicts returns is strong in some forms and fragile in others. Boehmer, Jones and Zhang, with daily NYSE short-sale data for 2000–2004, found that heavily shorted stocks underperformed lightly shorted ones by a risk-adjusted 1.16% over the next twenty trading days: short sellers as a group are informed. Asquith, Pathak and Ritter, with monthly short interest over a longer period, found many of the documented patterns not robust: equally weighted portfolios of high-short-interest stocks generally underperformed, value-weighted ones did not.
As of September 2026 — Short-interest reporting in the United States
Under FINRA Rule 4560, broker-dealers report the gross short positions in all equity securities held in their customer and proprietary accounts twice a month, as of settlement dates FINRA designates; reports are due by 6 p.m. Eastern Time on the second business day after the settlement date, and FINRA publishes the aggregated short interest on a published schedule some days later. A short-interest signal therefore sees positions as they stood one to several weeks earlier; daily short-sale volume and securities-lending data are the faster, commercial alternatives.
The synthetic market has no short sellers, so firm.lendsig adds them. Each stock has a lendable supply, a lognormal share of its shares centred on 20%. Short demand has two parts: informed shorts, who follow the stock’s planted expected return with a twenty-day lag and short in proportion to how negative it is; and uninformed shorts, persistent noise with a median of 2% of shares. Short interest is the demand the supply can meet. Over years 3 to 10 the median stock has 3.1% of its shares short, the 90th percentile 7.5% and the most shorted 54%; median days to cover is 2.1, and the 90th percentile 6.8. Because informed shorts are in the demand by construction, short interest predicts returns: minus short interest has a monthly rank IC of 0.061, days to cover 0.048, and a crowding score (the average rank of short interest, utilisation and days to cover) 0.058.
8.2 Borrow fees and utilisation
Definition 8.1 (Borrow-fee signal)
A borrow-fee signal ranks stocks on the fee to borrow them for a short sale (or on utilisation, the share of lendable supply on loan); high fees mark stocks in heavy short demand relative to supply, which have tended to underperform.
The synthetic fee is 0.25% a year (general collateral) until utilisation reaches 60%, and then rises steeply to 40% at full utilisation. Only 2.9% of stock-days pay more than 1%, but the top percentile pays the maximum. The fee is the cost of the signal, and here it decides the result:
| decile books, rebuilt monthly | short interest | crowding | borrow fee |
|---|---|---|---|
| rank IC against the next month | 0.061 | 0.058 | 0.006 |
| Sharpe ratio before fees | 3.33 | 3.30 | 1.18 |
| Sharpe ratio after fees | 2.24 | 2.08 | |
| Sharpe ratio after fees and costs | 1.84 | 1.69 | |
| gross return a year | 8.3% | 8.2% | 2.5% |
| borrow fees; trading costs (a year) | 2.7%; 0.95% | 3.0%; 0.94% | 4.0%; 0.33% |
| average fee on the short side | 5.4% | 6.1% | 7.9% |
The short-interest book keeps most of its edge after fees (8.3% gross, 4.6% net of fees and costs). The fee book is the warning: the stocks with the highest fees do underperform, but by less than it costs to short them, and the book loses. Engelberg, Reed and Ringgenberg made the related point on real data that the fee’s level is not the only risk: stocks whose loans can become expensive or be recalled carry short-selling risk, and have lower returns, less price efficiency and less short selling.
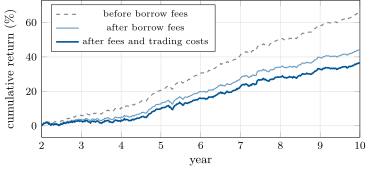
s1_lending.book.The safer use of the signal is avoidance. A long-only equal-weighted portfolio of the synthetic stocks earns 9.1% a year; the same portfolio without its most shorted decile earns 10.0%, a difference of 0.94% a year with a statistic of 7.2, and it pays no fees at all.
8.3 Recalls, squeezes and the lending market’s risk
Definition 8.2 (Squeeze risk)
Squeeze risk is the risk that short sellers of a stock are forced to buy back at the same time (because loans are recalled, margin is called or losses mount), pushing the price up and forcing further buying.
A short position has three risks a long position does not: the fee can rise, the loan can be recalled, and the loss is unbounded. In the synthetic market, loans are recalled with a daily probability of 0.05% at low utilisation, rising to 2% at full utilisation: the names a short-interest signal points to are the names most likely to be taken away. The squeeze is the extreme case. The SEC’s staff described its mechanics for GameStop: margin calls or losses make short sellers buy, their buying raises the price, and the rise forces more short sellers to buy; they also found the price stayed high after the covering had waned, so that the squeeze explained part of the episode, not all of it.
8.4 Crowded shorts
Definition 8.3 (Short-crowding measure)
A short-crowding measure scores how many short sellers are in a stock relative to what they can get out through, combining short interest, utilisation of lendable supply and days to cover.
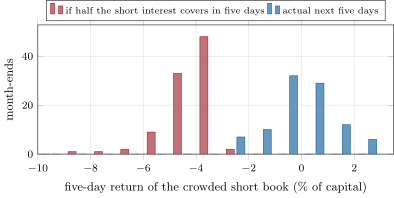
The squeeze stress (firm.lendsig.squeeze_loss) takes a book short the twenty most crowded names, half its capital in all, at each month-end, and asks what it loses if half of each name’s short interest is bought back over five days, with the price following the square-root impact law (Book 7, chapter 27) for as long as the buying lasts. The median loss is 4.0% of capital and the worst 8.3%; the same book’s worst actual five-day loss over the eight years was 3.0%. If only a quarter is covered the median is 2.8%; if half is covered over ten days, 5.7% and at worst 12.3%. The square-root law was not built for buying many days of volume, so these are floors, not forecasts: the GameStop price rose about 2 700% from its low to its high. At that scale the arithmetic is simpler than any model: one name rising twentyfold in a book short twenty names equally with half its capital costs 47.5% of capital, from one name.
s1_lending.squeeze.8.5 Strategy files
Strategy file 8.1 — High short interest avoidance
Who pays you, and why. Informed short sellers, whose positions reveal information; the long-only investor free-rides on it.
Instruments and venues. Stocks, long only.
Signal. Short interest as a share of shares or float, as last published.
Sizing and execution. Exclude or underweight the most-shorted names in an existing portfolio.
Costs. None of its own beyond the rebalancing.
How it dies. When short interest stops being informative; value-weighted evidence is weak.
Horizon, capacity, infrastructure. Months; very large capacity; the published short-interest file.
Backtest honestly. Short interest as of its publication date, not its settlement date; equal and value weights both.
Sources. Asquith, Pathak and Ritter (2004/2005); this chapter’s simulation (0.94% a year, , a planted effect).
Strategy file 8.2 — Borrow-fee signal
Who pays you, and why. Short demand exceeding supply marks overpricing that shorts cannot fully correct.
Instruments and venues. Stocks, with a securities-lending feed.
Signal. The borrow fee or utilisation, daily.
Sizing and execution. As an avoidance or underweight signal; shorting the names themselves pays the fee.
Costs. The fee itself: on the synthetic market it exceeds the underperformance.
How it dies. On the short side, by construction; recalls and fee spikes.
Horizon, capacity, infrastructure. Weeks to months; commercial lending data.
Backtest honestly. Fees charged on every short day at the rate then prevailing; recalls simulated.
Sources. Engelberg, Reed and Ringgenberg (2018); this chapter’s simulation.
Strategy file 8.3 — Days-to-cover ranking
Who pays you, and why. As for short interest, weighted by how hard the position is to exit.
Instruments and venues. Stocks.
Signal. Short interest divided by average daily volume.
Sizing and execution. Long low, short high, or avoidance.
Costs. Borrow fees on the short side are highest here.
How it dies. Squeezes in the names it shorts.
Horizon, capacity, infrastructure. Weeks to months.
Backtest honestly. Volume and short interest from the same dates; fees and recalls.
Sources. Boehmer, Jones and Zhang (2008): heavily shorted stocks underperformed by a risk-adjusted 1.16% over 20 days, 2000–2004.
Strategy file 8.4 — Crowded-short risk overlay
Who pays you, and why. Nobody: it is insurance, paid for by giving up part of the short-interest premium.
Instruments and venues. The firm’s short books.
Signal. The crowding score of each short position.
Sizing and execution. Cap the book’s exposure to crowded shorts; limit each name by days to cover; buy calls on the most crowded names.
Costs. The premium forgone and any options bought.
How it dies. It does not; it costs.
Horizon, capacity, infrastructure. Daily monitoring; lending data.
Backtest honestly. Stress with squeeze scenarios, not only with history, which rarely contains the tail.
Sources. SEC staff report (2021) on GameStop; this chapter’s squeeze stress.
8.6 Tutorial: January 2021
Goal. Add a lending market to the synthetic stocks, measure the short-interest and fee signals before and after fees, and stress a crowded short book. End state: the table, Figure 8.1 and Figure 8.2.
The lending market: supply, informed and uninformed demand, fees and recalls.
def fee_of(util, cfg: LendingConfig):
    u = np.clip(np.asarray(util, float), 0.0, 1.0)
    x = np.clip((u - cfg.fee_start) / (1 - cfg.fee_start), 0.0, 1.0)
    return cfg.gc_fee + (cfg.fee_max - cfg.gc_fee) * x**cfg.fee_power


def simulate_lending(alpha, listed, shares, cfg: LendingConfig | None = None):
    cfg = cfg or LendingConfig()
    alpha, listed = np.asarray(alpha, float), np.asarray(listed, bool)
    T, N = alpha.shape
    rng = np.random.default_rng(cfg.seed)
    supply = np.clip(cfg.supply_median * np.exp(cfg.supply_disp * rng.standard_normal(N)), 0.02, 0.6)
    lam = 0.5 ** (1 / cfg.smooth)
    a = np.zeros(N)
    z = cfg.noise_disp * rng.standard_normal(N)
    si, util, fee, recall = (np.full((T, N), np.nan) for _ in range(4))
    for t in range(T):
        a = lam * a + (1 - lam) * np.nan_to_num(alpha[t])
        z = cfg.noise_phi * z + math.sqrt(1 - cfg.noise_phi**2) * cfg.noise_disp * rng.standard_normal(N)
        demand = cfg.informed * np.maximum(-a, 0.0) + cfg.noise_median * np.exp(z)
        s = np.minimum(demand, supply)
        u = s / supply
        ok = listed[t]
        si[t, ok], util[t, ok] = s[ok], u[ok]
        fee[t, ok] = fee_of(u[ok], cfg)
        p = cfg.recall_base + (cfg.recall_top - cfg.recall_base) * np.clip((u - 0.8) / 0.2, 0, 1)
        recall[t, ok] = (rng.random(N) < p)[ok]
    return {"si": si, "util": util, "fee": fee, "recall": recall, "supply": supply}
Listing 8.1. The lending layer. code/firm/lendsig/firm_lendsig.py The book: a decile book with fees on its shorts.
    P, R, lend, *_ = market()
    s = -signal(name)
    W = sort_book(s, P.listed & np.isfinite(s))
    W = W[(np.arange(len(W)) // MONTH) * MONTH]
    r = np.nan_to_num(R)
    gross = np.sum(W[:-1] * r[1:], axis=1)
    fee = np.sum(np.where(W[:-1] < 0, -W[:-1], 0.0) * np.nan_to_num(lend["fee"][:-1]), axis=1) / YEAR
    traded = np.r_[np.abs(W[0]).sum(), np.abs(np.diff(W, axis=0)).sum(axis=1)][:-1]
    g, f, c = gross[START - 1:], fee[START - 1:], COST * traded[START - 1:]
Listing 8.2. Borrow fees charged on the short side. code/strategies-1/08-short-interest-borrow-and-crowding/python/s1_lending.py - Run
levels,ic,book,avoidance,squeezeandfig_lending.py.
What to change next. Make recalls close positions and charge their re-entry; let uninformed shorts crowd into the informed names (herding); price the squeeze with a feedback term in which covering raises the price and the price raises covering.
8.7 Build: the lending market
Purpose. A synthetic stock-lending market and the short-selling signals and stresses that need one.
Interface. LendingConfig, simulate_lending(alpha, listed, shares, cfg), fee_of(util, cfg), days_to_cover(si, shares, adv_shares), crowding(si, util, dtc), squeeze_loss(w, si, shares, adv_shares, sigma, cover, days, eta).
Rules. Short interest never above supply; fees charged daily on shorts; recalls random with a probability rising in utilisation.
Acceptance tests. code/firm/lendsig/tests/: the fee schedule by hand; informed demand concentrated in negative-alpha names; days to cover, the crowding score and the squeeze loss by hand.
Stretch. Rehypothecation (short interest above 100% of float); lending supply from index funds; a feedback squeeze.
Sources and further reading
- US SEC staff, Staff Report on Equity and Options Market Structure Conditions in Early 2021, October 2021.
- P. Asquith, P. A. Pathak and J. R. Ritter, “Short interest, institutional ownership, and stock returns”, Journal of Financial Economics 78(2), 2005.
- E. Boehmer, C. M. Jones and X. Zhang, “Which shorts are informed?”, Journal of Finance 63(2), 2008.
- J. E. Engelberg, A. V. Reed and M. C. Ringgenberg, “Short-selling risk”, Journal of Finance 73(2), 2018.
- FINRA Rule 4560, short-interest reporting.
8.8 Exercises
Exercise 8.1 ★
A stock has 80 million shares, 10% of them sold short, and trades 0.8 million shares a day. What are its days to cover?
Solution
Solution of Exercise 8.1.
million shares short against 0.8 million traded a day: 10 days to cover.
Exercise 8.2 ★
How can short interest exceed 100% of the float? Give a two-step example.
Solution
Solution of Exercise 8.2.
A lends a share to B, who sells it short to C; C lends the same share to D, who sells it short to E. One share has been sold short twice, and short interest counts two. Repeat and short interest passes the float, as the SEC’s staff explained for GameStop.
Exercise 8.3 ★
With the chapter’s fee schedule, what does a stock at 80% utilisation cost to borrow, and what does a short position of 5% of capital in it cost for nine months?
Solution
Solution of Exercise 8.3.
At 80% utilisation the fee is a year. On 5% of capital for nine months: of capital.
Exercise 8.4 ★★
Why does the fee book lose while the short-interest book wins, when both point at the same names?
Solution
Solution of Exercise 8.4.
The fee is highest where utilisation is highest, which is a narrower and more expensive set of names than the most shorted as a share of shares: the fee book’s short side pays 7.9% a year on average against the short-interest book’s 5.4%. The fee book’s names underperform by less than their fees, and its signal is weaker (IC 0.006 against 0.061), because the fee is flat for most stocks and then saturates.
Exercise 8.5 ★★
Why is the avoidance version of the signal more robust than the long–short version?
Solution
Solution of Exercise 8.5.
It pays no fees, faces no recalls or squeezes, and needs only that the most-shorted stocks do worse than the rest on average; the long–short version must also short the names where shorting is most expensive and most dangerous.
Exercise 8.6 ★★
A book is short twenty crowded names equally with half its capital. One of them rises twentyfold. What does the book lose?
Solution
Solution of Exercise 8.6.
Each position is of capital; a twentyfold rise is a gain of 19 times for the stock, so the book loses of capital.
Exercise 8.7 ★★★
Coding. Run squeeze(0.25, 5) and squeeze(0.5, 10). Explain how the losses depend on the covered share and the speed of covering under the square-root law.
Solution
Solution of Exercise 8.7.
The median losses are 2.8% (a quarter covered in five days), 4.0% (half in five days) and 5.7% (half in ten days). Under the square-root law the daily move grows with the square root of the covered share; spreading the same buying over more days lowers each day’s move but, in the chapter’s stress, the price keeps rising for longer, so the cumulative move grows. Real squeezes are worse: other buyers join, and short sellers facing losses cover faster.
Exercise 8.8 ★★★
Find the flaw. “Our short-interest backtest uses FINRA short interest on its settlement date and earns 1.5% a month.”
Solution
Solution of Exercise 8.8.
Short interest is known only when FINRA publishes it, days after the settlement date; using it at the settlement date is look-ahead. The backtest must also charge borrow fees and recalls on its shorts, and report equal- and value-weighted results, since the effect is weak in value-weighted portfolios.
8.9 Problem: January 2021
Problem 8.1
Weekend problem — the signal and the squeeze
The synthetic lending market and the public record.
Part I — The episode.
- What did GameStop’s short interest reach, and how can it exceed 100%?
- Describe the price path from January 11 to 28, 2021.
- What did the SEC’s staff conclude about short covering?
- How is short interest reported, and how stale is it?
Part II — The signal.
- What did Boehmer, Jones and Zhang, and Asquith, Pathak and Ritter, find?
- Describe the synthetic lending market.
- Give the ICs of short interest, days to cover, the fee and the crowding score.
- Give the short-interest book’s returns and Sharpe ratios before and after fees.
Part III — The costs.
- Why does the fee book lose?
- What does avoidance earn?
- What did Engelberg, Reed and Ringgenberg find about short-selling risk?
- How are recalls modelled, and why do they concentrate in the signal’s names?
Part IV — The verdict.
- State the named result: the return of the high-short-interest signal before and after borrow fees, and the loss of a crowded short book in a simulated squeeze.
- Why are the squeeze losses floors, not forecasts?
- What does one twentyfold name do to a crowded book?
- How would you size a short book’s crowded names?
- Which strategy file would a long-only manager use?
- What data would you buy to run these strategies?
- What does the GameStop episode teach about tail risk in backtests?
- In one sentence: what does a short seller pay for?
Solution
Solution of Problem 8.1.
- 122.97% of float in January 2021; when shares sold short are lent again by their buyers.
- From a close of $19.95 on January 12 to $347.51 on January 27 (more than 1 600% above January 11), an intraday high of $483.00 on January 28, and about 2 700% from the January 8 low to that high.
- Covering by major short sellers coincided with some sharp rises, but it was a small fraction of buying and prices stayed high after it waned.
- Twice a month under FINRA Rule 4560, due two business days after the settlement date and published later: weeks old when used.
- Heavily shorted stocks underperformed by a risk-adjusted 1.16% over 20 days (2000–2004); many patterns are not robust, and value-weighted high short-interest portfolios did not underperform.
- Lendable supply around 20% of shares; informed shorts following the planted expected return and uninformed noise; fees rising above 60% utilisation to 40%; recalls more likely at high utilisation.
- 0.061, 0.048, 0.006 and 0.058.
- 8.3% a year gross, 2.7% of fees and 0.95% of costs; Sharpe ratios 3.33, 2.24 and 1.84.
- Its names underperform by less than their fees (7.9% a year on the short side).
- 0.94% a year over the equal-weighted market, , with no fees.
- Stocks with more short-selling risk (fees that can jump, loans that can be recalled) have lower returns, less price efficiency and less short selling.
- A daily probability rising from 0.05% to 2% with utilisation above 80%: high utilisation is where heavily shorted names are.
- Named result. The short-interest decile book earns 8.3% a year before borrow fees and 4.6% after fees and costs (Sharpe ratio 3.33, 2.24 after fees); a book short the twenty most crowded names with half its capital loses a median 4.0% of capital, and at worst 8.3%, if half their short interest covers within five days, against a worst actual five-day loss of 3.0%.
- The square-root law is fitted to ordinary orders, not to buying days of volume with other buyers joining.
- It costs 47.5% of capital.
- Cap each name by days to cover and the book’s total crowding exposure, and stress it with squeezes rather than history.
- Avoidance.
- Daily securities-lending data (utilisation, fees, recalls) and daily short-sale volume, beyond the twice-monthly short interest.
- The tail of a short book is outside most histories; it has to be imposed by stress scenarios.
- The borrow fee, the recall risk and an unbounded loss.
8.10 Interview questions
Interview question 8.1 ★ researcher, trader
What does high short interest tell you about a stock?
Solution
Solution of Interview question 8.1.
That informed traders expect it to fall, on average, and that it is expensive and risky to short; high short interest also means potential forced buying if short sellers must cover.
Interview question 8.2 ★★ trader, risk
What risks does a short position carry that a long position does not?
Solution
Solution of Interview question 8.2.
Borrow fees that can rise, loans that can be recalled, margin calls, unbounded losses, and squeezes when many short sellers must buy at once.
Interview question 8.3 ★★ risk
How would you measure and limit the crowding of a short book?
Solution
Solution of Interview question 8.3.
Score each short on short interest, utilisation and days to cover; limit positions by days to cover and aggregate the book’s crowded exposure; stress with squeeze scenarios; watch fees and recalls daily.
Interview question 8.4 ★★ researcher
Why might a signal that predicts underperformance still lose money when traded on the short side?
Solution
Solution of Interview question 8.4.
Because shorting it costs a fee that can exceed the underperformance, and carries recall and squeeze risk that eats the average; the signal is better used to avoid the names.
Interview question 8.5 ★★ developer, researcher
What timestamps does a short-interest backtest need, and what goes wrong without them?
Solution
Solution of Interview question 8.5.
The settlement date of each short-interest report and its publication date; fee and utilisation data dated when observed; volume windows aligned with them. Without them the backtest uses information before it was public.
Interview question 8.6 ★★★ researcher, risk
Short sellers hold shares of a stock trading a day with daily volatility . Under square-root impact, how does the price move if they all cover within days, and why does the model understate a squeeze?
Solution
Solution of Interview question 8.6.
Each day’s move is about , so over days the price rises by about if the impact persists. It understates a squeeze because the law is estimated on orders far smaller than daily volume, and because a squeeze feeds on itself: rising prices force more covering and attract momentum buyers, which the law does not contain.