Strategies I: Equities and Futures · Strategies
17News and Events
A headline reaches the wire at 10:32:07. Within a few milliseconds, programs that parse the feed have traded on it, and most of the price’s move is over before a person has finished the first sentence. What is left is the part the market takes days to believe: Tetlock, Saar-Tsechansky and Macskassy found that prices briefly underreact to the negative words in firm-specific news, and Hirshleifer, Lim and Teoh found that the reaction to an earnings surprise is weaker, and the drift after it stronger, on days when many other firms announce. On this chapter’s synthetic news stream a trader who acts within a millisecond still has 96.7% of the move ahead; at a tenth of a second, 70.1%; after a second, only the 28.7% that the machines leave for the following days. A daily trader who reads each item’s tone with an imperfect text model earns a Sharpe ratio of 3.2 on that remainder, more on busy news days than on quiet ones. The build is firm.newsevent.
17.1 Machine-readable news
Definition 17.1 (Machine-readable news)
Machine-readable news is a news feed delivered in a structured form that programs can act on without a person reading it: each item carries a timestamp, the securities it concerns, a category, and often scores for relevance, novelty and tone computed by the vendor or by the user’s own text model.
A news strategy turns items into positions in three steps. It tags each item with the securities it concerns and discards those that are not about them. It scores the item’s direction and strength, from a dictionary of positive and negative words at the simplest to a language model trained on past reactions. And it decides when to act: within the first second, when the move is still to come but only machines compete for it, or later, on the part the market takes longer to absorb. The published record is mostly about the second kind. Tetlock measured the pessimism of a daily Wall Street Journal column and found that high pessimism predicts downward pressure on market prices followed by a reversion to fundamentals: tone as noise-trader sentiment. Tetlock, Saar-Tsechansky and Macskassy took the measure to firm-specific stories and found that the fraction of negative words forecasts low earnings and that prices briefly underreact to it, most for stories about fundamentals: tone as information that the market takes time to absorb.
The chapter’s stream (firm.newsevent) has eight years of items on 1 000 stocks, 40.8 a day on average (82 351 in all), with a news intensity that varies from day to day. Each item has a tone, the total move it will cause, with a standard deviation of 2%; an attention level, which falls as more items arrive the same day ( for items, a median of 0.42); and a time of arrival, uniform over the session. A share of the move, from one half with no attention to all of it with full attention, happens within a fraction of a second, with a time constant of 0.2 seconds; the rest drifts in evenly over the next five days.
17.2 Scheduled events
Earnings announcements, dividend declarations, index changes and economic releases arrive at known times, and chapter 7 traded the drift after the first of them with an event study. For news trading the schedule changes two things. The reaction can be prepared: the consensus is known, the surprise is a single number, and the order can be staged before the release, which puts the first second in the hands of those with the fastest feeds. And the distraction is predictable: Hirshleifer, Lim and Teoh measured the investor’s information load by the number of same-day announcements and found that the immediate price and volume reaction to a surprise is much weaker, and the post-announcement drift much stronger, when many other firms announce the same day, strong enough to give a trading strategy substantial alphas. The synthetic stream plants their mechanism in its attention function.
Definition 17.2 (News reaction window)
A news reaction window is the interval after a news item over which a strategy measures or trades its price move, from the item’s timestamp plus the strategy’s latency to the end of the holding period; the share of the item’s total move that falls inside it is what the strategy can capture.
17.3 Unscheduled events and halts
Unscheduled news (mergers, profit warnings, regulatory actions, accidents) arrives at any time, and the exchanges have a tool for the largest items: they stop trading until the news is out.
Definition 17.3 (Trading halt)
A trading halt is a stop in trading of a security ordered by its listing exchange or regulator, pending news, after news has been released, or after a price move too large for the market to absorb continuously; trading resumes, usually through a reopening auction, when the halt is lifted.
As of September 2026 — Halt codes on Nasdaq
Nasdaq publishes a code with each halt. Among them: T1, “Halt – News Pending”; T2, “Halt – News Released”; T3, news and resumption times; T5, a single-stock trading pause; LUDP, a volatility trading pause under limit up–limit down; and MWC1 to MWC3, the three levels of the market-wide circuit breaker. Book 1, chapter 31 describes the limit up–limit down bands and the circuit breakers.
A halt changes who captures the move. While a stock is halted no one can trade it continuously, so the move happens at the reopening auction, where everyone’s orders meet at one price: speed within the first second is worth nothing, and what matters is how orders are placed in the auction and what happens after it. The synthetic stream halts every item that moves its stock by more than 5% (1.18% of items) for five minutes, and puts the immediate part of the move at the reopening. A fast trader catches nothing of a halted item’s immediate move; the drift afterwards is the same as for any other item. Whether reopening prices overshoot or undershoot is an empirical question the chapter’s model does not settle; the post-halt strategy file sets out what to test.
17.4 Reaction speed and who captures the move
Listing 17.1 is the whole reaction model: the share of an item’s move still ahead of a trader who acts at a given latency. Weighting the items by the size of their moves gives the share of the stream’s total move that is still available.
| latency | 1 ms | 10 ms | 100 ms | 1 s | 1 hour | next close |
|---|---|---|---|---|---|---|
| share of the move still ahead | 96.7% | 93.7% | 70.1% | 29.2% | 28.7% | 28.7% |
| P&L per item after 10 bp (bp) | 144 | 139 | 102 | 36 | 36 | 36 |
The curve (Figure 17.1) has two regimes. Below a second the share falls fast, because the machines take the immediate part within a few time constants: a trader a tenth of a second late has lost nearly a third of the move to faster ones. Above a second it is flat: the machines are done, and what remains, 28.7%, is the part the market’s attention leaves for the next days. The P&L figures assume the trader knows the direction of every item, as the fastest traders effectively do for the simplest items; they are the value of the window, not of a strategy.
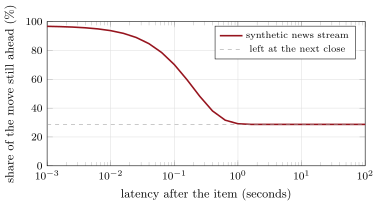
s1_news.capture.A daily trader cannot compete in the first second, but has the rest. The chapter’s daily trader reads each item’s tone with a text model whose error is 1.5 times the tone’s spread, so it gets the direction right 68.9% of the time; it buys or sells at the next close in the direction of its reading and holds five days, with 2% of daily noise on each stock and ten basis points a round trip (Listing 17.2).
| items | all | quiet days (attention above median) | busy days |
|---|---|---|---|
| items traded | 82 351 | 39 735 | 42 616 |
| drift captured per item (bp) | 25.4 | 20.8 | 29.5 |
| return a year after costs | 7.4% | 6.3% | 8.3% |
| Sharpe ratio after costs | 3.24 | 1.80 | 2.74 |
Busy days leave more drift per item, as in Hirshleifer, Lim and Teoh: the market’s attention is spread over more news, so less of each move happens at once. The split books each hold about half the items, so their Sharpe ratios are lower than the whole book’s, which diversifies over twice as many. The Sharpe ratio of 3.2 is high because the model plants the underreaction cleanly and the reading’s errors are independent of everything else; the published effects are measured in basis points per story, and the costs of trading many small positions quickly absorb them.
17.5 Strategy files
Strategy file 17.1 — Headline sentiment
Who pays you, and why. Investors who absorb the information in news text slowly, and noise traders who push prices on tone alone.
Instruments and venues. Liquid stocks with frequent firm-specific news; index futures for market-wide tone.
Signal. The tone of firm-specific stories from a dictionary or a trained text model, filtered for relevance and novelty.
Sizing and execution. Positions after the first seconds, in the direction of the tone, held days; many small positions.
Costs. News feeds and text processing; turnover on every story.
How it dies. Better text models everywhere; the drift absorbed faster.
Horizon, capacity, infrastructure. Days; capacity limited by the number of stories and their liquidity; a timestamped news archive.
Backtest honestly. Stories as they arrived, with the feed’s own timestamps, not the article’s publication time; no revised tone scores.
Sources. Tetlock (2007); Tetlock, Saar-Tsechansky and Macskassy (2008): prices briefly underreact to negative words.
Strategy file 17.2 — Scheduled-event drift
Who pays you, and why. Investors who underreact to scheduled news, by more when many announcements compete for their attention.
Instruments and venues. Stocks with announcements on the calendar.
Signal. The surprise against consensus, read from the release as it arrives.
Sizing and execution. Positions at the close of the announcement day, in the direction of the surprise, held days to weeks.
Costs. Moderate; trading near crowded closes.
How it dies. Faster reactions by machines leave less drift.
Horizon, capacity, infrastructure. Days to weeks; an event calendar and a consensus database.
Backtest honestly. Release times to the second; consensus as it stood before the release.
Sources. Chapter 7’s event study; Hirshleifer, Lim and Teoh (2009).
Strategy file 17.3 — Post-halt reopening
Who pays you, and why. Traders who must trade at the reopening whatever the price, and a reopening auction whose price may overshoot.
Instruments and venues. Stocks halted for news or volatility; the reopening auction.
Signal. The news released during the halt, the auction’s indicative price and imbalance, and the move since the halt.
Sizing and execution. Orders in the reopening auction or just after it, against an overshoot or with a drift; small, because liquidity is thin.
Costs. Wide spreads after the reopening; the risk of another halt.
How it dies. Competition for reopening liquidity.
Horizon, capacity, infrastructure. Minutes to days; the halt feed and the auction’s indicative prices.
Backtest honestly. Halts and resumption times from the exchange’s records; auction prices, not the first trades after.
Sources. No performance figure verified; the halt codes of the dated box.
Strategy file 17.4 — Underreaction to low-attention news
Who pays you, and why. Distracted investors, who react less to news on days when more other news competes for their attention.
Instruments and venues. Stocks with news on busy days.
Signal. The item’s direction, weighted by the day’s news load (the number of same-day announcements or stories).
Sizing and execution. Larger positions on busy days; held days.
Costs. As for headline sentiment.
How it dies. Machines that do not get distracted.
Horizon, capacity, infrastructure. Days; a count of the day’s news.
Backtest honestly. The news load as it was known at the time of the trade.
Sources. Hirshleifer, Lim and Teoh (2009): stronger drift and substantial alphas; this chapter’s split by attention.
17.6 Tutorial: before a person reads it
Goal. Generate a news stream with planted tone and attention, measure the share of its move still ahead at each latency, and trade what is left at the next close. End state: the two tables and Figure 17.1.
The reaction model: the immediate share with attention, and what is left at a given latency; halted items have nothing to catch.
def immediate_share(attention, cfg: NewsConfig | None = None):
    cfg = cfg or NewsConfig()
    return cfg.floor + (1 - cfg.floor) * np.asarray(attention, float)


def remaining(items, latency, cfg: NewsConfig | None = None):
    cfg = cfg or NewsConfig()
    share = immediate_share(items["attention"], cfg)
    if latency is None:
        return 1 - share
    lat = float(latency)
    fast = np.exp(-lat / cfg.tau)
    fast = np.where(items["halted"], 0.0, fast)        # a halted stock reopens at the new price: nothing to catch
    return share * fast + (1 - share)
Listing 17.1. The immediate share and the move still ahead at a latency. code/firm/newsevent/firm_newsevent.py The daily trader: a noisy reading of each item’s tone, entry at the next close, five days’ holding.
def daily(split: str = "all"):
    """The daily trader's book: items entered at the next close in the tone's direction, held five days with daily
    noise; equal weight across open items. split: 'all', 'quiet' (attention above the median) or 'busy' (below)."""
    it = items()
    rng = np.random.default_rng(18)
    med = np.median(it["attention"])
    keep = {"all": np.ones(len(it), bool), "quiet": it["attention"] > med, "busy": it["attention"] <= med}[split]
    sel = it[keep]
    read = sel["tone"] + READ * 0.02 * np.random.default_rng(19).standard_normal(len(sel))   # a text model's reading
    drift = np.sign(read) * sel["tone"] * (1 - immediate_share(sel["attention"]))
    pnl = np.zeros(DAYS + HOLD + 1)
    cnt = np.zeros(DAYS + HOLD + 1)
    for d, g in zip(sel["day"], drift, strict=True):
        r = g / HOLD + NOISE * rng.standard_normal(HOLD)
        pnl[d + 1:d + 1 + HOLD] += r
        cnt[d + 1:d + 1 + HOLD] += 1
        pnl[d + 1] -= COST
    x = np.where(cnt > 0, pnl / np.maximum(cnt, 1), 0.0)[1:DAYS + 1]
    return {"sr": float(x.mean() / x.std(ddof=1) * math.sqrt(252)), "ret": float(x.mean() * 252),
            "drift_bp": float(1e4 * drift.mean()), "items": int(keep.sum()),
            "right": float((np.sign(read) == np.sign(sel["tone"])).mean())}
Listing 17.2. The daily trader’s book by attention. code/strategies-1/17-news-and-events/python/s1_news.py - Run
stream(),capture(latency)for each latency anddaily(split)for the three splits, andfig_news.py.
What to change next. Let the text model’s error vary with the item’s category; make the reopening auction overshoot and trade against it; give the daily trader a signal weighted by the day’s news load.
17.7 Build: a news stream
Purpose. A synthetic news stream with tone, attention and halts, and the share of each item’s move still ahead at a given latency.
Interface. NewsConfig(…), simulate_news(days, stocks, cfg, rng), immediate_share(attention, cfg), remaining(items, latency, cfg) (latency None for the next close).
Rules. Attention depends only on the day’s number of items; halted items reopen at the new price; the stream is deterministic for a given seed.
Acceptance tests. code/firm/newsevent/tests/: the halt threshold and the attention function; the remaining share at zero, small and large latencies.
Stretch. Relevance and novelty scores; items that concern several stocks; reopening auctions with an imbalance.
Sources and further reading
- P. C. Tetlock, “Giving content to investor sentiment: the role of media in the stock market”, Journal of Finance 62(3), 2007.
- P. C. Tetlock, M. Saar-Tsechansky and S. Macskassy, “More than words: quantifying language to measure firms’ fundamentals”, Journal of Finance 63(3), 2008.
- D. Hirshleifer, S. S. Lim and S. H. Teoh, “Driven to distraction: extraneous events and underreaction to earnings news”, Journal of Finance 64(5), 2009.
17.8 Exercises
Exercise 17.1 ★
The immediate part of a move decays with a time constant of 0.2 seconds. What fraction of it is still ahead of a trader at 100 milliseconds, and at one second?
Solution
Solution of Exercise 17.1.
at 100 milliseconds; at one second, less than one percent.
Exercise 17.2 ★
On a day with 40 items, what is each item’s attention, and what share of its move happens at once? What is the share at the median attention of 0.42?
Solution
Solution of Exercise 17.2.
, so the immediate share is and 27% drifts. At the median attention, .
Exercise 17.3 ★
Why does a fast trader catch nothing of a halted item’s immediate move?
Solution
Solution of Exercise 17.3.
While the stock is halted no one can trade it; the immediate move happens at the reopening auction, where every order meets at one price. There is no window in which a fast trader can trade at the old price.
Exercise 17.4 ★★
A text model reads a normally distributed tone with an independent normal error 1.5 times the tone’s standard deviation. How often does it get the direction right? (For a bivariate normal pair with correlation , the signs agree with probability .)
Solution
Solution of Exercise 17.4.
The correlation between tone and reading is , so the signs agree with probability ; the simulation measures 68.9%.
Exercise 17.5 ★★
Why is the latency curve flat between one second and the next close?
Solution
Solution of Exercise 17.5.
After a second the immediate part is almost entirely gone ( of it remains) and the drift has not started: it comes in over the following days. Between one second and the close nothing moves in the model.
Exercise 17.6 ★★
Why do the quiet-day and busy-day books both have lower Sharpe ratios than the whole book?
Solution
Solution of Exercise 17.6.
Each split holds about half the items, so its daily P&L averages over half as many independent positions and its noise is larger. The whole book diversifies over both halves; its drift per item (25.4 basis points) lies between theirs.
Exercise 17.7 ★★★
Coding. Set READ to 0 in s1_news.py, a perfect reading, and rerun daily(). What happens to the Sharpe ratio, and what does the difference measure?
Solution
Solution of Exercise 17.7.
The Sharpe ratio rises to 7.6 and the return to 17.4% a year, with 45.7 basis points of drift per item before costs instead of 25.4. The difference is the value of the text model. The trader keeps of the drift, the correlation between reading and tone (0.555): more than the that the hit rate alone suggests, because the larger moves are read correctly more often.
Exercise 17.8 ★★★
Find the flaw. “Our backtest trades each story at the minute of its publication time on the website and earns 40 basis points per story.”
Solution
Solution of Exercise 17.8.
A website’s publication time is not when the story reached the market: the wire and machine-readable feeds carry it earlier, and machines trade it within a second. A backtest at the publication minute may trade at prices that already moved, or, if the site’s time is earlier than its update, before the news existed. Use the feed’s own timestamps, as received, and the prices after them.
17.9 Problem: Before a Person Reads It
Problem 17.1
Weekend problem — the life of a headline
The chapter’s synthetic news stream and the public record.
Part I — News as data.
- Define machine-readable news and a news reaction window.
- List the three steps from an item to a position.
- What did Tetlock (2007) find about media pessimism?
- What did Tetlock, Saar-Tsechansky and Macskassy find about negative words?
Part II — Events and halts.
- What changes when an event is scheduled?
- What did Hirshleifer, Lim and Teoh find about distraction?
- Define a trading halt and name three Nasdaq halt codes.
- How does a halt change who captures the move?
Part III — The stream.
- Describe the synthetic stream: items, tone, attention, reaction and halts.
- How many items are there, how many a day, and what share is halted?
- Give the share of the move still ahead at 1 millisecond, 100 milliseconds, one second and the next close.
- Explain the two regimes of the latency curve.
Part IV — The verdict.
- State the named result: the share of the news move captured at each latency, and the drift left for a daily trader.
- Why do busy days leave more drift?
- What does the text model’s error cost the daily trader?
- Why is the daily trader’s Sharpe ratio of 3.2 an upper bound for real news?
- How would you backtest a news strategy honestly?
- Which strategy file needs the fastest infrastructure?
- How does this chapter relate to chapter 7?
- In one sentence: what does speed buy in news trading?
Solution
Solution of Problem 17.1.
- A structured news feed for programs (timestamp, securities, category, scores); the interval from the item plus the latency to the end of the holding period.
- Tag the item with its securities; score its direction and strength; decide when to act.
- High pessimism predicts downward pressure on market prices followed by a reversion to fundamentals, and extreme pessimism high volume.
- The fraction of negative words forecasts low earnings; prices briefly underreact, most for stories about fundamentals.
- The reaction can be prepared, which rewards speed; distraction from other announcements is predictable.
- Weaker immediate reactions and stronger drift when many firms announce the same day; substantial alphas.
- A stop in trading pending or after news, or after a large move; T1 news pending, T2 news released, LUDP volatility pause.
- Speed in the first second is worth nothing; the move happens at the reopening auction.
- 1 000 stocks for eight years; tone with a 2% standard deviation; attention ; an immediate share from a half to one, with a time constant of 0.2 seconds; the rest over five days; halts above 5%.
- 82 351 items, 40.8 a day, 1.18% halted.
- 96.7%, 70.1%, 29.2% and 28.7%.
- Below a second the machines take the immediate part; above, only the drift remains.
- Named result. The share of the move still ahead is 96.7% at 1 millisecond, 93.7% at 10, 70.1% at 100, 29.2% at one second and 28.7% at the next close; a daily trader with an imperfect text model captures 25.4 basis points per item, a Sharpe ratio of 3.24 after costs (1.80 on quiet days, 2.74 on busy ones).
- Attention is spread over more items, so less of each move happens at once: 29.5 against 20.8 basis points of drift per item.
- 44% of the drift (it keeps 25.4 of 45.7 basis points), and the Sharpe ratio falls from 7.6 with a perfect reading to 3.24.
- The model plants the underreaction cleanly and makes the reading’s errors independent; real drift is basis points per story and costs absorb much of it.
- Feed timestamps as received, prices after them, point-in-time tone scores and costs on every story.
- Headline sentiment when traded in the first second; the post-halt reopening for its auction data.
- Chapter 7 traded the drift after earnings in an event study; this chapter measures how much of any item’s move is left for each speed.
- It buys the immediate part of the move; slower traders share what attention leaves behind.
17.10 Interview questions
Interview question 17.1 ★ researcher
How would you turn a news feed into a trading signal?
Solution
Solution of Interview question 17.1.
Map each item to its securities and keep the relevant, novel ones; score its tone with a dictionary or a trained model; decide the reaction window and the horizon; test the signal’s IC by horizon on point-in-time data; size it after costs.
Interview question 17.2 ★★ researcher
Your news backtest shows strong returns. What timestamps would you check first?
Solution
Solution of Interview question 17.2.
The time the feed delivered each item to the firm, against the article’s or vendor’s stated time; the time of the prices used for entry; and whether tone scores or tags were revised after the fact.
Interview question 17.3 ★★ trader
A stock you hold is halted with news pending. What do you do?
Solution
Solution of Interview question 17.3.
Read the news when released, estimate the reopening price from the auction’s indicative price and imbalance, decide whether the position should be kept, cut or hedged in related instruments, and place orders in the reopening auction rather than chasing the first trades after it.
Interview question 17.4 ★★ developer
Design the path from a news vendor’s feed to an order, for a strategy that must act within ten milliseconds.
Solution
Solution of Interview question 17.4.
A direct feed decoded in a process next to the trading engine, pre-computed mappings from entities to securities, a scoring model small enough to run in microseconds, pre-staged orders with risk checks done in advance, co-location with the exchange, and timestamps at every step to measure the latency.
Interview question 17.5 ★★ researcher, trader
Why might a news signal work better on days with many earnings announcements?
Solution
Solution of Interview question 17.5.
Investors have limited attention: with many announcements the same day each one gets less, so prices react less at once and drift more afterwards, as Hirshleifer, Lim and Teoh found.
Interview question 17.6 ★★★ researcher
An item’s immediate move decays as and a share of the total move is immediate. Derive the share of the move still ahead of a trader at latency , and the latency at which half of the immediate part is gone.
Solution
Solution of Interview question 17.6.
At latency the immediate part still ahead is and the drift is untouched, so the share still ahead is . Half of the immediate part is gone at , : 0.14 seconds for .