Strategies I: Equities and Futures · Strategies
29The Asset Managers’ Strategies
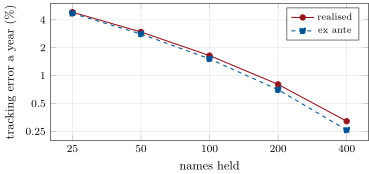
An index is a paper portfolio: it trades for free, never holds cash and rebalances at closing prices. A fund that tracks it pays for every one of those things, and Frino and Gallagher, studying S&P 500 index funds, found tracking error unavoidable because of market frictions; they also found that the index funds, on average, beat active funds after expenses. The craft of the largest asset managers is keeping a portfolio close to a benchmark cheaply, tilting it on purpose, and moving money between portfolios without losing it on the way. On this chapter’s synthetic market, holding the largest 100 of about a thousand names with optimised weights tracks the index to 1.64% a year, the largest 400 to 0.32%; a transition of 59% of a $2 billion fund costs 27.6 basis points if done in a day and least in cost plus risk if spread over two or three. The build is firm.assetmgr.
29.1 Indexing: replication and sampling
Definition 29.1 (Full replication, sampled replication)
Full replication holds every constituent of an index at its index weight. Sampled replication holds a subset of the constituents, with weights chosen so that the portfolio’s risk exposures match the index’s and its forecast tracking error is as small as possible, trading lower costs for some tracking error.
A cap-weighted index of firm.synthmkt’s listed names drifts with prices by itself: holding it exactly needs trades only when names enter or leave, a one-way turnover of 6.4% a year here. Sampling needs a risk model to decide which names stand for which. The chapter uses the synthetic market’s own truth, the best case: each name’s beta on the market factor (with its conditional variance), industry factors at 8% a year, the three styles at their planted volatilities with point-in-time exposures, and each name’s specific volatility (Book 7, chapter 24 estimates such a model from returns). Listing 29.1 keeps the largest names and solves a quadratic programme for the long-only weights that minimise the ex-ante tracking error; the book is rebalanced every 63 days and drifts with returns in between.
| names held | 25 | 50 | 100 | 200 | 400 |
|---|---|---|---|---|---|
| realised tracking error | 4.84% | 2.96% | 1.64% | 0.81% | 0.32% |
| ex-ante tracking error (mean) | 4.70% | 2.81% | 1.52% | 0.71% | 0.26% |
| one-way turnover a year | 1.34 | 1.13 | 0.92 | 0.58 | 0.31 |
| cost a year at 10 bp per unit traded (bp) | 13.4 | 11.3 | 9.2 | 5.8 | 3.1 |
Tracking error falls fast with the number of names (Figure 29.1), by 40% to 60% for each doubling, because each added name is smaller and the specific risk left out falls with the index weight left out. The ex-ante figure understates the realised one a little even with the true model: between rebalances the weights drift and listings change. Costs go the other way from what one might expect: the small samples trade more, because their weights must be re-optimised as the index moves. Over the ten years the 25-name sample happened to beat the index by 3.0% a year; with a tracking error of 4.84%, that is noise, and a sample that holds only the largest names is a bet on large caps.
s1_assetmgr.replicate.Real index funds add what the model leaves out: dividends to reinvest, cash flows from investors, index changes announced in advance (chapter 10), and the choice of when to trade them. Frino, Gallagher and Oetomo found that passive funds benefit from less rigid rebalancing, that enhanced index funds rebalance earlier and more patiently around index revisions and pay less for it, and that passive funds, when they deviate from the index, tend to overweight larger, more liquid stocks.
29.2 Factor products
Definition 29.2 (Factor product)
A factor product is a rules-based portfolio, usually long-only, that tilts a broad index toward a style (value, momentum, quality, low volatility, size) by a published rule, sold as a fund or an index at a fee between an index fund’s and an active manager’s.
A factor product sells exposure, not return. The chapter tilts the index by on each name’s point-in-time book-to-price z-score:
| tilt | 0.25 | 0.5 | 1.0 |
|---|---|---|---|
| value exposure (z-score units) | 0.26 | 0.52 | 1.03 |
| tracking error | 1.57% | 3.08% | 6.00% |
| excess return a year | 0.07% | 0.07% | 0.06% |
The exposure is delivered as specified, with a tracking error proportional to the tilt; the return is not. The synthetic market plants a value premium, but a book-to-price measured with today’s price is short the planted momentum (chapter 6 found the same), and the two cancel: the product earns almost nothing over ten years. A factor product’s buyer needs a view on the factor, not on the product.
29.3 Benchmark-relative management
Active managers measured against a benchmark live in the space these tools define. Their risk is tracking error, their skill is information ratio (Book 1, chapter 3). The mean–variance answer to how much tracking error to take is simple: a manager with information ratio IR, penalising active variance with a coefficient , maximises and takes ; Grinold and Kahn’s Active Portfolio Management develops the whole framework. The sampled index is the zero-skill end of that line, the factor product a constant tilt, and the active manager a time-varying one. The chapter’s tools apply to all three: the same risk model sets tracking error, the same optimiser keeps exposures inside limits, and the same costs decide how often to rebalance.
29.4 Transition management
Definition 29.3 (Transition management)
Transition management is the moving of a portfolio from one set of holdings to another (a new manager, a new benchmark, a new allocation) at the lowest implementation shortfall, balancing the market impact of trading fast against the risk of holding the old portfolio while the new one is built.
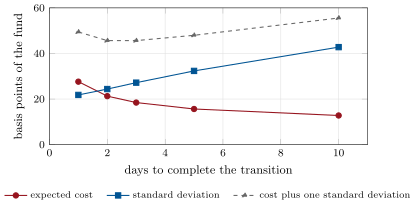
A pension fund replacing its 100-name index sample with the value product (a tilt of 0.5) must trade 59% of a $2 billion fund, one way. Trading it in one day pays the half spread (5 basis points, assumed) and a square-root impact on each name’s daily volatility (firm.tcost, with , assumed); spreading it over more days cuts the impact but leaves the unexecuted part exposed to the active risk between the two portfolios, 3.46% a year (21.8 basis points a day). Listing 29.1 includes the planner.
| days to complete | 1 | 2 | 3 | 5 | 10 |
|---|---|---|---|---|---|
| expected cost (bp of the fund) | 27.6 | 21.3 | 18.5 | 15.6 | 12.8 |
| standard deviation of the outcome (bp) | 21.8 | 24.4 | 27.2 | 32.3 | 42.8 |
| cost plus one standard deviation (bp) | 49.4 | 45.6 | 45.6 | 48.0 | 55.6 |
The trade-off (Figure 29.2) has a broad minimum at two to three days for a planner who weighs one standard deviation of risk as heavily as a basis point of cost; a planner who cares only about expected cost would take ten days and a 43 basis point standard deviation. Real transitions reduce both by crossing: the old and new portfolios often share names, and trades between them, or against other clients’ flows, need not touch the market (Book 7, chapter 27).
s1_assetmgr.transition_plan.29.5 Strategy files
Strategy file 29.1 — Sampled index replication
Who pays you, and why. Investors paying a small fee for the market’s return at low cost and low tracking error.
Instruments and venues. Index constituents; futures for cash equitisation.
Signal. None: the index and a risk model.
Sizing and execution. Full replication where costs allow, sampling otherwise; trades at the close on index changes, or patiently around them.
Costs. Turnover from index changes and re-optimisation.
How it dies. It does not; fees compete toward zero.
Horizon, capacity, infrastructure. Permanent; very large capacity; index data, a risk model, an optimiser.
Backtest honestly. The index as it was, with its changes and their announcement dates; dividends and cash.
Sources. Frino and Gallagher (2001); this chapter: 1.64% tracking error with 100 names, 0.32% with 400.
Strategy file 29.2 — Enhanced indexing and factor products
Who pays you, and why. Investors wanting a factor premium or small excess returns at a known tracking error.
Instruments and venues. Index constituents.
Signal. A published tilt rule, or patient trading around index changes.
Sizing and execution. Tilts sized to a tracking-error budget; rebalanced on schedule.
Costs. Moderate turnover.
How it dies. Factors that stop paying; crowding.
Horizon, capacity, infrastructure. Years; large capacity.
Backtest honestly. Point-in-time exposures; the factor’s interaction with others (value against momentum).
Sources. Frino, Gallagher and Oetomo (2005); this chapter: exposure delivered, return near zero.
Strategy file 29.3 — Transition management
Who pays you, and why. Asset owners changing managers or allocations, who pay to avoid the shortfall of doing it badly.
Instruments and venues. Both portfolios’ holdings; crossing networks; futures for interim exposure.
Signal. The trade list and the active risk between the two portfolios.
Sizing and execution. A schedule balancing impact against risk; crossing first.
Costs. Spread, impact and the risk of the unexecuted part.
How it dies. It does not; it competes on execution.
Horizon, capacity, infrastructure. Days; a cost model and a risk model.
Backtest honestly. Implementation shortfall against the prices at the decision, not at completion.
Sources. This chapter: 27.6 basis points in one day, least cost plus risk over two or three days.
29.6 Tutorial: invisible craft
Goal. Replicate the synthetic index by sampling, measure tracking error and costs by the number of names, build a value product, and plan a transition. End state: the tables and the two figures.
Sampling, drift, tilts and transitions.
def sampled(b, Sigma, n: int):
    b = np.asarray(b, float)
    keep = np.argsort(-b)[:n]
    S = Sigma[np.ix_(keep, keep)]
    # minimise (w - b)' Sigma (w - b) over w on `keep`: w_k' S w_k - 2 w_k' (Sigma b)_k, sum w = 1, w >= 0
    q = -(Sigma @ b)[keep]
    res = qp(2 * S, 2 * q, A=np.ones((1, n)), b=np.array([1.0]), G=-np.eye(n), h=np.zeros(n), tol=1e-10)
    w = np.zeros(len(b))
    w[keep] = np.maximum(res["x"], 0.0)
    w /= w.sum()
    a = w - b
    return w, math.sqrt(max(a @ Sigma @ a, 0.0))


def drift_active(R, w0, b_path, start: int, end: int):
    R = np.nan_to_num(np.asarray(R, float))
    w = np.asarray(w0, float).copy()
    out = np.zeros(end - start)
    for i, t in enumerate(range(start, end)):
        out[i] = w @ R[t] - b_path[t - 1] @ R[t]
        w = w * (1 + R[t])
        w /= max(w.sum(), 1e-12)
    return out, w


def tilt(b, z, k: float):
    w = np.asarray(b, float) * np.exp(k * np.nan_to_num(np.asarray(z, float)))
    return w / w.sum()


def transition(value, adv, sigma, half_spread: float, eta: float, active_sd: float, days: int):
    v = np.abs(np.asarray(value, float))
    part = v / days / np.maximum(np.asarray(adv, float), 1e-12)
    cost = float((v * (half_spread + impact_bp(eta, sigma, part))).sum())
    remaining = [(days - d) / days for d in range(days)]          # share still to trade at the start of each day
    risk = active_sd * math.sqrt(sum(x * x for x in remaining))
    return cost, risk
Listing 29.1. Sampled replication, drift, tilts and the transition planner. code/firm/assetmgr/firm_assetmgr.py The replication backtest: optimise every 63 days, drift in between.
def replicate(n: int):
    P, _, b = market()
    T = len(P.ret)
    active, te_ex, turn = [], [], 0.0
    w_prev = None
    for t in range(START, T - 1, REBAL):
        w, te = sampled(b[t], sigma_at(t), n)
        te_ex.append(te * math.sqrt(252))
        if w_prev is not None:
            turn += np.abs(w - w_prev).sum()
        a, w_prev = drift_active(P.ret, w, b, t + 1, min(t + 1 + REBAL, T))
        active.append(a)
    a = np.concatenate(active)
    years = len(a) / 252
    return {"te": float(a.std() * math.sqrt(252)), "te_ex": float(np.mean(te_ex)), "turnover": turn / years,
            "cost": COST * turn / years, "mean_active": float(a.mean() * 252)}
Listing 29.2. Sampled replication over ten years. code/strategies-1/29-the-asset-managers-strategies/python/s1_assetmgr.py - Run
replicate(n)for five sizes,full_turnover(),value_product(k)andtransition_plan(), andfig_assetmgr.py.
What to change next. Estimate the risk model from returns (Book 7, chapter 24) instead of using the truth and compare tracking errors; select names by stratifying on industry instead of size; cross the transition’s overlapping names before trading.
29.7 Build: the asset manager’s toolkit
Purpose. Index weights, sampled replication, drift of held weights, factor tilts and a transition planner.
Interface. cap_weights(price, shares, listed), covariance(B, F, D), sampled(b, Sigma, n), drift_active(R, w0, b_path, start, end), tilt(b, z, k), transition(value, adv, sigma, half_spread, eta, active_sd, days).
Rules. Long-only weights summing to one; the index from the previous close; costs from firm.tcost.
Acceptance tests. code/firm/assetmgr/tests/: cap weights and a covariance by hand, sampling with all names giving zero tracking error and with ten names a positive one, drift, a neutral tilt, and a transition’s cost falling and risk rising with days.
Stretch. Stratified sampling; an estimated risk model; crossing in transitions.
Sources and further reading
- A. Frino and D. R. Gallagher, “Tracking S&P 500 index funds”, Journal of Portfolio Management 28(1), 2001.
- A. Frino, D. R. Gallagher and T. N. Oetomo, “The index tracking strategies of passive and enhanced index equity funds”, Australian Journal of Management 30(1), 2005.
- R. C. Grinold and R. N. Kahn, Active Portfolio Management, 2nd ed., McGraw-Hill, 2000.
29.8 Exercises
Exercise 29.1 ★
If tracking error fell with the square root of the number of names, by what factor would doubling the names cut it? What does the table show from 25 to 50 names, and from 100 to 200?
Solution
Solution of Exercise 29.1.
By . The table shows from 25 to 50 names and from 100 to 200: faster than the square root, because the names added are ever smaller in the index and the weight left out shrinks faster than the number of names grows.
Exercise 29.2 ★
Holding the index exactly turns over 6.4% a year. At 10 basis points per unit traded, what does it cost?
Solution
Solution of Exercise 29.2.
basis points a year.
Exercise 29.3 ★
Why does a factor product’s tracking error grow with the tilt while its return need not?
Solution
Solution of Exercise 29.3.
Tracking error measures how far the weights are from the index, which grows with the tilt; the return depends on what the tilted factor earns, which the product does not control.
Exercise 29.4 ★★
The transition’s active risk is 3.46% a year. What is it per day, and why is that the standard deviation of a one-day transition?
Solution
Solution of Exercise 29.4.
, 21.8 basis points a day. Over a one-day transition the whole trade list is exposed for one day to the difference between the old and new portfolios, whose daily standard deviation this is.
Exercise 29.5 ★★
Why is the realised tracking error of a sample larger than its ex-ante tracking error even with the true risk model?
Solution
Solution of Exercise 29.5.
Between rebalances the held weights drift with returns while the optimal weights would change, listings enter and leave the index, and the ex-ante figure is an average over rebalance dates of forecasts made with that day’s exposures.
Exercise 29.6 ★★
With a value premium of 3% a year per unit of exposure, what would a tilt with an exposure of 0.52 earn if value were uncorrelated with everything else? Why did it earn 0.07%?
Solution
Solution of Exercise 29.6.
a year. It earned 0.07% because book-to-price measured with today’s price loads negatively on the planted momentum, whose premium offsets the value premium (chapter 6).
Exercise 29.7 ★★★
Coding. Change the transition’s objective to cost plus two standard deviations. How many days does the planner choose now?
Solution
Solution of Exercise 29.7.
Cost plus two standard deviations is 71.2, 70.0, 72.8, 80.3 and 98.3 basis points for 1, 2, 3, 5 and 10 days: the planner chooses two days. More aversion to risk shortens the transition.
Exercise 29.8 ★★★
Find the flaw. “Our 50-stock index sample beat the index by 2% a year for ten years, so sampling adds value.”
Solution
Solution of Exercise 29.8.
A sample of the 50 largest names is a bet on large caps against the rest; with a tracking error near 3%, ten years of 2% a year is within about two standard errors of zero, and the synthetic 50-name sample did the same with no skill. The purpose of sampling is low tracking error at low cost, not excess return.
29.9 Problem: Invisible Craft
Problem 29.1
Weekend problem — an index, a tilt and a transition
The chapter’s synthetic market and the public record.
Part I — Indexing.
- Define full and sampled replication.
- What did Frino and Gallagher find about index funds?
- Why does holding the index exactly need so little trading?
- Describe the chapter’s risk model and sampling optimiser.
Part II — Sampling.
- Give the realised and ex-ante tracking errors by the number of names.
- Why do small samples trade more?
- What did the 25-name sample’s excess return mean?
- What did Frino, Gallagher and Oetomo find about rebalancing?
Part III — Products and benchmarks.
- Define a factor product and give its exposure, tracking error and return by tilt.
- Why did the value product earn almost nothing?
- How does Grinold and Kahn’s framework budget tracking error?
- Define transition management.
Part IV — The verdict.
- State the named result: the tracking error of sampled replication against the number of names held, and the transition’s shortfall.
- What limits the transition’s speed, and what limits its patience?
- How does crossing reduce a transition’s cost?
- What would an estimated risk model change?
- How would you backtest an index fund honestly?
- Which strategy file depends most on the risk model?
- How does this chapter relate to chapter 10?
- In one sentence: what is the asset manager’s craft?
Solution
Solution of Problem 29.1.
- Holding every constituent at index weight; holding a subset weighted to match the index’s risk.
- Tracking error is unavoidable because of frictions, and index funds on average beat active funds after expenses.
- Cap weights drift with prices by themselves; only entries and exits need trades (6.4% a year).
- The market’s true exposures (beta, industries, point-in-time styles) and specific risks; a QP over the largest names minimising ex-ante tracking error, long-only.
- 4.84, 2.96, 1.64, 0.81 and 0.32% realised; 4.70, 2.81, 1.52, 0.71 and 0.26% ex ante, for 25 to 400 names.
- Their weights must be re-optimised as the index moves, and each re-optimisation moves more weight.
- Nothing: a bet on large caps within its tracking error.
- Passive funds benefit from less rigid rebalancing; enhanced funds rebalance earlier and more patiently and pay less.
- A rules-based tilt toward a style; exposures 0.26, 0.52 and 1.03, tracking errors 1.57, 3.08 and 6.00%, returns 0.06–0.07%.
- Value measured with today’s price is short momentum in this market.
- Take tracking error for information ratio IR and aversion to active variance.
- Moving holdings between portfolios at the least shortfall, balancing impact against the risk of the unexecuted part.
- Named result. Sampled replication tracks the synthetic index to 4.84%, 2.96%, 1.64%, 0.81% and 0.32% a year with 25, 50, 100, 200 and 400 names; the transition of 59% of a $2 billion fund costs 27.6 basis points in one day (21.8) and 18.5 in three (27.2), with cost plus one standard deviation least at two to three days (45.6).
- Impact limits speed; active risk limits patience.
- Names common to both portfolios, or traded against other flows, change owner without market impact.
- Larger ex-ante errors and a larger gap to realised tracking error.
- The index as it was, announcement dates, dividends, cash flows and costs.
- Sampled index replication.
- Chapter 10 traded the index changes that index funds must follow; here the funds’ side.
- Keeping a portfolio close to a target cheaply, and moving it without losing money on the way.
29.10 Interview questions
Interview question 29.1 ★ researcher
What causes an index fund’s tracking error?
Solution
Solution of Interview question 29.1.
Costs and fees, cash drag from flows and dividends, trading at prices other than the index’s closing prices, sampling instead of full replication, and timing of trades around index changes.
Interview question 29.2 ★★ researcher
How would you choose which names to hold in a sampled replication of a 3 000-name index?
Solution
Solution of Interview question 29.2.
Hold the largest names fully, then choose among the rest by an optimiser that matches industry, country and style exposures at the least tracking error, with liquidity limits; or stratify by industry and size and pick representative names in each cell.
Interview question 29.3 ★★ trader
You must move a $5 billion portfolio to a new manager’s holdings. Walk through the plan.
Solution
Solution of Interview question 29.3.
Build the trade list, cross common names and internal flows first, hedge interim exposure with futures if the transition is long, schedule the rest to balance impact against active risk, and report implementation shortfall against the decision prices.
Interview question 29.4 ★★ developer
What data and checks does an index fund need around an index rebalance?
Solution
Solution of Interview question 29.4.
The provider’s announcement with adds, deletes and weight changes, corporate actions, the effective date and time, expected trade sizes against liquidity, and checks that the resulting holdings match the new index within tolerance.
Interview question 29.5 ★★ risk
How would you monitor a factor product’s risk, and what would make you worried?
Solution
Solution of Interview question 29.5.
Its exposure to the target factor and to others it picks up (a value product’s momentum exposure), tracking error against the parent index, crowding in the factor, and liquidity; worry when unintended exposures grow or the factor’s correlation with others changes.
Interview question 29.6 ★★★ researcher
A trade list is executed evenly over days with expected cost (square-root impact) and risk . Approximate the risk for large and find the that minimises cost plus times risk.
Solution
Solution of Interview question 29.6.
, so the risk is about . Minimising gives , so .