Strategies I: Equities and Futures · Strategies
20Carry Across Asset Classes
Borrow in a currency that pays little interest, lend in one that pays a lot, and collect the difference as long as the exchange rate does not move against you. It usually does not move enough, and the currency carry trade has paid for decades; then, in a few weeks, the high-yielding currencies fall together and years of income go. Koijen, Moskowitz, Pedersen and Vrugt showed that the same idea, the return an asset earns if its price does not change, predicts returns in equities, bonds, commodities, credit and options as well as currencies, and that the carry strategies of all classes do badly together in global recessions. On the synthetic universe a diversified carry book earns a Sharpe ratio of 0.95 when all the carry is earned, and loses 26% of its capital, at 10% volatility, in the second stock crash. The build is firm.carrystrat.
20.1 Carry everywhere
Book 1, chapter 7 defined carry as what a position earns if prices stay where they are. For a futures position it has a common form: with a spot or reference price and a futures price for delivery in years, the carry is , the futures price’s convergence to the spot if the spot does not move. Each class gives it a name.
- Currencies: the forward discount, the interest rate of the foreign currency minus the domestic one.
- Equity indices: the dividend yield minus the financing rate.
- Government bonds: the yield over the financing rate plus the roll-down, the price gain as a bond ages down an upward-sloping curve.
- Commodities: the roll yield, positive in backwardation (futures below spot) and negative in contango, set by storage costs and the convenience yield (Book 3, chapter 10).
Koijen and co-authors write a futures position’s expected excess return as its carry plus the expected change in the spot price. If spot prices do not move on average, the whole carry is earned; if they moved to cancel it, as the expectations hypothesis and uncovered interest parity would have them do, none would be. firm.synthfut plants a share of the carry as expected return: in the universe of all these chapters, and in a variant where prices do not move against carry.
Definition 20.1 (Carry strategy)
A carry strategy holds long positions in the assets of a class with the highest carry and short positions in those with the lowest, with weights that increase with the carry’s rank, rebalanced as carries change; it earns the carry spread and bears the risk that prices move against it.
In the synthetic universe carry is read from the curve (Listing 20.1): the log slope between the first two monthly contracts, 21 trading days apart, annualised. For most markets this equals the planted carry exactly, because the model’s curves are straight lines in maturity. For the three seasonal commodities it does not: their curves carry the annual cycle of their spot prices, and the one-month slope mostly measures where the season is going. Its correlation with the true carry is 0.05. The slope between contracts twelve months apart cancels the cycle and has a correlation of 1.00. The chapter’s books use it for commodities.
20.2 Carry books by class
Each class’s book weights its ten markets by the centred rank of their carry, with a gross exposure of one, rebalanced daily at 2, 1, 2 and 4 basis points per unit traded by class (Listing 20.2); each is scaled over the whole sample to 10% volatility, and the diversified book gives each class the same weight.
Definition 20.2 (Diversified carry)
Diversified carry is a portfolio of carry strategies in several asset classes, each scaled to a similar risk, which earns the carry premia of all classes at a volatility lower than any one, as long as their returns are not correlated.
| Sharpe ratio after costs | equities | bonds | currencies | commodities | diversified |
|---|---|---|---|---|---|
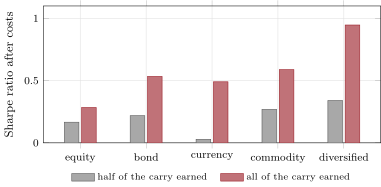
| half of the carry earned () | 0.17 | 0.22 | 0.03 | 0.27 | 0.34 |
| all of the carry earned () | 0.28 | 0.53 | 0.49 | 0.59 | 0.95 |
| monthly skewness () | 0.13 |
Two things set the numbers. The share of carry earned doubles or triples every class’s Sharpe ratio (Figure 20.1), which is why the empirical question of whether prices move against carry is the whole question. And the diversified book beats every class: four books with little correlation in normal times, each at 10% volatility, combine into one with a Sharpe ratio close to twice that of the average class. The currency book at earns almost nothing because its crashes, described next, take back what its carry pays.
s1_carry.summary.20.3 Carry crashes
Definition 20.3 (Carry crash)
A carry crash is a sudden, large loss of a carry strategy when high-carry assets fall and low-carry assets rise together, typically as leveraged carry positions are unwound in a fall of risk appetite or funding liquidity; it makes the strategy’s returns negatively skewed.
Brunnermeier, Nagel and Pedersen documented the pattern in currencies: exchange rate moves between high- and low-interest-rate currencies are negatively skewed, because carry trades are unwound suddenly when risk appetite and funding liquidity fall. Lustig, Roussanov and Verdelhan found why the premium exists: high-rate currencies load more on a global risk factor, so the carry investor holds global risk, particularly in bad times. The premium is compensation for losing when losing hurts most.
As of September 2026 — The August 2024 carry unwind
The Bank for International Settlements described the market turbulence of early August 2024 in its September 2024 Quarterly Review: after Federal Reserve and Bank of Japan meetings perceived as somewhat hawkish, markets overreacted to a disappointing US labour market release, currency carry trades unwound amid changing rate expectations and higher volatility, and the funding currencies, predominantly the yen, appreciated sharply for a short time. The review cites an estimate of hedge funds’ foreign exchange forward positions of about $160 billion.
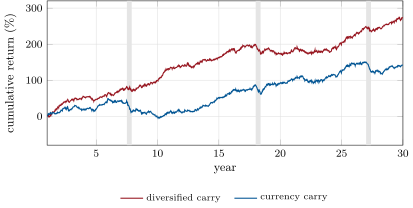
The synthetic universe plants the crash: in each stock crash, high-carry currencies lose 8% per unit of their carry’s z-score over the hundred days. The currency book loses 29.0%, 24.9% and 28.0% in the three crashes (, at 10% volatility) and has the most negative monthly skewness. Crashes also hit the other classes, because the crash moves prices in ways that cut across carry. The diversified book loses 12.9%, 26.3% and 13.1%: in the second crash it lost more than any single class, because every class lost at once (Figure 20.2). That is Koijen and co-authors’ finding in miniature: the classes are uncorrelated on average and correlated when it matters.
s1_carry.paths.Carry and trend make a natural pair. The diversified carry book’s daily returns have a correlation of with chapter 19’s blended trend book (), and in the crashes they move in opposite directions: trend gains, carry loses. A book holding both has smoother returns than either.
20.4 Carry on the WTI curve
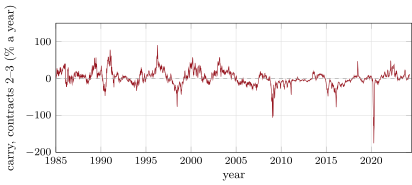
The EIA’s settlements of the second and third WTI contracts, a month apart, give crude oil’s carry from 1985 to 2024 (Figure 20.3). Using them rather than the first contract keeps clear of the contract in its last days before expiry. The average was 1.2% a year; the curve was in backwardation on 51.7% of days. The extremes were a year on 14 January 1991 and on 21 April 2020, the day after the May contract settled below zero (Book 3, chapter 2). A rule that holds the rolled future long in backwardation and short in contango, at a 40% volatility target and 2 basis points a trade, earned 24.8% a year from 1986 to 2024 at a Sharpe ratio of 0.61; this is one market, in sample, with no parameter to fit beyond the sign.
s1_carry.wti.20.5 Strategy files
Strategy file 20.1 — Currency carry
Who pays you, and why. Investors who hedge or fund in low-rate currencies, and the market’s price for global crash risk.
Instruments and venues. Currency forwards and futures of developed and liquid emerging currencies.
Signal. The forward discount (interest differential), ranked.
Sizing and execution. Long high-rate, short low-rate currencies, volatility-scaled; monthly forwards rolled.
Costs. Low; forward points and bid–ask spreads.
How it dies. Crashes when leveraged carry positions unwind together.
Horizon, capacity, infrastructure. Months; large capacity in the major currencies.
Backtest honestly. Forward rates as quoted, not interest-rate proxies; the crash years in the sample.
Sources. Brunnermeier, Nagel and Pedersen (2008); Lustig, Roussanov and Verdelhan (2011); the dated box.
Strategy file 20.2 — Bond carry
Who pays you, and why. Investors paying a term premium to hold short duration.
Instruments and venues. Government bond futures across countries.
Signal. The yield over the financing rate plus roll-down, ranked.
Sizing and execution. Duration-neutral or volatility-scaled long–short.
Costs. Low.
How it dies. Sharp rises in rates at the front of steep curves.
Horizon, capacity, infrastructure. Months; a curve model per country.
Backtest honestly. Carry from the curve known at the time, with the cheapest-to-deliver of each future.
Sources. Koijen, Moskowitz, Pedersen and Vrugt (2018).
Strategy file 20.3 — Commodity roll yield
Who pays you, and why. Hedgers paying to lay off inventory risk; the market’s price for scarcity.
Instruments and venues. Commodity futures.
Signal. The curve’s slope, over twelve months for seasonal commodities.
Sizing and execution. Long backwardated, short contango commodities, volatility-scaled.
Costs. Moderate; rolls.
How it dies. Storage gluts and squeezes that invert the relation between slope and return.
Horizon, capacity, infrastructure. Months.
Backtest honestly. The contracts that would have been held, not the nearby; seasonal slopes separated from carry.
Sources. Koijen, Moskowitz, Pedersen and Vrugt (2018); this chapter’s seasonal test.
Strategy file 20.4 — Diversified carry
Who pays you, and why. The carry premia of all classes at once.
Instruments and venues. Futures and forwards in equities, bonds, currencies and commodities.
Signal. Carry in each class, ranked within the class.
Sizing and execution. Each class at the same risk; rebalanced monthly or as carries change.
Costs. Low to moderate.
How it dies. Correlated losses in global recessions, when diversification disappears.
Horizon, capacity, infrastructure. Months; a data pipeline for every class’s carry.
Backtest honestly. Carry measures defined before the test; recessions in the sample.
Sources. Koijen, Moskowitz, Pedersen and Vrugt (2018); this chapter: 0.95 with all carry earned, a 26.3% loss in a crash.
Strategy file 20.5 — WTI curve carry
Who pays you, and why. Producers and consumers hedging, who pay for immediacy in backwardation and for storage in contango.
Instruments and venues. NYMEX WTI futures, rolled.
Signal. The sign of the slope between the second and third contracts.
Sizing and execution. Long in backwardation, short in contango, at a volatility target.
Costs. Rolls and spreads.
How it dies. As one market, it has no diversification; storage limits (April 2020).
Horizon, capacity, infrastructure. Weeks to months.
Backtest honestly. The rolled series; the slope from contracts clear of expiry.
Sources. EIA settlements; this chapter: a Sharpe ratio of 0.61, 1986–2024, in sample.
20.6 Tutorial: autumn in the synthetic market
Goal. Read carry from the synthetic curves, build carry books by class and diversified under two assumptions about how much carry is earned, measure them in the crashes, and read crude oil’s carry from the EIA curve. End state: the table and the three figures.
Carry measures and rank weights.
def curve_carry(f_near, f_far, days: float):
    return (np.asarray(f_near, float) - np.asarray(f_far, float)) * 252.0 / days


def forward_discount(log_spot, log_fwd, days: float):
    return (np.asarray(log_spot, float) - np.asarray(log_fwd, float)) * 252.0 / days


def dividend_carry(div_yield, rate):
    return np.asarray(div_yield, float) - np.asarray(rate, float)


def rank_weights(x, groups):
    x, groups = np.asarray(x, float), np.asarray(groups)
    w = np.zeros(x.shape)
    for g in np.unique(groups):
        m = groups == g
        xs = x[..., m]
        rk = np.argsort(np.argsort(xs, axis=-1), axis=-1).astype(float)
        c = rk - rk.mean(axis=-1, keepdims=True)
        w[..., m] = c / np.abs(c).sum(axis=-1, keepdims=True)
    return w
Listing 20.1. Carry by class and rank weights within groups. code/firm/carrystrat/firm_carrystrat.py The books: one per class, then the diversified book.
def books(signal: str = "near", premium: float = 0.5):
    """Per class P&L (scaled to 10%) and the diversified book (equal weights, scaled to 10%)."""
    F = market(premium)
    sig = F["carry_near"] if signal == "near" else F["carry_year"] if signal == "year" else F["carry"]
    if signal == "mixed":                                  # twelve-month slope for commodities, nearby elsewhere
        sig = np.where(F["cls"] == 3, F["carry_year"], F["carry_near"])
    w = rank_weights(sig, F["cls"])
    per = {}
    for k, name in enumerate(CLASSES):
        m = F["cls"] == k
        per[name] = scale(book(F["r"][:, m], w[:, m], F["cost"][m]), TARGET, START)
    div = scale(np.mean(list(per.values()), axis=0), TARGET, START)
    return per, div
Listing 20.2. Carry books by class and diversified. code/strategies-1/20-carry-across-asset-classes/python/s1_carry.py - Run
carry_quality(),summarywith the mixed signal at premiums 0.5 and 1.0,trend_correlation(),wti(), andfig_carry.py.
What to change next. Scale each class’s book ex ante with an EWMA forecast instead of in sample; add a crash filter that cuts currency carry when volatility jumps; combine carry with chapter 19’s trend book and measure the combined drawdowns.
20.7 Build: carry strategies
Purpose. Carry measures for every class, carry books by rank, and crash diagnostics.
Interface. curve_carry(f_near, f_far, days), forward_discount(log_spot, log_fwd, days), dividend_carry(div_yield, rate), rank_weights(x, groups), book(r, w, cost), scale(pnl, target, start), windows(pnl, spans), skew_monthly(pnl, start, days).
Rules. Carry annualised on 252 days; ranks within each group; weights with a gross of one per group; P&L from weights set at the previous close.
Acceptance tests. code/firm/carrystrat/tests/: carry from two prices, a forward and a dividend yield by hand; rank weights by group; P&L, costs, windows and a skewed series.
Stretch. Ex-ante scaling; carry from full curves with roll-down; crash filters.
Sources and further reading
- R. S. J. Koijen, T. J. Moskowitz, L. H. Pedersen and E. B. Vrugt, “Carry”, Journal of Financial Economics 127(2), 2018.
- M. K. Brunnermeier, S. Nagel and L. H. Pedersen, “Carry trades and currency crashes”, NBER Macroeconomics Annual 23, 2008.
- H. Lustig, N. Roussanov and A. Verdelhan, “Common risk factors in currency markets”, Review of Financial Studies 24(11), 2011.
- Bank for International Settlements, “Carry off, carry on”, BIS Quarterly Review, September 2024.
20.8 Exercises
Exercise 20.1 ★
Two futures contracts 21 trading days apart are priced at 100 and 98. What is the carry, annualised on 252 days?
Solution
Solution of Exercise 20.1.
: 24.2% a year, a steeply backwardated curve.
Exercise 20.2 ★
The domestic interest rate is 1% and a foreign currency’s is 5%. What is the carry of a long position in the foreign currency’s forward? And of an equity index future with a dividend yield of 2% when the financing rate is 4.5%?
Solution
Solution of Exercise 20.2.
a year for the currency; a year for the index future: a long equity future pays the financing rate and receives the dividends.
Exercise 20.3 ★
Why is the slope between the first two contracts a poor measure of carry for natural gas?
Solution
Solution of Exercise 20.3.
Its spot price has an annual cycle that the curve anticipates: the one-month slope measures mostly where the season is going (winter prices above summer ones), not the carry that would be earned if the whole curve stayed put. On the synthetic seasonal commodities the one-month slope has a correlation of 0.05 with the true carry; a twelve-month slope compares the same season and cancels the cycle.
Exercise 20.4 ★★
The diversified book runs at 10% volatility with a Sharpe ratio of 0.95 and loses 26.3% in a hundred-day crash. How many of its hundred-day standard deviations is that, and what did it expect to earn over the hundred days?
Solution
Solution of Exercise 20.4.
A hundred-day standard deviation is , so the loss is standard deviations. It expected .
Exercise 20.5 ★★
Why does the diversified book lose more than any single class in the second crash?
Solution
Solution of Exercise 20.5.
Diversification relies on the classes’ low correlation, which holds on average; in the crash every class lost at once, so the diversified book, scaled to the same 10% volatility on its low average correlation, holds more gross risk than any one class and loses more.
Exercise 20.6 ★★
Explain, with Koijen and co-authors’ decomposition, why the share of carry earned is “the whole question”.
Solution
Solution of Exercise 20.6.
Expected excess return is carry plus expected price appreciation. Carry is known in advance; the question is how much of it prices take back. If none, the carry book earns its whole carry spread; if prices moved to cancel it, as uncovered interest parity says, it earns nothing. In the synthetic universe the Sharpe ratios roughly double or triple between and .
Exercise 20.7 ★★★
Coding. Run books with the signal near and a premium of 1.0, which reads commodity carry from the first two contracts. What happens to the commodity and diversified Sharpe ratios, and why?
Solution
Solution of Exercise 20.7.
The commodity book falls from 0.59 to 0.34 and the diversified book from 0.95 to 0.82: for the three seasonal commodities the one-month slope ranks the season instead of the carry, so a third of the commodity book trades noise.
Exercise 20.8 ★★★
Find the flaw. “Our currency carry book has had a Sharpe ratio of 1.0 for ten years with a maximum drawdown of 8%: it is a low-risk strategy.”
Solution
Solution of Exercise 20.8.
Ten calm years say little about a strategy whose losses come in rare crashes: the synthetic currency book at 10% volatility lost 25–29% in each crash. Measure the skewness and the exposure to global risk, stress the book with past unwinds, and size it for the crash, not the calm.
20.9 Problem: Autumn in the Synthetic Market
Problem 20.1
Weekend problem — carry through a crash
The chapter’s synthetic universe, the WTI curve and the public record.
Part I — Carry.
- Define carry for a futures position and name it in each class.
- Write Koijen and co-authors’ decomposition of expected return.
- Define a carry strategy and diversified carry.
- How is carry read from the synthetic curves, and what goes wrong for seasonal commodities?
Part II — The books.
- Describe the books: weights, costs, scaling.
- Give the Sharpe ratios by class and diversified for and .
- Why does the diversified book beat every class?
- Why does the currency book earn almost nothing at ?
Part III — Crashes.
- Define a carry crash; what did Brunnermeier, Nagel and Pedersen find?
- What did Lustig, Roussanov and Verdelhan find?
- Give the currency and diversified books’ losses in the three crashes.
- What does the dated box describe?
Part IV — The verdict.
- State the named result: the diversified carry book’s Sharpe ratio and its loss in the crash, against each class alone.
- How do carry and trend combine?
- What was WTI’s carry from 1985 to 2024, and what did the sign rule earn?
- What do the extremes of WTI’s carry correspond to?
- How would you backtest a carry strategy honestly?
- Which strategy file is most exposed to storage limits?
- What did Koijen and co-authors find about carry across classes in recessions?
- In one sentence: what is a carry investor paid for?
Solution
Solution of Problem 20.1.
- The return if prices stay unchanged, ; forward discount, dividend yield minus financing, yield plus roll-down, roll yield.
- Expected excess return equals carry plus expected price appreciation.
- Long high-carry and short low-carry assets of a class by rank; carry books of several classes at equal risk.
- As the log slope between the first two contracts; for seasonal commodities the slope measures the season (correlation 0.05), so a twelve-month slope is used.
- Centred ranks with a gross of one, 2, 1, 2 and 4 basis points per unit traded, each class scaled in sample to 10%; the diversified book equally weighted and scaled the same way.
- : 0.17, 0.22, 0.03, 0.27 and 0.34; : 0.28, 0.53, 0.49, 0.59 and 0.95.
- Four books with low average correlation combine into one with a Sharpe ratio about twice the average class’s.
- Its crashes take back the carry it earns.
- A sudden loss when high-carry assets fall together; negatively skewed moves between high- and low-rate currencies, from unwinding when funding liquidity falls.
- High-rate currencies load more on a global risk factor, so carry investors hold global risk in bad times.
- Currency: 29.0%, 24.9% and 28.0%; diversified: 12.9%, 26.3% and 13.1% ().
- The unwind of currency carry trades in early August 2024 and the short-lived rise of the yen.
- Named result. With all carry earned the diversified book’s Sharpe ratio is 0.95 against 0.28–0.59 for single classes; in the second crash it lost 26.3% at 10% volatility, more than any class alone (currencies 24.9%, equities 12.4%, commodities 11.3%, bonds 4.1%).
- Their returns are uncorrelated on average and opposite in crashes: trend gains, carry loses.
- An average of 1.2% a year, backwardation on 51.7% of days; 24.8% a year at a Sharpe ratio of 0.61.
- on 14 January 1991 and on 21 April 2020, the day after the May contract settled below zero.
- Carry from prices known at the time, the contracts actually held, costs, and crash periods in the sample.
- WTI curve carry.
- Carry strategies of all classes do poorly together in global recessions.
- For holding assets that lose in bad times: global risk and crash risk.
20.10 Interview questions
Interview question 20.1 ★ researcher
What is carry for a currency, a bond future and a commodity future?
Solution
Solution of Interview question 20.1.
The interest differential (forward discount); the yield over the financing rate plus the roll-down; the roll yield, the slope of the curve from the spot or nearby to the contract held.
Interview question 20.2 ★★ researcher
Why would uncovered interest parity imply that currency carry earns nothing, and what does the evidence say?
Solution
Solution of Interview question 20.2.
Uncovered interest parity says high-rate currencies depreciate by the rate difference on average, so the carry is taken back. Empirically they have depreciated by less, often not at all on average, with occasional crashes; the difference is the carry premium.
Interview question 20.3 ★★ trader
Volatility jumps and the yen rallies 3% in a day. What do you do with a currency carry book?
Solution
Solution of Interview question 20.3.
Recognise the start of an unwind: cut gross exposure to limits set in advance, starting with the most crowded pairs, rather than waiting for losses to force it; avoid adding into the move; reassess when volatility settles.
Interview question 20.4 ★★ risk
How would you measure the crash risk of a carry book that has never had a bad month in its history?
Solution
Solution of Interview question 20.4.
With stress tests on past unwinds applied to today’s positions, the skewness of its returns in longer samples and other markets, its beta to global risk factors, and the positioning of other carry traders.
Interview question 20.5 ★★ developer
What data does a diversified carry book need each day, and what can go wrong with it?
Solution
Solution of Interview question 20.5.
Forward points and interest rates, dividend forecasts and index futures prices, bond curves and cheapest-to-deliver data, commodity curves by contract, roll calendars and volatility forecasts; stale quotes, missing contracts, holidays, roll errors and currency conversions can all corrupt a carry.
Interview question 20.6 ★★★ researcher
A futures price is with a constant carry and a spot following a martingale. Show that the position’s expected return is per unit time, and find the expected return when instead .
Solution
Solution of Interview question 20.6.
and , so (plus a second-order term that vanishes in expectation with ). With a martingale, . With , : the share of the carry is earned.