Strategies I: Equities and Futures · Strategies
18Asia-Specific Equity Strategies
A Shanghai stock reaches its ten per cent limit up at 10:05 and stays there all day; the buyers who could not trade are still there tomorrow, and it opens higher. Seasholes and Wu found that such events draw individual investors who did not own the stock, that prices rise and then revert over the following week, and that smart traders who bought on the limit day and sold the next earned an average of 1.16% a day. Chen, Gao, He, Jiang and Xiong found large investors doing the same, and pushing prices to the limit to do it. On this chapter’s synthetic limit market, a buyer at every limit-up close would gain 4.5% by the next open; a buyer who joins the queue at the limit gains 2.6%, because the queue fills when the lock is weakest; and the price gives back 2.8% over the following week. The build is firm.limitmkt.
18.1 Price limits and T+1
Book 1, chapter 12 described the rules: mainland main-board shares may move 10% a day, those on the growth boards 20%, and shares bought cannot be sold the same day (its dated box has the current widths). It also showed what limits do to the data: a limit splits a large move over several days, so observed returns after a limit day continue, and a signal that sees the continuation in closing prices has found a return that cannot be bought at those prices. This chapter is about the trades that can.
Definition 18.1 (Limit-hit continuation)
Limit-hit continuation is the tendency of a stock that closes locked at its daily limit to move further in the same direction at the next open, because the part of the move the limit held back, and the orders queued at the limit, carry over to the next day.
firm.limitmkt prints a limit market from fair returns (Listing 18.1). It takes the synthetic market’s ten years on 1 000 names, scales their returns by 1.5 to a daily volatility of 3.1%, and moves each close toward the fair value plus an attention premium, but never beyond the limit. A close at the upper limit draws attention buyers the next morning, adding 3% to the target, a premium that decays by 0.6 a day. The part of a move beyond the limit waits for the next open. And a buy order joining the queue at a locked limit fills with a probability that falls with how far beyond the limit the stock’s value is: a lock that barely holds fills, one with a large backlog does not. That last rule is the queue’s adverse selection. The buyers most likely to be filled are those who least wanted to be.
Definition 18.2 (Magnet effect)
The magnet effect is the tendency of prices to accelerate toward a daily price limit as they approach it, more strongly toward the upper limit than the lower, as traders hurry to trade before the limit stops them or push the price to lock.
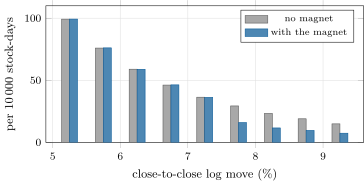
Cho, Russell, Tiao and Tsay documented the magnet effect in Taiwan; Chen and co-authors explained it with large investors who push prices to the upper limit and sell the next day. The layer plants their mechanism: half the targets within 2% below the upper limit are pushed to lock, closing above their fair value. Figure 18.1 shows the footprint: with the magnet, days that would close 7.5% to 9.5% up are half as frequent and limit-up closes rise from 0.87% of stock-days to 1.29%.
s1_asia.band.The next table follows every limit-up close for a week (Listing 18.2). The trade is the one the rules allow: buy at the limit on the lock day, sell at the next open. It is also what the T+1 rule makes necessary, since the shares cannot be sold the same day.
| limit-up closes at a 10% limit | all | value beyond the limit | pushed |
|---|---|---|---|
| share of the closes | 100% | 67% | 33% |
| return to the next open, every close | 4.51% | 5.90% | 1.67% |
| queue fill probability | 57% | 36% | 100% |
| return to the next open, weighted by fills | 2.64% | 3.96% | 1.67% |
| next open to the close five days later |
Two effects make the overnight gain. The backlog is the part of the move held back by the limit; without attention or magnet it gives 3.42% to the next open (1.21% after fills). The attention buyers add most of the rest, and take it back over the week. The pushed locks earn little overnight, because they closed above their value, but they still draw the attention buyers. Fills cut the gain from 4.51% to 2.64%: the buyer who could not be filled in the strongest locks is the rule, not the exception. At a round trip of 15 basis points (the sell-side stamp duty of the dated box plus assumed commissions and spread) the filled trade still clears 2.49% on average, about twice the smart traders’ 1.16% in Seasholes and Wu, because the model’s backlog and attention are clean and every queue position is equal.
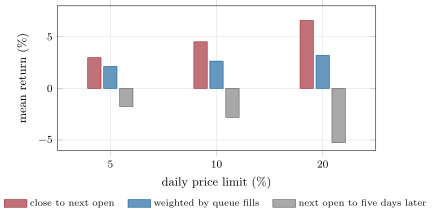
s1_asia.limit_ups.The width decides how often and how hard (Figure 18.2). A 5% limit locks on 11.24% of stock-days (the synthetic stocks are volatile), a 10% limit on 1.29%, a 20% limit on 0.10%. The wider the limit, the more extreme the move behind each lock: the next-open gain rises from 2.98% to 4.51% and 6.58%, the filled gain from 2.12% to 2.64% and 3.20%, and the week’s give-back from 1.76% to 2.81% and 5.27%. The 20% column rests on 2 325 events and its week-after figure is noisy; the next-open means have standard errors of 0.02 points at 10% and 0.1 at 20%.
As of September 2026 — Mainland costs and Connect data
From 28 August 2023 the stamp duty on trading Shanghai and Shenzhen shares was halved, from 0.1% to 0.05% of the transaction amount, paid by the seller. On 12 April 2024 the Hong Kong, Shanghai and Shenzhen exchanges announced changes to northbound Stock Connect data, in two phases about one and four months later: real-time buy, sell and total turnover would no longer be available (daily and monthly totals and the ten most active stocks would be); the remaining daily quota would be shown only when below 30%; and northbound shareholdings would be published quarterly, on the fifth northbound trading day after the quarter’s end.
18.2 Retail-dominated markets
Most trading in mainland shares is done by individuals, and they are not one group. Jones, Shi, Zhang and Zhang split Chinese retail accounts by size: the smallest cannot predict returns, chase the day’s moves, fail to process public news and show gambling preferences; the largest predict returns correctly and trade against the day’s moves, though their costs absorb what they gain. The attention buying after limit-up days is the small accounts’ behaviour, and the large investors of Chen and co-authors are on the other side of it.
The week after a limit-up close is where the retail strategy lives. In the synthetic market the attention premium reverses by 2.81% from the next open to five days later. Harvesting it takes a short sale, and borrow in these markets can be scarce or, as in Korea’s seventeen months without short selling (Book 1, chapter 12), banned outright. In practice the trade is the other side: a holder sells into the attention at the open, and a book that would have bought on the continuation stays out.
18.3 Connect flows
Definition 18.3 (Northbound flow)
Northbound flow is the net buying of mainland shares by investors trading through Stock Connect from Hong Kong, by stock or in aggregate; southbound flow is the reverse, mainland investors buying Hong Kong shares.
Northbound investors are mostly institutions, and Bian, Chan, Han and Shi found that their net purchases predict the returns of connected Shanghai stocks. A strategy that follows them needs their flows by stock, and soon: information in a flow is used up quickly. The dated box records that the by-stock holdings, once published daily, are now quarterly. The chapter plants flows that know a little of each stock’s next five days (a correlation of 0.02 with the return) and trades a weekly long–short book on them, at 15 basis points a round trip.
| northbound holdings published | daily | quarterly, five days late |
|---|---|---|
| IC with the next five days’ return | 0.021 | 0.003 |
| Sharpe ratio after costs, weekly book | 2.04 | 0.26 |
With daily data the flow’s IC of 0.021 over a thousand names a week gives a Sharpe ratio of 2.0 after costs; with quarterly data five days late, the same flows are worth almost nothing. The small IC that remains (0.003, a standard error of 0.001) comes from the synthetic market’s persistent drifts, which make last quarter’s informed buying weakly informative about next week. The lesson is general: a signal made of someone else’s published trades is worth what the publication schedule leaves of it.
18.4 Strategy files
Strategy file 18.1 — Limit-hit continuation
Who pays you, and why. Buyers held back by the limit, and attention buyers who arrive the next morning.
Instruments and venues. Mainland A-shares at their daily limit; other markets with daily limits.
Signal. A limit-up close, preferably with a large backlog of unfilled buy orders and news behind it.
Sizing and execution. A buy order in the queue at the limit early, sold at the next open (the T+1 rule allows no sooner).
Costs. Stamp duty on the sale, commissions; the queue’s adverse selection, which is the main cost.
How it dies. Competition for queue priority; regulators’ attention to large buyers at the limit.
Horizon, capacity, infrastructure. Overnight; capacity limited by what the queue fills; order entry fast enough to be early in the queue.
Backtest honestly. Fills from the queue, not from closing prices; a close at the limit is not a price anyone could buy at.
Sources. Seasholes and Wu (2007): 1.16% a day to smart traders; Chen, Gao, He, Jiang and Xiong (2019).
Strategy file 18.2 — Retail-attention reversal
Who pays you, and why. Small retail accounts that buy attention-grabbing stocks after limit-up days.
Instruments and venues. Stocks after limit-up days; for a short, those that can be borrowed.
Signal. A limit-up close yesterday, the open’s gap, the retail share of trading.
Sizing and execution. Sell holdings or short at the open; hold the week.
Costs. Borrow, where available at all; stamp duty.
How it dies. Short-sale restrictions; less retail trading.
Horizon, capacity, infrastructure. A week; capacity limited by borrow.
Backtest honestly. Only stocks that could be borrowed on the day; the open’s price, not the previous close.
Sources. Seasholes and Wu (2007): mean reversion over the following week; Jones, Shi, Zhang and Zhang (2025).
Strategy file 18.3 — Northbound-flow signal
Who pays you, and why. Investors slower than the institutions trading through the Connect, who learn their information later.
Instruments and venues. Connect-eligible mainland shares.
Signal. Changes in northbound holdings by stock, or aggregate northbound flow.
Sizing and execution. A long–short book on the changes, rebalanced as often as the data allow.
Costs. Stamp duty and commissions on each rebalance.
How it dies. The data: by-stock holdings are now published quarterly.
Horizon, capacity, infrastructure. Days to weeks with daily data; the data’s schedule sets it.
Backtest honestly. Holdings as published on the day they were published, with the schedule in force at the time.
Sources. Bian, Chan, Han and Shi (2023); the dated box.
18.5 Tutorial: locked limit up
Goal. Print the synthetic market through daily price limits, follow every limit-up close, and measure what a buyer at the limit, a buyer in the queue and a seller a week later would have had. End state: the tables and the two figures.
The limit layer: open, close, locks, the magnet and the queue fills, day by day.
def apply_limits(R, cfg: LimitConfig | None = None, rng=None):
    cfg = cfg or LimitConfig()
    rng = rng or np.random.default_rng(18)
    R = np.asarray(R, float)
    T, N = R.shape
    ub, db = np.log1p(cfg.limit), np.log1p(-cfg.limit)
    out = {k: np.zeros((T, N)) for k in ("close", "open", "fair", "premium", "fill")}
    for k in ("up", "down", "pushed"):
        out[k] = np.zeros((T, N), bool)
    v = np.zeros(N)
    p = np.zeros(N)
    A = np.zeros(N)
    up_prev = np.zeros(N, bool)
    for t in range(T):
        live = ~np.isnan(R[t])
        new = live & np.isnan(R[t - 1]) if t > 0 else live
        v[new] = p[new] = A[new] = 0.0
        up_prev[new] = False
        A = cfg.decay * A + cfg.attention * up_prev
        out["open"][t] = p + np.clip(v + A - p, db, ub)
        v = v + np.log1p(np.maximum(cfg.scale * np.nan_to_num(R[t]), -0.95))
        move = v + A - p
        pushed = live & (move < ub) & (move >= ub - cfg.magnet) & (rng.random(N) < cfg.push)
        step = np.where(pushed, ub, np.clip(move, db, ub))
        up = live & (move >= ub) | pushed
        out["fill"][t] = np.where(pushed, 1.0, np.where(up, np.exp(-(move - ub) / cfg.fill_scale), 0.0))
        p = p + np.where(live, step, 0.0)
        out["close"][t], out["fair"][t], out["premium"][t] = p, v, A
        out["up"][t], out["down"][t], out["pushed"][t] = up, live & (move <= db), pushed
        up_prev = up
    return out
Listing 18.1. Printing a limit market from fair returns. code/firm/limitmkt/firm_limitmkt.py The events: every limit-up close with a week of listing after it, split into locks with a backlog and pushed locks.
def limit_ups(limit: float = 0.10, attention: float = 0.03, push: float = 0.5):
    """Limit-up closes with five more listed days: next-open, filled and week-after returns (simple)."""
    P, o = panel(), market(limit, attention, push)
    T = P.ret.shape[0]
    live = P.listed
    far = np.arange(T)[:, None] < np.asarray(P.end)[None, :] - 6          # not in a listing's last days
    ok = o["up"][:-6] & live[1:-5] & live[6:] & far[:-6]
    nxt = np.expm1(o["open"][1:-5] - o["close"][:-6])
    week = np.expm1(o["close"][6:] - o["open"][1:-5])
    fill, pushed = o["fill"][:-6], o["pushed"][:-6]
    out = {"freq": float(o["up"][live].mean()), "n": int(ok.sum()), "share_pushed": float(pushed[ok].mean())}
    for name, m in (("all", ok), ("real", ok & ~pushed), ("pushed", ok & pushed)):
        if not m.any():
            continue
        out[name] = {"open": float(nxt[m].mean()), "fill": float(fill[m].mean()),
                     "filled": float((fill[m] * nxt[m]).sum() / fill[m].sum()), "week": float(week[m].mean()),
                     "se": float(nxt[m].std() / math.sqrt(m.sum()))}
    return out
Listing 18.2. Limit-up closes and what follows them. code/strategies-1/18-asia-specific-equity-strategies/python/s1_asia.py - Run
limit_ups(limit)for the three widths and the two controls (attention=0,push=0),band(push),flows(1, 0)andflows(63, 5), andfig_asia.py.
What to change next. Give queue positions: early buyers fill first; make the attention premium depend on how many stocks lock the same day (Seasholes and Wu found fewer buyers when many do); add lower-limit locks and the sellers they trap.
18.6 Build: a limit market
Purpose. Prices of a daily-limit market from fair returns, with attention buying, a magnet and queue fills; a northbound-flow generator and its publication schedule.
Interface. LimitConfig(…), apply_limits(R, cfg, rng), northbound(alpha, skill, rng), holdings_seen(flow, every, lag).
Rules. No close beyond the limit from the previous close; the open carries yesterday’s backlog and today’s premium, within the limit; a listing starts at its fair value.
Acceptance tests. code/firm/limitmkt/tests/: a 15% move locks at 10% with the fill probability by hand and opens at the fair value plus the premium; the magnet pushes a 9% target; holdings published every four days two days late; the flows’ correlation.
Stretch. Queue priority; lower-limit locks; a T+1 constraint on intraday round trips in the backtester.
Sources and further reading
- T. Chen, Z. Gao, J. He, W. Jiang and W. Xiong, “Daily price limits and destructive market behavior”, Journal of Econometrics 208(1), 2019.
- D. D. Cho, J. Russell, G. C. Tiao and R. Tsay, “The magnet effect of price limits: evidence from high-frequency data on Taiwan Stock Exchange”, Journal of Empirical Finance 10(1–2), 2003.
- M. S. Seasholes and G. Wu, “Predictable behavior, profits, and attention”, Journal of Empirical Finance 14(5), 2007.
- C. M. Jones, D. Shi, X. Zhang and X. Zhang, “Retail trading and return predictability in China”, Journal of Financial and Quantitative Analysis 60(1), 2025 (online 2024).
- J. Bian, K. Chan, B. Han and D. Shi, “Cross-border equity flows and information transmission: evidence from Chinese stock markets”, Journal of International Financial Markets, Institutions and Money 84, 2023.
18.7 Exercises
Exercise 18.1 ★
News raises a stock’s value by 50%. How many days does it take to reach it under a 10% limit, and under a 20% limit?
Solution
Solution of Exercise 18.1.
, so five days under a 10% limit, four of them locked; , so three days under a 20% limit, two locked.
Exercise 18.2 ★
A stock’s value rises 15% in a day under a 10% limit. With the layer’s fill scale of 2%, what is the probability that a queued buy order fills?
Solution
Solution of Exercise 18.2.
The backlog is in log terms, so the fill probability is : about one order in nine fills.
Exercise 18.3 ★
The attention premium is 3% at the open after a limit-up close and decays by 0.6 a day. How much of it remains four days later, and how much has reverted?
Solution
Solution of Exercise 18.3.
remains, so , 2.6 points in log terms, has reverted. The simulation’s week-after figure, , adds the fair value’s own drift and noise.
Exercise 18.4 ★★
Why do the pushed locks have a fill probability of one and a small overnight gain?
Solution
Solution of Exercise 18.4.
A pushed lock closes above the stock’s value: sellers are glad to sell at the limit, so every queued order fills. The next open moves back toward the value, which takes back part of the attention premium: 1.67% against 5.90% for locks with a backlog.
Exercise 18.5 ★★
Why does the overnight gain grow with the width of the limit?
Solution
Solution of Exercise 18.5.
A wider limit is reached only by larger moves, and the part of a large move that the limit holds back is larger: the backlog behind each lock grows with the width. The attention premium is the same for all widths.
Exercise 18.6 ★★
At a 10% limit, 1.29% of stock-days are limit-up closes. How many does a market of 1 000 stocks produce a day, and what does the filled trade earn on each after a 15 basis point round trip?
Solution
Solution of Exercise 18.6.
a day. The filled trade earns on average, but only on the orders that fill, and those fill most in the weakest locks.
Exercise 18.7 ★★★
Coding. Run limit_ups(0.10, attention=0.0, push=0.0). What is left of the overnight gain, filled and unfilled, and of the week’s reversal? What does that tell you about where the trade’s return comes from?
Solution
Solution of Exercise 18.7.
Limit-up closes fall to 0.79% of stock-days; the next-open gain to 3.42% for every close and 1.21% after fills; the week’s reversal to . The backlog alone is worth about a point to a queued buyer; the rest of the trade, and nearly all the reversal, comes from the attention buyers.
Exercise 18.8 ★★★
Find the flaw. “Stocks that close limit up gain 4.5% by the next open on average; buying every limit-up close is a Sharpe ratio of ten.”
Solution
Solution of Exercise 18.8.
A close at the limit is a price at which almost nobody who wanted to buy could: the queue fills in the weakest locks and not in the strongest. Weighted by fills the gain is 2.64%, and the model’s clean attention makes even that an upper bound. A Sharpe ratio needs fills from the queue, costs and the capacity of the queue.
18.8 Problem: Locked Limit Up
Problem 18.1
Weekend problem — a day at the limit
The chapter’s synthetic limit market and the public record.
Part I — The rules.
- Define limit-hit continuation and the magnet effect.
- What do daily limits do to observed returns (Book 1, chapter 12)?
- What does the T+1 rule forbid, and what trade does it leave?
- Describe the chapter’s limit layer.
Part II — The record.
- What did Seasholes and Wu find after upper-limit events?
- What did Chen and co-authors find about large investors?
- What did Jones and co-authors find about retail accounts of different sizes?
- What did Bian and co-authors find about northbound flows?
Part III — The events.
- How often do limit-up closes happen at 5%, 10% and 20% limits?
- Give the overnight gain for every close and weighted by fills at a 10% limit.
- Why do fills cut the gain?
- What does the magnet do to the distribution of daily moves?
Part IV — The verdict.
- State the named result: the next-day return after a limit-up lock and how it changes with the limit’s width.
- Decompose the overnight gain into backlog and attention.
- Why is the retail-attention reversal hard to harvest in the mainland?
- What did the 2024 data change do to the northbound-flow signal?
- How would you backtest a limit-up strategy honestly?
- Which strategy file depends most on regulation?
- How does this chapter relate to chapter 9 on flows?
- In one sentence: what does a price limit sell, and to whom?
Solution
Solution of Problem 18.1.
- A locked stock’s further move in the same direction at the next open; prices accelerating toward a limit as they approach it.
- They cut the observed variance, make returns positively autocorrelated and put point masses at the limits.
- Selling shares the day they were bought; buying at the limit and selling the next day.
- Fair returns scaled by 1.5; closes within the limit; attention buying of 3% after limit-up closes, decaying by 0.6 a day; half the targets within 2% of the limit pushed to lock; queue fills falling with the backlog.
- Attention buying by individuals, a rise followed by reversal over the week, and 1.16% a day to smart traders who buy on the limit day and sell the next.
- They buy on limit-up days and sell the next; their limit-day buying predicts a stronger long-run reversal; their pushing explains the magnet effect.
- Small accounts cannot predict returns and chase the day’s moves; large accounts predict correctly and trade contrarian, but costs absorb it.
- Northbound net purchases predict the returns of connected Shanghai stocks.
- 11.24%, 1.29% and 0.10% of stock-days.
- 4.51% and 2.64%.
- The queue fills most when the lock is weakest and least when the backlog is largest.
- It moves days from the band 7.5%–9.5% to the limit: limit-up closes rise from 0.87% to 1.29% of stock-days.
- Named result. At the next open after a limit-up close, a buyer at every close gains 2.98%, 4.51% and 6.58% under 5%, 10% and 20% limits, a queued buyer weighted by fills 2.12%, 2.64% and 3.20%, and the price gives back 1.76%, 2.81% and 5.27% over the following week.
- At 10%, the backlog alone gives 3.42% (1.21% filled); attention adds most of the rest and takes it back over the week.
- It needs a short sale, and borrow may be scarce or banned.
- Quarterly holdings five days late leave an IC of 0.003 and a Sharpe ratio of 0.26, against 0.021 and 2.04 with daily data.
- Fills from the queue, the open as the exit, stamp duty and commissions, the limits in force at each date, and only borrowable stocks for shorts.
- The northbound-flow signal, whose data were cut by the exchanges.
- Both trade the price pressure of predictable demand; here the demand is attention buying and queued orders instead of funds’ flows.
- It sells time: it delays a move to the next day, and those who can queue early or sell into the next morning’s buyers collect for it.
18.9 Interview questions
Interview question 18.1 ★ researcher
Why is a momentum signal fitted on the closing prices of a market with daily limits suspect?
Solution
Solution of Interview question 18.1.
Closes at the limit are not the prices at which the stock would have traded: large moves are split over several days, so closes show continuation that nobody could buy at those prices. A momentum signal fitted on them finds a return it cannot trade.
Interview question 18.2 ★★ trader
A stock you want to buy is locked limit up with a large queue. What do you do?
Solution
Solution of Interview question 18.2.
Decide whether the backlog and news justify the queue: joining late means filling only if the lock breaks, which is when the trade is worst. Either queue early with a size the fills can bear, or wait for the next open and pay the gap.
Interview question 18.3 ★★ researcher
How would you detect the magnet effect in intraday data?
Solution
Solution of Interview question 18.3.
Compare the speed of price moves (or the hazard of reaching the next tick) as a function of the distance to the limit with that of the same stocks far from it, controlling for volatility; the magnet shows as acceleration near the limit, stronger at the upper one.
Interview question 18.4 ★★ developer
What changes in a backtester for a market with daily limits and the T+1 rule?
Solution
Solution of Interview question 18.4.
Fills at the limit only from the queue, with priority; no trades beyond the limits; no same-day sale of shares bought that day; limits by board and status as they were at each date; stamp duty on sales.
Interview question 18.5 ★★ risk
What are the risks of holding a book of mainland shares that may lock limit down?
Solution
Solution of Interview question 18.5.
A stock locked limit down cannot be sold for as many days as the fall needs; value-at-risk from daily returns understates it; a fund with daily redemptions may have to sell what it can, not what it should.
Interview question 18.6 ★★★ researcher
A stock’s value jumps by above a limit (in log terms). Buy orders queue at the limit and fill with probability for ; the next open reflects the full value. Derive the expected overnight gain of a filled order for exponentially distributed with mean , and compare it with the unconditional mean.
Solution
Solution of Interview question 18.6.
With exponential with mean , and , so the gain of a filled order is , below both and : fills select the small backlogs, and the unconditional mean overstates the gain.