Derivatives and Volatility · Derivatives
18Autocallables
In January 2024 the CSI 500 and CSI 1000 indices of mainland Chinese shares fell sharply. Structured notes known as snowballs, with knock-in levels between 70% and 80% of their starting points, were knocked in as the indices fell. The notes paid coupons of 10% to 20% a year for as long as the indices stayed within their range. Once knocked in, they turned into positions that lost with the index. The dealers who had issued them held hedges that changed abruptly at those levels. The same kind of product, the autocallable, is sold to retail investors in Korea and Japan. Korean investors held 19.3 trillion won of notes linked to the Hang Seng China Enterprises Index in November 2023, 10.2 trillion of them due in the first half of 2024; by 22 January 2024 those sold by five commercial banks had already lost 229.6 billion won, and the losses have been studied in their own right. This chapter takes the product apart. It covers the payoff and the model it needs, its risks for the issuer, the hedging flows it creates, and what those flows have done to the markets they hedge in.
18.1 Payoff anatomy
Definition 18.1 (Autocallable)
An autocallable is a note that redeems early, at par plus a coupon, on the first observation date on which the underlying is at or above a trigger level. If it is never called, it repays par at maturity, unless a protection barrier has been breached, in which case it repays par times the underlying’s performance.
Definition 18.2 (Autocall trigger)
The autocall trigger is the level, usually 100% of the initial fixing and sometimes stepping down over time, at or above which the note is redeemed early on an observation date.
Definition 18.3 (Coupon barrier)
The coupon barrier of a Phoenix autocallable is the level at or above which a periodic coupon is paid on an observation date, whether or not the note is called.
Definition 18.4 (Memory coupon)
A memory coupon is a Phoenix coupon that, if missed because the underlying was below the coupon barrier, is paid later on the first observation date on which the barrier is met again.
Definition 18.5 (Protection barrier)
The protection barrier (knock-in level) is the level below which the investor’s capital is no longer protected. It is observed at maturity only (European) or continuously or daily (American), and it is set well below the initial fixing: 60% in the chapter’s example, 70% to 80% in the Chinese snowballs of 2024.
Taken apart, an autocallable is a bond plus a set of options, and the investor is short most of them. The investor has sold a down-and-in put struck at the initial level (chapter 15’s knock-in): below the protection barrier the note loses with the underlying. The investor has bought a strip of digital options that pay the coupons, and sold the upside above par, because the note is called away when the underlying rises. The coupon is financed by the knock-in put premium and by the early call, which cuts the note’s life short in exactly the scenarios in which the investor would have liked to keep it.
Definition 18.6 (Snowball)
A snowball is an autocallable, common in China, whose coupon accrues at an annual rate and is paid in a lump when the note knocks out (autocalls) on a monthly observation, or at maturity if it neither knocked out nor knocked in; the knock-in is monitored daily, and after a knock-in the investor bears the underlying’s loss at maturity.
The chapter’s working example is a three-year Phoenix on the index of chapter 9’s surface. It is observed quarterly and callable from the first quarter at 100%. Its memory coupon is paid at or above 70%, and its protection barrier is observed at maturity at 60%. Rates are zero, so that the whole coupon is paid for by options.
Example 18.7 (Where the Phoenix goes)
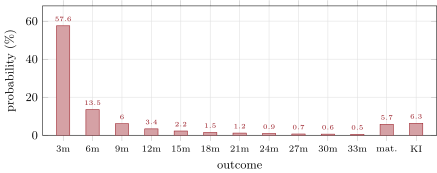
Under chapter 9’s local volatility, the note is called at the first observation with probability 57.6%, and within the first year with probability 80.5%. It reaches maturity unbroken with probability 5.7%, and knocked in with probability 6.3% (Figure 18.1). The fair quarterly coupon, the one that prices the note at par, is 1.55%, or 6.18% a year. Without coupons the note is worth 95.99, and each point of quarterly coupon adds 2.60.
18.2 Pricing: which model
The payoff depends on the path at a dozen dates and on the smile at every one of them. The coupons are digitals, so they are priced by the skew (chapter 15). The knock-in put is a barrier deep out of the money, priced by the downside of the smile at long expiries. And the early call is a string of forward digitals. A flat volatility gets all three wrong in the same direction.
Example 18.8 (Flat volatility against the smile)
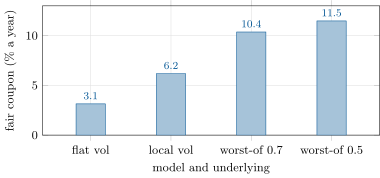
Priced at a flat 20.0%, the three-year at-the-money volatility, the Phoenix with the local-volatility fair coupon is worth 102.78 instead of 100. The fair coupon at flat volatility is 3.14% a year, half of the 6.18% under local volatility. The skew makes the knock-in put, which the investor has sold, more valuable, and the smile’s steeper short end lowers the probability of an early call. A desk that quoted with flat volatility would pay half the coupon it could afford. A competitor using the smile would take every trade.
Local volatility is the natural starting point: it fits every vanilla, and the note’s value depends mostly on terminal distributions at the observation dates. It is not the end point. The coupons and calls are forward digitals, whose price depends on the forward skew that local volatility flattens (chapter 16). The knock-in, monitored daily in many products, depends on the smile’s dynamics near the barrier. A careful desk prices with a local-stochastic volatility model (chapter 20), checks it against local volatility, and holds a reserve for the difference. It adds a jump or gap reserve for daily-monitored barriers (chapter 15). Multi-underlying notes add correlation, and the correlation skew of chapter 17.
18.3 The risk profile: vega, skew, dividends, correlation
Example 18.9 (The Phoenix’s sensitivities)
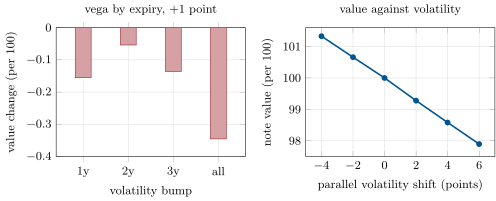
At the local-volatility fair coupon, a rise of one volatility point across the surface lowers the note’s value by 0.35 per 100. By expiry bucket, the change is at one year, at two years and at three (Figure 18.2). A steeper skew (SSVI correlation from to ) costs 0.24. A dividend yield of 1% a year, with the surface unchanged in forward moneyness, costs 0.20. Between four points down and six points up the value falls almost linearly, from 101.33 to 97.90.
The investor is short volatility, short skew and short dividends, and the issuer holds the opposite. The issuer is long vega, concentrated at the short end, where the first observations sit, and at maturity, where the knock-in put lives. It is long skew and long dividends: a cut in expected dividends raises the forward and lowers the value of the knock-in put it owns. None of these can be left open. The desk sells volatility and skew back to the market, in listed options and variance swaps, and it sells dividend exposure, in dividend futures and swaps (chapter 5). A market in which many issuers sell the same notes on the same indices therefore has a structural supplier of long-dated volatility and a structural seller of dividends. That supply should cheapen long-dated volatility and implied dividends. The chapter does not measure by how much.
Autocallables are written on single indices and on baskets. Worst-ofs on three or four shares pay higher coupons because the investor sells more: a worst-of knock-in put, whose value rises as correlation falls (chapter 17).
Example 18.10 (The same note on the worst of three)
Put the Phoenix on the worst of three underlyings, each with the index’s local volatility. The fair coupon is 11.5% a year at a correlation of 0.5 and 10.4% at 0.7. The knock-in probability is 18.1% and 14.6%. Twenty points of correlation are worth a point of annual coupon, and the issuer who sold them is short correlation: it gains if correlation rises.
18.4 Issuer hedging flows
The issuer hedges the note’s delta in the underlying, and the delta of an autocallable has two features that turn hedging into market flow.
The first is the direction of the flow. The note’s value to the investor rises with the underlying, so the issuer, short the note, holds a long position in the underlying. As the underlying falls towards the protection barrier, the note’s delta grows, because the knock-in put the issuer owns gains value quickly there, and the issuer buys. As it rises towards the trigger, the note’s delta shrinks, and the issuer sells. Away from the barrier, then, the issuer’s hedging buys dips and sells rallies, and it dampens volatility. This is the dealer-gamma effect of One Quant Book 1, chapter 26, and the reason issuers are long volatility: they own the gamma.
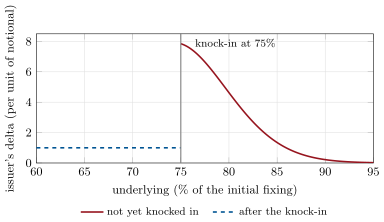
The second is the cliff at a daily-monitored barrier. Just above the knock-in level, the note is worth par plus its coupon if the level holds and much less if it breaks, so its delta is very large. At the knock-in the payoff becomes a plain long position in the underlying, with a delta of about one. The issuer must sell the difference, at once, into a falling market. Lim and Choi described this pattern for Korean equity-linked securities: the delta rises continually as the price approaches the knock-in level, and must be cut as soon as the level is touched.
Example 18.11 (The knock-in cliff)
A two-year snowball is observed monthly for knock-out at 103% from the third month, with a daily knock-in at 75% and a coupon of 15% a year. Under local volatility it is worth 100.44 (standard error 0.06), and its knock-in probability is 15.6%. One month before maturity, at 25% volatility, with the full 30% coupon due if the barrier holds and the spot 1% above the barrier, the issuer’s delta is 7.63 per unit of notional. A 1% fall knocks the note in, and the delta drops to 1.00. Per 100 million of notes the issuer sells 497 million of the underlying, measured at the barrier level. With three months left the figure is 254 million, and with a year left 97 million (Figure 18.4).
Fang’s reconstruction of the Chinese snowball episode puts the hedge released across the barrier region at about 0.6 times notional with twelve months to maturity and about 6 times with one month, the same order as the example. The size of the flow depends on three things that no single issuer controls: how much notional is outstanding, how concentrated the knock-in levels are, and how concentrated the maturities are. A dozen issuers selling similar notes in the same months, with barriers at the same round percentages, create one very large barrier.
18.5 Documented market impact
The structure of the risk is not in doubt. The evidence on its effect on markets is growing, and it should be read with its limits.
- The 2024 snowball knock-ins. Yin’s case study of the January 2024 “knock-in storm” lists concentrated product maturities and clustered knock-in levels among the causes, and institutional hedging pressure and market volatility among the effects. Fang finds that basis widening and trading activity in the CSI 500 and CSI 1000 futures, the indices most snowballs referenced, exceeded those in control index futures around the episode. He describes these as consistency results, not causal identification.
- Korean equity-linked securities. Korean studies of the issuer’s knock-in delta led to a policy suggestion: size issuance on the same underlying against its trading volume and the maximum delta the hedge can reach. Losses on notes linked to the Hang Seng China Enterprises Index are the subject of empirical pricing studies.
- Where the effect is small. Fang notes that the same monitoring framework, outstanding notional times barrier concentration times maturity concentration times dealer gamma, transfers to other markets, but the magnitude does not. Japanese retail notes are more often single-name, with barriers further out of the money.
For a desk the practical consequences are three. Know the market’s concentration of barriers as well as your own: the flow at a level is everyone’s. Price the cliff: a daily-monitored knock-in near maturity carries gap risk (chapter 15) and a liquidity cost the model does not see. And watch the investor’s side: the product that pays the highest coupon is the one in which the investor has sold the most, and the losses when the barrier breaks fall on the investor.
18.6 Tutorial: pricing and hedging an autocallable
Goal. Price a three-year Phoenix under local volatility, solve for its fair coupon, compute its vega by expiry bucket and its skew, dividend and correlation sensitivities, and measure the issuer’s hedge across a daily knock-in. End state: the four figures and the numbers of the weekend problem.
The term sheet as data:
@dataclass(frozen=True)
class TermSheet:
    obs_times: tuple[float, ...]            # observation dates (years); the last is maturity
    trigger: float = 1.0                    # autocall if the (worst) performance is at or above this
    coupon: float = 0.0                     # Phoenix coupon per period, per 100 of notional
    coupon_barrier: float = 0.7             # Phoenix coupon paid if the performance is at or above this
    memory: bool = True                     # missed Phoenix coupons are paid later when the barrier is met
    protection: float = 0.6                 # capital protected at maturity unless knocked in below this
    ki_daily: bool = False                  # knock-in monitored daily (True) or at maturity only (False)
    snowball_rate: float = 0.0              # annual coupon accrued to the autocall or maturity (snowball)
    first_call: int = 0                     # index of the first observation at which the note can autocall

    @property
    def maturity(self) -> float:
        return self.obs_times[-1]
Listing 18.1. The autocallable term sheet. code/firm/autocall/firm_autocall.py Cash flows path by path: coupons with memory, calls, and redemption at maturity with the knock-in:
def cashflows(ts: TermSheet, times: np.ndarray, perf: np.ndarray, r: float) -> dict:
    """Discounted value of the note per path (per 100) from simulated performances (n_paths, n_times, n_assets;
    worst-of when n_assets > 1), with the probability of each outcome."""
    worst = perf.min(axis=2)
    n = len(worst)
    idx = [int(np.argmin(np.abs(times - t))) for t in ts.obs_times]
    alive = np.ones(n, bool)
    pv = np.zeros(n)
    missed = np.zeros(n)
    called_at = np.full(n, -1)
    for j, (i, t) in enumerate(zip(idx, ts.obs_times, strict=True)):
        w = worst[:, i]
        df = math.exp(-r * t)
        if ts.coupon > 0:
            pay = alive & (w >= ts.coupon_barrier)
            amount = ts.coupon + (missed if ts.memory else 0.0)
            pv += np.where(pay, amount * df, 0.0)
            missed = np.where(alive & ~pay, missed + ts.coupon, np.where(pay, 0.0, missed))
        if j >= ts.first_call and j < len(idx) - 1:
            call = alive & (w >= ts.trigger)
            pv += np.where(call, (100.0 + 100.0 * ts.snowball_rate * t) * df, 0.0)
            called_at = np.where(call, j, called_at)
            alive &= ~call
    # maturity for the survivors
    wt = worst[:, idx[-1]]
    ki = (worst[:, : idx[-1] + 1].min(axis=1) < ts.protection) if ts.ki_daily else (wt < ts.protection)
    df = math.exp(-r * ts.maturity)
    redemption = np.where(ki, 100.0 * np.minimum(wt, 1.0), 100.0)
    if ts.snowball_rate > 0:
        ko = wt >= ts.trigger
        redemption = redemption + np.where(ko | ~ki, 100.0 * ts.snowball_rate * ts.maturity, 0.0)
    pv += np.where(alive, redemption * df, 0.0)
    return {"pv": pv, "called_at": called_at, "ki": alive & ki, "alive": alive}
Listing 18.2. Autocallable cash flows on simulated paths. code/firm/autocall/firm_autocall.py The hedge across the knock-in, from the note’s value just above the barrier and just after it:
def hedge_across_ki(ki: float, tau: float, vol: float, final_coupon: float, notional: float = 100e6,
                    above: float = 0.01, h: float = 1e-4) -> dict:
    """The issuer is short the note and hedges with delta units of the underlying. Spot `above` above the knock-in
    level with tau left: the delta before the knock-in, the delta after a fall of `above` knocks it in, and the
    underlying sold in between, per `notional` of notes (in currency at the knock-in level)."""
    s = ki * (1 + above)

    def delta(x, knocked):
        return (snowball_tail(x + h, ki, tau, vol, final_coupon, knocked)
                - snowball_tail(x - h, ki, tau, vol, final_coupon, knocked)) / (2 * h) / 100.0
    d_before = delta(s, False)
    d_after = delta(ki * (1 - 1e-6), True)
    sold = (d_before - d_after) * notional * ki
    return {"delta_before": d_before, "delta_after": d_after, "sold": sold, "spot": s}
Listing 18.3. The underlying sold at the knock-in. code/firm/autocall/firm_autocall.py - Run
dv_autocall.sensitivities(),worst_of(),snowball_price(),cliff()andfig_autocall.py. The fair coupon uses the fact that the price is linear in the coupon: two simulations with common random numbers solve for it.
What to change next. Make the protection barrier daily-monitored and recompute the fair coupon; add a step-down trigger (100%, 95%, 90% by year); price the Phoenix under the Heston model of chapter 10 and compare.
18.7 Build: the autocallable pricer
Purpose. The miniature firm’s structured-products pricer: term sheets as data, Monte Carlo pricing on any volatility function and any number of underlyings, fair-coupon solving, and the hedge analytics that the structured-products desk of chapter 19 and the exotic book of chapter 27 use.
Interface. TermSheet(obs_times, trigger, coupon, coupon_barrier, memory, protection, ki_daily, snowball_rate, first_call); simulate(sigma_fn, s0, t_end, r, q, n_paths, seed, steps_per_year, corr); cashflows(ts, times, perf, r); price(ts, sigma_fn, r, q, n_paths, seed, corr, n_assets) -> price, se, call_probs, ki_prob; snowball_tail; hedge_across_ki(ki, tau, vol, final_coupon, notional).
Rules. Greeks by bumping with common random numbers; the fair coupon from the price’s linearity in the coupon; a daily knock-in priced with daily paths or the barrier shift, never as continuous; every price reported with its standard error.
Acceptance tests. code/firm/autocall/tests/: without volatility the note is called at once; with a trigger never reached and no knock-in it pays par plus every coupon; daily monitoring knocks in more often than monitoring at maturity; a worst-of of perfectly correlated assets is the single-asset note; the snowball’s closed form near maturity matches a simulation; the cliff is largest near maturity.
Stretch. Step-down triggers and worst-of snowballs; local-stochastic volatility (chapter 20); pathwise and likelihood-ratio Greeks for the digital features (chapter 23).
Sources and further reading
- P. Guillaume, “Autocallable structured products”, Journal of Derivatives 22(3) (2015) 73–94.
- H. Lim and Y. Choi, “Knock-in and stocks market effect due to ELS issuance and hedging”, Journal of Derivatives and Quantitative Studies 23 (2015) 289–321.
- W. Fang, “China’s autocallable cycle: dealer hedging flows, market impact, and lessons for Japan’s structured-note market”, SSRN 7346463 (2026).
- Yin, “Case study on the knock-in storm of snowball products”, Journal of Global Economy, Business and Finance 8(3) (2026) 26–33.
- Kim, Park and Moon, “Markov regime-switching in pricing equity-linked securities: an empirical study for losses in HSCEI-linked products”, Finance Research Letters 76 (2025) 106929.
18.8 Exercises
Exercise 18.1 ★
List the options embedded in the chapter’s Phoenix and say, for each, whether the investor is long or short.
Solution
Solution of Exercise 18.1.
A zero-coupon bond repaying par (long); a European down-and-in put struck at 100% with barrier 60% (short); a strip of digital options paying the coupon when the index is at or above 70% on each date, with memory (long); the early-redemption feature, a strip of digitals at 100% that end the note (short, since the issuer chooses nothing but the investor loses the remaining coupons and the upside above par).
Exercise 18.2 ★
Why is the fair coupon under flat volatility lower than under local volatility?
Solution
Solution of Exercise 18.2.
The investor finances the coupon mainly by selling the knock-in put. Under the smile that put is priced at the high volatilities of low strikes, so it is worth more and pays for more coupon; the smile’s lower short-dated at-the-money volatilities also change the call probabilities. Flat volatility undervalues the put and so the coupon it can finance: 3.14% against 6.18% a year.
Exercise 18.3 ★
The price is linear in the coupon. Using the chapter’s numbers (95.99 without coupons, 2.60 per point), what quarterly coupon prices the note at 98, leaving the issuer two points of margin?
Solution
Solution of Exercise 18.3.
a quarter, 3.1% a year.
Exercise 18.4 ★★
Explain why an issuer of autocallables is long dividends, and what it does about it.
Solution
Solution of Exercise 18.4.
The issuer is long the knock-in put. Higher dividends lower the forward, which makes the put more valuable: the issuer gains, so it is long dividends (the chapter’s example: a 1% yield moves the note’s value by for the investor, for the issuer). It sells the exposure in dividend futures or swaps.
Exercise 18.5 ★★
Explain the direction of the issuer’s hedging flow as the underlying falls from 100% towards a daily knock-in, and at the knock-in.
Solution
Solution of Exercise 18.5.
The note’s delta to the investor grows as the underlying approaches the barrier, because the knock-in put gains value quickly there; the issuer, short the note, holds that delta in the underlying and buys as it falls (and sells as it rises). At the knock-in the note becomes a long position with a delta of about one, far below the delta just above the barrier, and the issuer sells the difference into the fall.
Exercise 18.6 ★★
Why does the cliff grow as maturity approaches?
Solution
Solution of Exercise 18.6.
Just above the barrier the note’s value falls from about par plus the coupon to the knocked-in value over a distance that shrinks like : the less time is left, the steeper the drop and the larger the delta before the knock-in. After it the delta is about one whatever the time left. The difference, the cliff, grows like : 97, 254 and 497 million for a year, three months and one month in the chapter’s example.
Exercise 18.7 ★★★
Coding. Make the Phoenix’s protection barrier daily-monitored and recompute the fair coupon under local volatility. Explain the change.
Solution
Solution of Exercise 18.7.
The fair coupon rises from 1.55% to 1.91% a quarter (7.62% a year), and the knock-in probability from 6.3% to 10.4%: a barrier monitored every day is breached by paths that recover before maturity, so the investor sells a more valuable put and is paid more for it.
Exercise 18.8 ★★★
Find the flaw. “Our autocallable book is delta-hedged and vega-hedged, so a fall through the knock-in level of our notes is a non-event for the desk.”
Solution
Solution of Exercise 18.8.
The hedges are local: at a daily knock-in the delta jumps and the desk must sell at once, into a falling market, alongside every other issuer with notes at the same level; a gap through the level leaves the sale at a worse price (chapter 15). The vega and skew of the book change abruptly too. The event needs a gap reserve, limits on concentration at barrier levels, and pre-positioning.
18.9 Problem: The Knock-in Cliff
Problem 18.1
Weekend problem — how much the issuer sells at the barrier
An issuer has sold snowballs on an index: monthly knock-out at 103% from the third month, daily knock-in at 75%, 15% a year, two years, 100 million of notional.
Part I — The product.
- Price the snowball under chapter 9’s local volatility and give its knock-in probability.
- Which options has the investor sold?
- What does the investor receive in each of the three outcomes (knock-out, neither, knock-in)?
- Why is the knock-in monitored daily a harder risk than one observed at maturity?
- Compare with the chapter’s Phoenix: which pays more, and why?
Part II — The issuer’s delta.
- One month before maturity, at 25% volatility, spot 1% above the barrier, give the issuer’s delta per unit of notional.
- Give the delta after a 1% fall knocks the note in.
- How much of the underlying does the issuer sell, per 100 million of notes?
- Give the same with three months and with a year left.
- What did the issuer do as the spot fell from 100% to 76%?
Part III — The market.
- If ten issuers hold similar notes with the same barrier, what does the market see?
- What order of magnitude does Fang report for the hedge released across the barrier region?
- Why are futures on the index where the flow shows first?
- What policy did Lim and Choi suggest?
- Which data would a regulator need to monitor this risk?
Part IV — Judgement.
- How would you price the cliff’s liquidity cost into the note?
- How would you hedge ahead of the barrier to reduce the sale at the knock-in?
- Who bears the loss when the barrier breaks?
- State the named result: the quantity of underlying the issuer sells per 1% fall when spot is 1% above the protection barrier one month before maturity, per 100 million of notes.
- In one sentence: what makes a knock-in barrier a market event rather than a single trade’s event?
Solution
Solution of Problem 18.1.
1. 100.44 (standard error 0.06); knock-in probability 15.6%. 2. A daily down-and-in put struck at 100% with barrier 75%, and the upside, called away at 103%; they finance the accruing coupon. 3. Knock-out: par plus 15% a year to the knock-out date. Neither: par plus 30% at maturity. Knock-in without a later knock-out: par times the final performance, capped at par. 4. It can be breached by a path that recovers before maturity, and it is monitored every day, including the days of sharp falls and gaps. 5. The snowball, 15% against 6.18% a year: its knock-in is higher (75% against 60%) and monitored daily, so the investor sells a much more valuable put. 6. 7.63. 7. 1.00. 8. million million. 9. 254 million and 97 million. 10. Bought the underlying, more and more as the delta grew, from about one at 100% to 7.6 near the barrier. 11. One barrier ten times as large: a sale of the order of five billion concentrated at one level. 12. About 0.6 times notional with twelve months left and about 6 times with one month. 13. They are the cheapest and fastest hedge for an index, and the flow is executed there first; basis and activity show it. 14. Limit issuance on the same underlying in view of its trading volume and the maximum delta the hedge can reach. 15. Outstanding notional by underlying, the distribution of knock-in levels and of maturities, and the issuers’ dealer gamma. 16. A reserve for the gap and the market impact of the sale: size the sale, estimate its cost from depth and impact models (Book 8), and charge it, weighted by the probability of reaching the barrier near maturity. 17. Reduce the delta ahead of the barrier (under-hedge the last points), buy put spreads around the barrier, or pre-sell part of the knock-in delta in a controlled way. 18. The investor, whose note now loses with the index; the issuer’s P&L depends on how well the sale was executed. 19. 497 million of the underlying (at the barrier level) per 100 million of notes: the delta falls from 7.63 to 1.00. 20. Many issuers hedge notes with the same barrier and maturities, so the hedge sale at the level is the whole market’s.
18.10 Interview questions
Interview question 18.1 ★ trader, bank
Decompose an autocallable into options. Why can it pay a high coupon?
Solution
Solution of Interview question 18.1.
A bond plus: short a knock-in put (the capital at risk), long coupon digitals (with memory in a Phoenix), short the upside through the early call. The coupon is financed by the put premium and by the call cutting the note short in good scenarios.
What the interviewer is looking for: the decomposition and who is short what.
Interview question 18.2 ★★ researcher
Which model would you price an autocallable with, and what does a flat volatility get wrong?
Solution
Solution of Interview question 18.2.
Start with local volatility, which fits the vanillas that price the terminal distributions; check with a local-stochastic model for the forward-skew-dependent coupons and calls; reserve for the difference. Flat volatility underprices the knock-in put and mispricing the digitals: it roughly halves the fair coupon in the chapter’s example.
What the interviewer is looking for: local volatility, its limits, and the direction of the flat-volatility error.
Interview question 18.3 ★★ trader
What is an autocallable issuer’s vega, skew and dividend exposure, and how is it recycled?
Solution
Solution of Interview question 18.3.
Long vega (short end and maturity), long skew, long dividends, and for worst-ofs short correlation. The issuer sells volatility (options, variance swaps), skew (risk reversals) and dividends (futures, swaps) to the market, and holds correlation or offsets it with index against single-stock options.
What the interviewer is looking for: the four exposures and the recycling instruments.
Interview question 18.4 ★★ developer
Your Monte Carlo Greeks for an autocallable are noisy. What do you do?
Solution
Solution of Interview question 18.4.
Use common random numbers for the bumped prices; many paths; smooth the digital features (replace the digital by a narrow call spread, as an overhedge would) or use pathwise and likelihood-ratio estimators (chapter 23); bucket the Greeks rather than bump each node; check stability across seeds.
What the interviewer is looking for: common random numbers and a treatment of the discontinuities.
Interview question 18.5 ★★ risk
How would you measure the market-wide hedging flow that a cluster of knock-in barriers can create?
Solution
Solution of Interview question 18.5.
Aggregate outstanding notional by underlying, knock-in level and maturity; for each level compute the change in the issuers’ delta when it is crossed (the cliff) as a function of time to maturity; compare with the underlying’s and futures’ daily volume and depth.
What the interviewer is looking for: notional times barrier and maturity concentration times dealer gamma.
Interview question 18.6 ★★★ trader, risk
The index is 2% above a level where a large share of the market’s notes knock in, one month before many of them mature. What do you do?
Solution
Solution of Interview question 18.6.
Estimate the market’s sale at the level; reduce my own delta ahead of it and buy protection (puts or put spreads below the level); widen quotes for new notes; prepare to provide liquidity after the level breaks if the sale overshoots; tell risk management and size the gap reserve.
What the interviewer is looking for: anticipating the flow, protection, and liquidity after the break.