University Biology — Year 2 · Bachelor Year 2
24Phylogenetic Trees and the Molecular Clock
In 1965 two chemists, Emile Zuckerkandl and Linus Pauling, compared the amino-acid sequences of haemoglobin from a handful of vertebrates and noticed something no anatomist could have seen: the number of differences between two species was proportional to the time since their ancestors had parted, as read from fossils. A molecule kept time. Within a decade Carl Woese had used one gene, the RNA of the small ribosomal subunit, to draw the tree of all life and to find in it a third domain, the archaea, that no microscope had distinguished from bacteria. This chapter is about reconstructing history from resemblance: what a tree means, how one is built from characters and from distances, how sequences are made to tell time, and the traps — convergence, unequal rates, saturation, long branches — that a reader of trees must know.
24.1 Reading a tree
Definition 24.1 (Phylogeny, clade, homology)
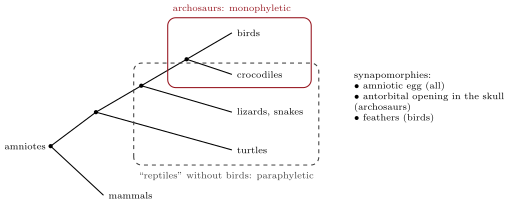
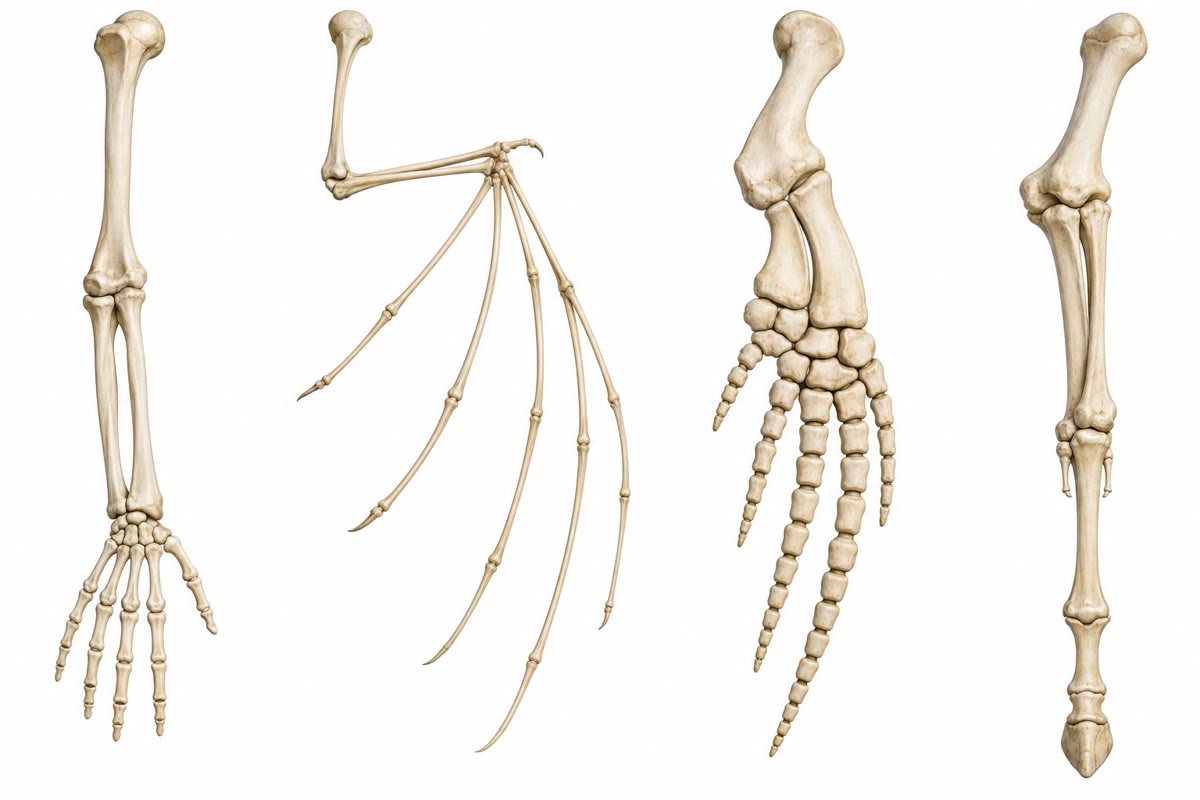
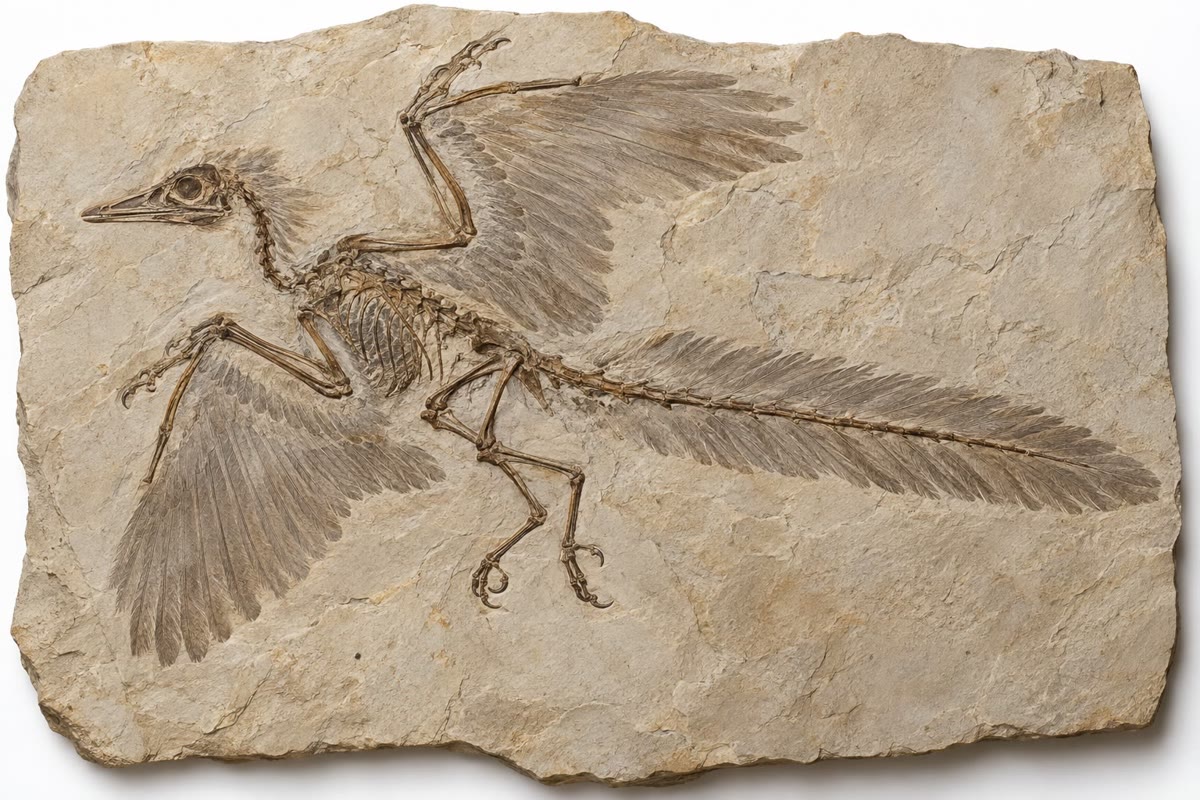
A phylogeny is a tree whose tips are the species (or genes, or individuals) compared, whose internal nodes are their common ancestors, and whose root is the oldest ancestor of all. Its branching order alone carries the history: nodes may be rotated freely, and only the nesting matters. A clade or monophyletic group is an ancestor with all its descendants (birds; mammals; birds and crocodiles together); a paraphyletic group is an ancestor with some descendants left out (“reptiles” without birds, “fish” without tetrapods, “prokaryotes”); a polyphyletic group joins descendants of different ancestors by a resemblance they evolved separately (“warm-blooded animals”). A character shared by two species because their ancestor had it is a homology (the bones of the bat’s wing and the whale’s flipper); one they evolved independently is an analogy or homoplasy (the wings of bats and of birds as wings, the camera eyes of vertebrates and octopuses). Only homologies record history, and among them only the derived states shared by a group — its synapomorphies, Hennig’s word — define a clade: feathers define birds, the ancestral state “no feathers” defines nothing.
24.2 Building trees from characters
Method 24.2 (Parsimony)
Score the characters (morphological states or aligned sequence positions) for every taxon. For each possible tree, count the minimum number of character changes needed to explain the data on it; the most parsimonious tree needs fewest. Root the tree with an outgroup, a taxon known to lie outside the group studied. Since the number of unrooted trees for taxa is — three for four taxa, for ten, for twenty — the search is exhaustive only for small sets and heuristic beyond. Confidence is measured by the bootstrap: resample the characters with replacement a thousand times, rebuild the tree each time, and record how often each clade recurs; a clade found in of the resamples is well supported, one found in half is not.
Example 24.3 (Four taxa, five sites)
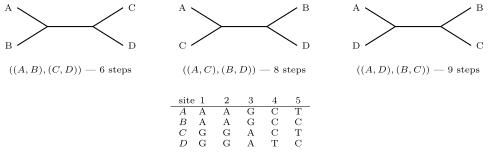
Sequences , , , . On the tree , sites 1, 2 and 3 each change once (on the internal branch), site 4 once ( in ) and site 5 twice ( in and in ): six steps. On , sites 1–3 each need two changes, sites 4 and 5 one each: eight. On : nine. The first tree is most parsimonious, by two steps; the three sites that support it are its synapomorphies, and site 5 is a homoplasy on it — the same change occurring twice, a fact of life in every real data set.
24.3 Building trees from distances
Method 24.4 (Clustering by distance: UPGMA)
From the pairwise distances between taxa (differences per site, corrected as below), join the closest pair into a cluster placed at a node of height half their distance; replace the pair by the cluster, whose distance to every other taxon is the average of its members’ distances; repeat until one cluster remains. The result is a rooted tree with all tips at the same height — it assumes a constant rate of change on every branch, a molecular clock. When rates differ between lineages, the method groups fast-evolving lineages together whatever their history; neighbour joining, which at each step joins the pair whose union shortens the whole tree most, does not assume a clock and is the standard fast method for large data sets.
Example 24.5 (UPGMA)
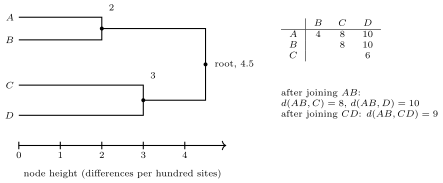
Distances (in differences per hundred sites): , , , , , . Join and at height 2; then , , : join and at height 3; finally : join the two clusters at height . The tree is , and if the rate is substitutions per site per year the root is million years old.
24.4 The molecular clock
Theorem 24.6 (Substitutions as a Poisson process, and the correction for multiple hits)
If substitutions at a site occur at a constant rate per year, independently across sites, the number that accumulate along a lineage in time is Poisson with mean , and the expected number separating two lineages that diverged years ago is
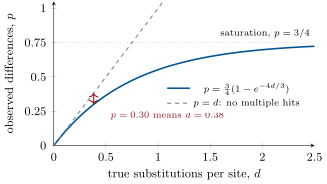
substitutions per site — the molecular clock. The observed proportion of sites that differ is smaller than , because a site hit twice may return to its original base or match by chance; with four bases changing at equal rates,
the Jukes–Cantor correction. As grows, saturates at — two random sequences agree at a quarter of their sites — and beyond the correction magnifies every sampling error: a gene that has changed that much has stopped keeping time. Slow genes (ribosomal RNA, histones) date the deep branches, fast ones (mitochondrial DNA, introns) the recent.
Proof. Let be the probability that a site still carries its original base after time . It is lost at rate and regained, from any of the three other bases, at rate : , whose solution with is . Two lineages separated by total time — by symmetry, the same as one lineage evolving for — agree at a site with probability where , so ; inverting gives the correction. The Poisson count follows from constant, independent events, as in the physics of radioactive decay, and its standard deviation sets the precision of any date: a gene of sites with observed substitutions dates a divergence to a relative precision of about . ∎
Evidence. Zuckerkandl and Pauling (1965) found the differences between the haemoglobins of horse, human, cow and others proportional to the fossil ages of their splits, and proposed the clock. Fitch and Margoliash (1967) built a tree of twenty species from cytochrome alone and recovered, from a single protein, the classical groupings of vertebrates, insects and fungi. The decisive test of method was Hillis and colleagues’ experimental phylogeny (1992): they propagated bacteriophage T7 through a known, branching series of eight lineages under a mutagen, sequenced the products, and gave the sequences to the tree-building methods blind — parsimony, distance and likelihood methods all recovered the true tree, and parsimony reconstructed the ancestral sequences with over accuracy. ∎
Proposition 24.7 (Pitfalls of the clock and of trees)
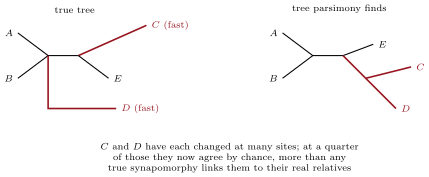
The clock is only approximately constant: rates differ between genes by a hundredfold (with function — histone H4 has changed two residues in a billion years, fibrinopeptides change every few million), between sites within a gene (third codon positions, introns and loops change fastest), and between lineages (rodents tick faster than primates, with their shorter generations and higher metabolic rates). Every clock therefore needs calibration by a fossil or a dated geological event, and dates carry the Poisson error above and the calibration’s own. Trees have their own traps. Long-branch attraction: two lineages that have each changed a great deal share many sites by chance, and parsimony joins them whatever their history — the cure is denser sampling to break the branches and a method that models the rates. Convergence produces false synapomorphies. Incomplete lineage sorting: a gene’s tree need not be the species’ tree when speciations follow one another quickly, because the ancestral polymorphism sorts differently into each descendant — so a species tree is built from many genes, not one. And in prokaryotes, where genes move sideways (Chapter 3), different genes tell different stories and the history is a web with a tree of ribosomal genes running through it. Modern practice replaces parsimony and distance by likelihood: given a model of substitution (the rates of each change, their variation among sites), compute the probability of the observed sequences on each tree with its branch lengths, and choose the tree that makes the data most probable; its Bayesian form yields a probability for each clade directly. The Year 3 volume gives the methods; here it is enough to know that every tree is a hypothesis with a measured support, not a fact.
Evidence. Woese and Fox (1977) compared small-subunit ribosomal RNA across prokaryotes and found the methanogens as distant from the bacteria as either is from eukaryotes: the three domains, confirmed by every gene of the transcription and translation machinery since, and invisible to morphology. The same ribosomal trees, read naively, placed the fast-evolving microsporidia at the base of the eukaryotes; genes with slower rates, and models allowing for rate variation, moved them to the fungi, where they belong — a textbook case of long-branch attraction detected and cured. ∎
Example 24.8 (Dating with a fossil)
A gene of sites differs at of them between cow and whale, whose common ancestor the fossils put at 60 million years. Corrected, ; the rate is per site per year. The same gene differs at between whale and hippo: , million years, with about from the Poisson count of 62 substitutions and a further uncertainty from the fossil date. The molecular result that whales are the hippos’ closest living relatives, obtained this way in the 1990s against every anatomical tree, was confirmed by the discovery of early whales with the hippo-like ankle bone predicted — the clock does not only date; it predicts what the rocks should hold.
24.5 Exercises
Exercise 24.1 ★
Define homology, analogy and synapomorphy, with one example of each among vertebrate limbs, wings and eyes.
Solution
Solution of Exercise 24.1.
Homology: a character inherited from a common ancestor — the humerus, radius and ulna of a bat’s wing and a whale’s flipper. Analogy: a similar character evolved independently — the wings of bats and birds as flight surfaces (the bones are homologous as forelimbs, the wing as such is not), or the camera eye of the octopus and the vertebrate. Synapomorphy: a derived homology shared by a clade and defining it — feathers for birds, the amniotic egg for amniotes.
Exercise 24.2 ★
Classify as monophyletic, paraphyletic or polyphyletic: birds; reptiles (without birds); fish (without tetrapods); flying vertebrates; mammals; prokaryotes.
Solution
Solution of Exercise 24.2.
Birds: monophyletic. Reptiles without birds: paraphyletic. Fish without tetrapods: paraphyletic (lungfish are closer to us than to trout). Flying vertebrates (bats, birds, pterosaurs): polyphyletic. Mammals: monophyletic. Prokaryotes: paraphyletic (bacteria and archaea, with the eukaryotes left out — and archaea closer to eukaryotes than to bacteria).
Exercise 24.3 ★
On the tree , name the sister group of birds, the sister group of mammals, and the smallest clade containing lizards and birds. Does swapping the positions of crocodiles and birds change the tree?
Solution
Solution of Exercise 24.3.
Sister of birds: crocodiles. Sister of mammals: all the other amniotes (turtles, lizards, crocodiles, birds together). Smallest clade containing lizards and birds: (lizards,(crocodiles, birds)), the diapsids without turtles on this tree. Swapping crocodiles and birds at their node changes nothing: a node can be rotated freely.
Exercise 24.4 ★
How many unrooted trees are there for 4, 6 and 10 taxa? How many rooted trees for 4 (each unrooted tree can be rooted on any of its branches)?
Solution
Solution of Exercise 24.4.
Unrooted: ; ; . Rooted trees for 4 taxa: each of the 3 unrooted trees has 5 branches, giving 15.
Exercise 24.5 ★★
Sequences , , , . Count the steps on each of the three unrooted trees and give the most parsimonious one. Which sites are homoplastic on it?
Solution
Solution of Exercise 24.5.
: sites 1, 2, 3 one step each, site 4 two steps ( and on both sides), site 5 one: 6 steps. : . : . The first tree is most parsimonious; on it site 4 is homoplastic (the change, or its reverse, occurs twice).
Exercise 24.6 ★★
Distances (per hundred sites): , , , , , . Build the UPGMA tree with its node heights.
Solution
Solution of Exercise 24.6.
Join and at height 3. Then , , : join and at height 5. Then : root at height . Tree .
Exercise 24.7 ★★
Correct , and for multiple hits. Why is the third value nearly useless?
Solution
Solution of Exercise 24.7.
: , , . At the argument of the logarithm is and the slope : a sampling error of in becomes in , and the assumption of equal rates at every site, false in every real gene, adds a bias of the same size. The gene is saturated.
Exercise 24.8 ★★
A gene evolves at substitutions per site per year. Two species differ by : when did they split? What would you observe between two species that split 500 million years ago, and what does that imply for dating deep splits with this gene?
Solution
Solution of Exercise 24.8.
million years. At 500 million years, and : three quarters of the way to saturation, where the correction is steep and the date unreliable — a slower gene is needed for such splits.
Exercise 24.9 ★★
A clade appears in of bootstrap resamples; another in . Interpret both. What would you do about the first?
Solution
Solution of Exercise 24.9.
: the clade is recovered in barely half the resamples; the data are nearly silent on it, and the alternatives together are as likely. : the signal is consistent across the sites; the clade is strongly supported (given the model and the alignment — systematic errors such as long-branch attraction are not detected by the bootstrap). For the first, add sequence (more genes), add taxa that break the branches, and check a different method.
Exercise 24.10 ★★★
Explain long-branch attraction with the quarter-by-chance argument and say why adding taxa that break the long branches helps.
Solution
Solution of Exercise 24.10.
Two lineages that have each changed at a large fraction of sites have, at any site where both changed, a one-in-four chance of landing on the same base (with four bases at equal rates). If each has changed at of sites, they have both changed at and agree by chance at of all sites — which can exceed the fraction of sites carrying the true synapomorphies that link each to its real, slowly-evolving relatives. Parsimony counts matches without asking why they occur and joins the two. Adding taxa that branch off along each long branch divides it into shorter segments, so that the chance matches are distributed among several shorter branches and the true synapomorphies of each segment become visible; a likelihood model that expects many chance matches on long branches corrects for them directly.
Exercise 24.11 ★★★
Human and chimpanzee mitochondrial DNA differ at of sites; the mitochondrial rate is about per site per year. Date the split, give the Poisson uncertainty for a -site genome, and name two reasons why the answer might still be wrong by a factor of two.
Solution
Solution of Exercise 24.11.
; million years. Substitutions: , relative precision : a statistical error of million years. But the rate is calibrated on other splits and may be wrong by a factor of two for this lineage (rate variation between lineages, and the difference between the pedigree rate measured over generations and the rate measured over millions of years); and the gene’s divergence predates the species’ divergence, since the ancestral population was polymorphic — so the true split is more recent than the gene’s, by a time that depends on the ancestral population size. (The accepted date, from many nuclear genes and fossils, is 6 to 7 million years: the mitochondrial clock here is too fast.)
Exercise 24.12 ★★★
“A gene tree is not a species tree.” Discuss with incomplete lineage sorting, horizontal transfer and gene duplication, and say how a species tree is nonetheless obtained.
Solution
Solution of Exercise 24.12.
Incomplete lineage sorting: when two speciations are close in time, an ancestral polymorphism may sort so that a gene’s tree groups species differently from the species tree; horizontal transfer: a gene received from another lineage carries that lineage’s history; gene duplication: comparing a paralogue in one species with the orthologue in another gives the duplication’s date, not the speciation’s. A species tree is obtained by using many genes from across the genome and taking the tree the majority support (or a model that expects a known fraction of discordant genes), by choosing orthologues carefully, and by preferring, in prokaryotes, the ribosomal and informational genes that are seldom transferred.
24.6 Problem: Dating the Whales
Problem 24.1
Weekend problem — whale, hippo, cow, pig and camel sequenced for one gene: the tree built by parsimony and by distance, the clock calibrated on a fossil, every split dated with its Poisson error, and the anatomical tree confronted with the molecular one, ending on the whale–hippo divergence time and the gene’s substitution rate
A gene of sites is sequenced in whale (), hippo (), cow (), pig () and camel (, the outgroup). Observed proportions of differing sites: ; ; ; every distance to is . Fossils put the split between cow and the whale–hippo line at 60 million years. Six informative sites, with the camel’s state given last:
| site | 1 | 2 | 3 | 4 | 5 | 6 |
|---|---|---|---|---|---|---|
| A | G | T | C | A | G | |
| A | G | T | C | G | G | |
| G | A | T | T | G | G | |
| G | A | C | T | G | A | |
| G | A | C | T | G | A |
Part I — Parsimony.
- Which sites are synapomorphies of ? Of ? Which site is uninformative, and which is a homoplasy or autapomorphy?
- Count the steps of the six sites on the tree .
- Count them on the anatomists’ tree , which puts hippo with cow among the even-toed ungulates and whales outside.
- Which tree is preferred, and by how many steps? Why is that margin weak, and what would strengthen it?
- The bootstrap gives the clade in of resamples of the whole gene. Interpret.
- Why is the camel used as the outgroup, and what would go wrong if a fish were used instead?
Part II — Distances.
- Correct the four distinct values (, , , ) for multiple hits.
- Run UPGMA on the five taxa with the corrected distances and give the node heights.
- Does the distance tree agree with the parsimony tree?
- Explain why UPGMA would fail if the whale lineage had evolved twice as fast as the others.
- Compute the number of substitutions the gene has accumulated between whale and hippo, and its Poisson standard deviation.
- Give the relative precision of a date based on that count.
Part III — The clock.
- Calibrate: from the cow–(whale, hippo) distance and the 60-million-year fossil, compute the rate per site per year.
- Date the whale–hippo split.
- Date the pig split and the camel split.
- Give the whale–hippo date with its Poisson uncertainty.
- The fossil calibration is itself uncertain by million years. Propagate it to the whale–hippo date.
- A different, faster gene gives between whale and camel. Correct it and comment on its reliability for this split.
Part IV — Confrontation.
- The anatomists’ tree rests on the double-pulley ankle bone shared by cow, pig, hippo and camel but not by living whales, which have no hind limbs. Explain why a lost character cannot count against the whale–hippo clade.
- Fossil whales with hind limbs were found in 2001; their ankle bone has the double pulley. What does that do to the argument?
- If whales are inside the even-toed ungulates, is the group “even-toed ungulates without whales” monophyletic, paraphyletic or polyphyletic?
- A second gene gives the tree . Name two reasons a gene tree may differ from the species tree, and say how to decide.
- The mitochondrial genome of whale and hippo differs at of sites. Correct it, and estimate the mitochondrial rate from the date found in question 14.
- Why is that rate so much higher than the nuclear gene’s?
- State the result: the tree, the nuclear rate , and the whale–hippo divergence time with its uncertainty.
Solution
Solution of Problem 24.1.
1. Sites 1, 2 and 4 (states shared by and alone, derived relative to the camel): synapomorphies of . Sites 3 and 6: synapomorphies of . Site 5 is an autapomorphy of , a change in one lineage that groups nothing; no site is homoplastic on the molecular tree. 2. One change per site: 6 steps. 3. Sites 1, 2 and 4 now need two changes each, sites 3, 5 and 6 one: 9 steps. 4. The whale–hippo tree, by three steps. Three sites out of a thousand is a small margin that a few homoplasies could overturn; strengthening it means more genes, more taxa (other ruminants, peccaries, the deer), and a bootstrap. 5. The clade recurs in five resamples out of six: moderate support, well above chance but short of the conventionally called strong. 6. The outgroup must lie outside the group but close enough that its sequence is still alignable and unsaturated; the camel is an even-toed ungulate outside the cow–pig–hippo–whale group. A fish would differ at nearly saturated levels, its states would be uninformative about which state is ancestral within the mammals, and its long branch would attract the fastest-evolving ingroup lineage. 7. , , , . 8. Join and at height . Then , , , everything to : join and at . Then : join at . Finally join at . Tree . 9. Yes: the same tree, the same nesting. 10. A whale that had changed twice as fast would be farther from everything, hippo included; UPGMA, which places each tip at height zero and joins the closest pair, would join hippo with cow first and leave the whale outside — exactly the anatomists’ tree, for the wrong reason. 11. substitutions; Poisson standard deviation . 12. . 13. per site per year. 14. million years. 15. Pig: million years; camel: million years. 16. million years (). 17. The rate scales as and the date as : , so million years — combined with the Poisson error, about million years. 18. : the gene has changed at two thirds of its sites in effect, the correction has multiplied by and its slope is ; it is near saturation for this split and its date is worth little. 19. Absence of a character is not a shared derived state: whales lost the hind limb and its ankle entirely, so nothing can be said about which ankle they would have had. A synapomorphy is evidence of a clade; its loss in one lineage is not evidence against membership. 20. The fossil whales have the double-pulley ankle: whales descend from an ancestor that had it, which places them inside the even-toed ungulates. The molecular prediction is confirmed by the rocks. 21. Paraphyletic: an ancestor with all its descendants except the whale line. 22. Incomplete lineage sorting of an ancestral polymorphism across two rapid speciations (cow, hippo and whale split within a few million years), or comparison of paralogues. Decide by sequencing many genes and taking the tree that most of them, and the concatenation, support; check for duplication in each family. 23. ; per site per year, five times the nuclear gene. 24. Mitochondrial DNA is replicated by a polymerase with weaker proofreading, exposed to the oxygen radicals of the respiratory chain, and not repaired by the nuclear machinery; it also lacks recombination, so damage accumulates. 25. Tree : whales are the hippos’ sister group; per site per year; whale–hippo divergence million years.