University Biology — Year 2 · Bachelor Year 2
17The Heart and the Cardiac Cycle
Cut out a frog’s heart and drop it into salt solution, and it goes on beating for hours — no nerves, no brain, no blood, just a muscle that contracts on its own about once a second because a small patch of its cells cannot stay still. A human heart does this some three billion times in a life, moving on the order of two hundred million litres, without ever being switched off. This chapter is about that pump: its chambers and valves, the cycle of filling and emptying and the pressures that drive it, the electrical system that times it and the trace it leaves on the skin, the law that lets it match its output to its inflow beat by beat, and the nerves and hormones that adjust its pace and force.
17.1 The pump
Definition 17.1 (Chambers and valves)
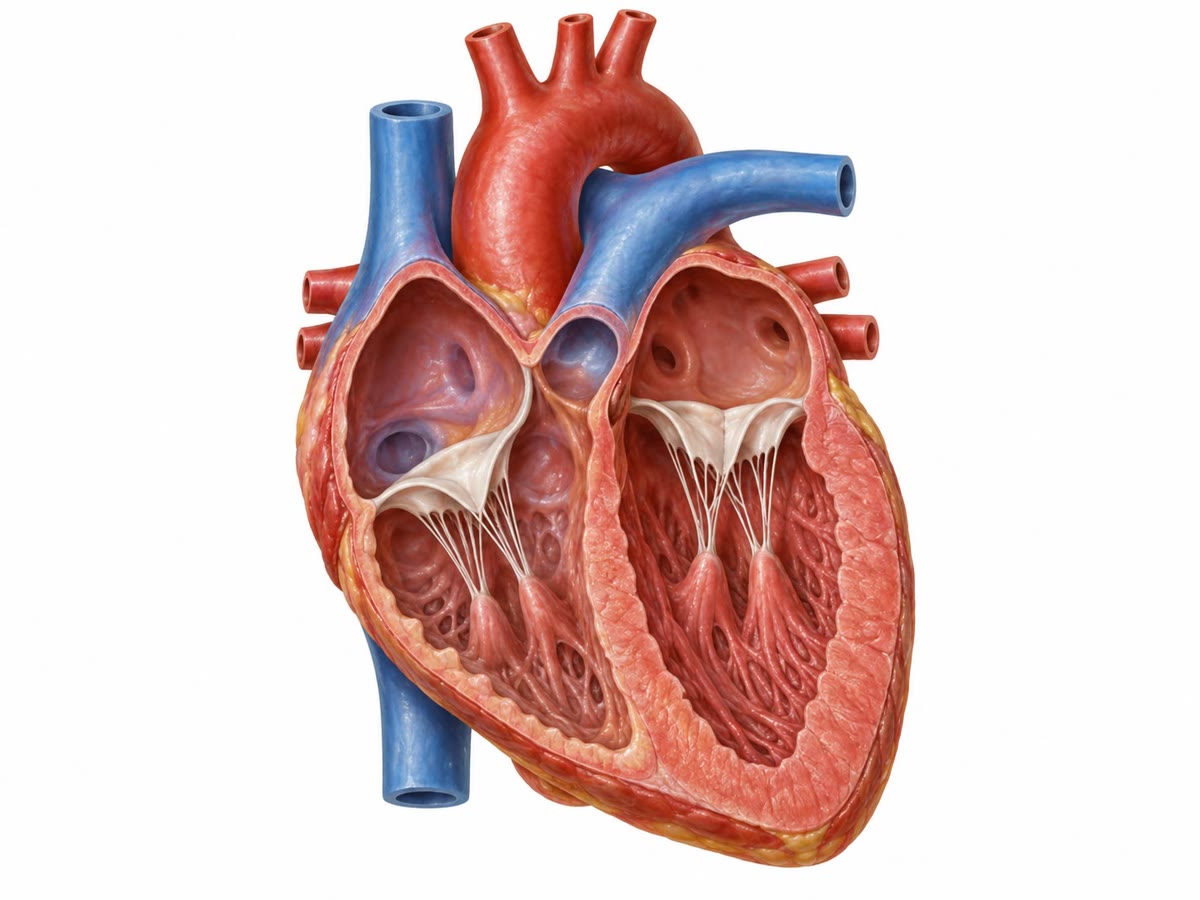
The heart is two pumps side by side, each an atrium that receives blood from the veins and a ventricle that ejects it into an artery. The right heart takes blood from the venae cavae and sends it to the lungs through the pulmonary artery; the left heart takes it back from the pulmonary veins and sends it round the body through the aorta. Four valves make the flow one-way: the atrioventricular valves (tricuspid on the right, mitral on the left), flaps tethered by cords to papillary muscles so that they cannot be blown back into the atrium; and the semilunar valves (pulmonary and aortic), three pockets that fill and seal when the arterial pressure exceeds the ventricle’s. The valves are passive: they open and close on pressure differences alone. The ventricular wall is myocardium, striated muscle of branched cells joined end to end by intercalated discs full of gap junctions, so that the whole ventricle is electrically one cell and contracts as one; the left ventricle’s wall is three times thicker than the right’s because it pumps against five times the pressure. The heart muscle is fed by its own coronary arteries, which fill in diastole, and it runs almost entirely on aerobic metabolism — it cannot borrow.
Proposition 17.2 (The cardiac cycle)
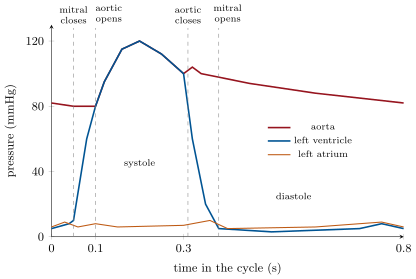
One beat at rest lasts about . Diastole (): the ventricles relax, their pressure falls below the atria’s, the atrioventricular valves open and blood flows in, mostly passively, then with a final push from atrial contraction; the ventricle ends diastole holding about (the end-diastolic volume). Systole (): the ventricles contract; as soon as their pressure exceeds the atrial pressure the atrioventricular valves close (the first heart sound, “lub”), and for a few hundredths of a second the ventricle squeezes a closed chamber — isovolumetric contraction — until its pressure passes the arterial pressure ( on the left), when the semilunar valves open and blood is ejected. The left ventricle reaches and expels about (the stroke volume, an ejection fraction of ); as it relaxes, its pressure falls below the aorta’s, the aortic valve snaps shut (the second sound, “dub”), and an isovolumetric relaxation brings the pressure down to the atrial level, when filling resumes. The right heart does the same at a fifth of the pressure, ejecting the same volume.
Theorem 17.3 (The work of the heart)
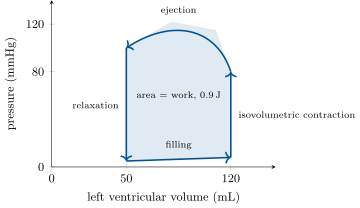
Plotted as pressure against volume, one beat of the left ventricle traces a loop — filling along the bottom, isovolumetric contraction up the right side, ejection along the top from to , isovolumetric relaxation down the left — and the area of the loop is the mechanical work of the beat:
At 72 beats a minute the left ventricle does about , the right ; the heart’s metabolism is some , so its mechanical efficiency is near , the rest being heat and the cost of tension. Raising the pressure the heart pumps against (hypertension, a narrowed aortic valve) raises the work per beat in proportion, and the muscle thickens in response as any muscle does — until its coronary supply can no longer keep up with its bulk.
Proof. Work is force times distance, and for a pressure acting on a moving wall, pressure times swept volume: . Round a closed loop the net work is the enclosed area (filling at low pressure costs little; ejection at high pressure returns much more). and : ; times beats a second, . ∎
17.2 The heart’s own clock
Proposition 17.4 (Automaticity and conduction)
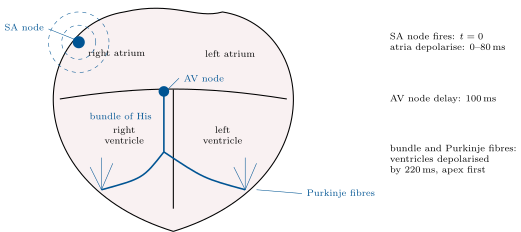
The beat originates in the sinoatrial node, a patch of specialised muscle cells in the wall of the right atrium whose membrane potential never rests: after each action potential it drifts slowly upward (a pacemaker potential, driven by a sodium current that switches on at negative potentials and by calcium channels) until it reaches threshold and fires again, about a hundred times a minute if left alone. The impulse spreads through the atrial muscle, cell to cell through the gap junctions, and the atria contract; it reaches the atrioventricular node, the only electrical bridge between atria and ventricles, which conducts slowly and delays it by a tenth of a second — time for the atria to finish filling the ventricles; then it races down the bundle of His and the Purkinje fibres, fast-conducting cells that deliver it to the whole ventricular muscle within , so that the ventricles contract from the apex upward, as a unit, and drive the blood toward the outflow valves. Every part of this system can pace on its own, each more slowly than the last (the node at 100, the AV node at 50, the Purkinje fibres at 30), so that if the node fails a lower centre takes over — at a slower rate.
Evidence. An isolated heart, or a strip of sinoatrial tissue, beats in a dish without nerves; a strip of ventricle beats too, but more slowly. Cooling or warming the sinoatrial node alone changes the rate of the whole heart; cutting the AV bundle dissociates the ventricles, which then beat at their own slow rhythm while the atria continue at the node’s (heart block). Recording from a single node cell shows the slow diastolic depolarisation that no ordinary muscle cell has; blocking the pacemaker current slows it. ∎
Proposition 17.5 (The electrocardiogram)
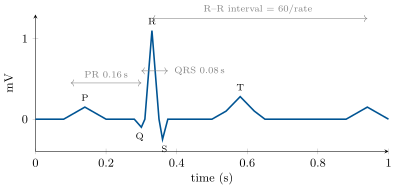
The heart is a large mass of cells depolarising and repolarising in sequence, and the currents that flow in the body around it can be recorded as voltages of a millivolt between electrodes on the limbs: the electrocardiogram. Its waves are the events of the conduction system: the P wave is atrial depolarisation; the flat PR interval () is the AV delay; the QRS complex, sharp and brief (), is ventricular depolarisation — large because the ventricular mass is large, brief because the Purkinje fibres are fast; the T wave is ventricular repolarisation. (Atrial repolarisation is buried in the QRS.) The trace reports timing and conduction, not force: a blocked AV node lengthens the PR interval or dissociates P from QRS, a dead region of ventricle distorts the QRS, an irregular atrium (atrial fibrillation) replaces P waves with noise and makes the ventricles beat irregularly, and an interval between R waves gives the rate.
17.3 Regulating the output
Theorem 17.6 (The Frank–Starling law)
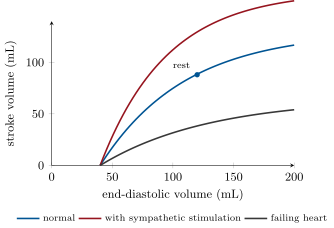
The force of a ventricular contraction rises with the volume that filled it: within the working range, the more the ventricle is stretched in diastole (the preload), the more it ejects in systole. The heart therefore pumps out, beat by beat, whatever it receives — a rise in venous return of is met by a rise in stroke volume of without any nerve or hormone — and the two ventricles, which must move the same volume, balance each other automatically: if the right heart delivers more blood to the lungs, the left heart receives more and pumps more. The mechanism is in the sarcomere: at the short lengths of a poorly filled ventricle the thick and thin filaments overlap too much and the calcium sensitivity is low; stretching toward the optimal length () increases both the overlap available for cross-bridges and the sensitivity, so that the same calcium pulse produces more force. Beyond the optimum (an overstretched, failing heart) the force falls again.
Evidence. Frank (1895) recorded the pressure developed by a frog ventricle filled to different volumes: the peak pressure rose with the filling volume up to a maximum and then fell. Starling (1914), with a dog heart–lung preparation in which venous return and arterial resistance could be set independently, showed that raising the return raised the output stroke by stroke, and that raising the arterial resistance was met, after a few beats of accumulation, by a larger end-diastolic volume and a restored output — the ventricle answers a load by stretching and a stretch by contracting harder. ∎
Proposition 17.7 (Nerves and hormones)
The cardiac output is heart rate times stroke volume, at rest and up to in a trained athlete’s exercise. Both factors are set by the autonomic nerves. The vagus (parasympathetic), releasing acetylcholine onto the sinoatrial node, slows the pacemaker drift and holds the resting rate at 70 rather than the node’s own 100; cut the vagi and the rate rises. The sympathetic nerves, releasing noradrenaline, and the adrenal medulla, releasing adrenaline into the blood, speed the drift (more beats), speed conduction, and raise the force of contraction at any filling (a steeper Starling curve, the property called contractility), by raising the calcium delivered to the sarcomeres at each beat. In exercise the vagal brake is released first, then the sympathetic accelerator pressed, and a rate of 180 with a stroke volume of gives ; the signals are relayed through the receptors and second messengers of Chapter 19, and the whole is commanded by the pressure-regulating centres of Chapter 18.
Example 17.8 (Reading a heart)
Two sounds per beat: lub, the AV valves closing at the start of systole; dub, the semilunar valves closing at its end. A murmur is turbulent flow through a narrowed valve (a stenosis) or back through a leaking one (an insufficiency): a murmur between lub and dub is a leaking mitral valve or a narrowed aortic valve, after dub a leaking aortic valve. A pulse of 70 with a blood pressure of mmHg means a stroke volume near ; a rate of 40 in an athlete is a large stroke volume and a strong vagal tone; a rate of 40 with a PR interval that lengthens until a beat drops is a diseased AV node. The physiology of this chapter is what a physician hears through a stethoscope in thirty seconds.
17.4 Exercises
Exercise 17.1 ★
Trace a drop of blood from the vena cava to the aorta, naming each chamber, valve and vessel in order.
Exercise 17.2 ★
Give the phases of the cardiac cycle with the state of each valve in each phase, and the event that causes each of the two heart sounds.
Solution
Solution of Exercise 17.2.
Filling (diastole): AV valves open, semilunar closed. Isovolumetric contraction: all four closed. Ejection: semilunar open, AV closed. Isovolumetric relaxation: all closed. First sound: the AV valves closing at the start of systole; second: the semilunar valves closing at its end.
Exercise 17.3 ★
Name the parts of the conduction system in order, with the time the impulse takes to reach each, and the ECG wave each produces.
Solution
Solution of Exercise 17.3.
Sinoatrial node (; the P wave as the atria depolarise); atrioventricular node (reached at about , holding the impulse for : the PR segment); bundle of His and Purkinje fibres (; the QRS as the ventricles depolarise); the T wave later as they repolarise.
Exercise 17.4 ★
State the Frank–Starling law and say why it guarantees that the two ventricles pump the same volume.
Exercise 17.5 ★★
A heart has an end-diastolic volume of and an end-systolic volume of at 70 beats a minute. Compute the stroke volume, the ejection fraction and the cardiac output. A failing heart has and : recompute, and say what has happened to the ejection fraction.
Solution
Solution of Exercise 17.5.
Stroke volume ; ejection fraction ; output . Failing: , , — the dilated ventricle keeps the output nearly up by working at a large volume, but ejects only a third of what it holds.
Exercise 17.6 ★★
Compute the work of a beat for a stroke volume of at a mean ejection pressure of , and the power at 72 beats a minute. Recompute for a hypertensive at . How much extra oxygen per minute does the second heart need, if the mechanical efficiency is and of oxygen yields ?
Solution
Solution of Exercise 17.6.
; power . At : , . Extra mechanical is metabolic, of oxygen a second: more.
Exercise 17.7 ★★
On an ECG the R waves are apart in one recording and in another. Give the heart rates. In a third, P waves come every and QRS complexes every , with no fixed relation. What has happened?
Solution
Solution of Exercise 17.7.
beats a minute; . Third: complete heart block — the atria beat at 100 under the node, the ventricles at 33 under a pacemaker of their own, and the AV node conducts nothing.
Exercise 17.8 ★★
The sinoatrial cell’s potential drifts from to a threshold of at before each action potential of . Compute the interval between beats and the rate. Acetylcholine lowers the drift to and the starting potential to ; noradrenaline raises the drift to . Compute both rates.
Solution
Solution of Exercise 17.8.
Drift , plus : , 63 beats a minute. Acetylcholine: , plus : , 39 a minute. Noradrenaline: , plus : , 92 a minute.
Exercise 17.9 ★★
Explain why the AV node’s delay is necessary, what would happen to the output without it, and why a slow AV node (a long PR interval) is harmless up to a point and dangerous beyond it.
Solution
Solution of Exercise 17.9.
The delay lets the atria finish emptying into the ventricles before the ventricles contract; without it atria and ventricles would contract together, the AV valves would shut on half-filled ventricles and the stroke volume would fall by the atrial contribution. A long PR interval merely postpones ventricular systole and costs nothing until the delay grows so long that beats are dropped or conduction fails altogether.
Exercise 17.10 ★★★
An athlete at rest has a rate of 45 and an output of ; in exercise a rate of 180 and . Compute the stroke volumes and say what the Starling curve and the sympathetic nerves each contribute. Why can the rate not usefully exceed about 200?
Solution
Solution of Exercise 17.10.
Rest: ; exercise: . The Starling law converts the larger venous return of exercise into a larger stroke volume; the sympathetic nerves add rate and contractility (a lower end-systolic volume). Above about 200 the diastole is too short to fill the ventricle and the stroke volume falls faster than the rate rises.
Exercise 17.11 ★★★
A narrowed aortic valve leaves an opening of instead of . Using continuity, compute the velocity of the ejected blood at through each, and, from Bernoulli (), the pressure the ventricle must generate above the aortic pressure in each case. What does the ventricle do about it, and what is the eventual cost?
Exercise 17.12 ★★★
“The heart is a pump that regulates itself and is only adjusted by the nervous system.” Discuss, distinguishing what automaticity, the Frank–Starling law and the autonomic nerves each provide, and what a transplanted heart — which has no nerves — can and cannot do.
Solution
Solution of Exercise 17.12.
Automaticity gives a beat without any input; the Starling law matches output to return and balances the two ventricles without any input; the nerves and adrenaline only set the rate and contractility around that self-regulated core. A transplanted heart beats (at about 100, without vagal tone), adjusts its stroke volume to filling, and can raise its output in exercise by the Starling mechanism and by circulating adrenaline — but slowly, and less than an innervated heart.
17.5 Problem: A Heart Under Load
Problem 17.1
Weekend problem — one heart followed from rest to exercise and into disease: its cycle timed, its work computed, its electrocardiogram read, its Starling response and its autonomic control quantified, and a narrowed valve’s cost estimated, ending on the output at rest and in exercise, the work per beat, and the gradient across the stenosis
Data: at rest, rate 70, end-diastolic volume , end-systolic , mean ejection pressure (), aortic pressure mmHg. Systole lasts at any rate. Pacemaker: drift from to , action potential . The heart consumes per millilitre of oxygen with a mechanical efficiency of ; coronary blood carries of oxygen per millilitre and the heart extracts of it. Blood density .
Part I — The cycle at rest.
- Compute the stroke volume, ejection fraction and cardiac output.
- Compute the duration of one cycle and of diastole.
- Compute the mean ejection rate during systole, in millilitres per second, and the mean velocity through an aortic valve of .
- The ventricular pressure rises at during isovolumetric contraction, from 10 to . How long does that phase last?
- Compute the work of one beat and the mechanical power of the left ventricle.
- Compute the heart’s total power and oxygen consumption (both ventricles: take the right as a fifth of the left).
- Compute the coronary blood flow needed to supply that oxygen.
Part II — The pacemaker and the trace.
- What drift rate () gives a rate of 70?
- The vagus is cut: the rate becomes 100. What drift rate is that?
- Compute the drift rate for a rate of 180 in exercise.
- On the ECG at rest, give the R–R interval, and say what the P, QRS and T waves correspond to.
- The PR interval is at rest. Its length is mostly the AV node’s delay: explain what the delay achieves and why a rate of 180 requires the node to speed up too.
- A patient’s ECG shows QRS complexes every with P waves every , unrelated. Diagnose, give the ventricular rate, and say which tissue is pacing the ventricles.
Part III — Exercise. In exercise the rate rises to 180 and the sympathetic nerves raise contractility so that the end-systolic volume falls to ; venous return raises the end-diastolic volume to .
- Compute the stroke volume, ejection fraction and output.
- Compute the duration of diastole at 180 and explain why the rate cannot usefully go much higher.
- Compute the power of the left ventricle at a mean ejection pressure of , and the heart’s oxygen consumption.
- Compute the coronary flow needed, and compare with rest. Why is the diastolic shortening a problem for it?
- Without the sympathetic nerves (a transplanted heart) the rate rises only slowly, through adrenaline in the blood, and contractility less. Predict the output in the first minute of exercise, using the Starling law alone with the same filling.
- Attribute the rise of output from rest to exercise to its three causes (rate, filling, contractility), in litres per minute each.
Part IV — A narrowed valve. The aortic valve narrows to .
- Compute the ejection velocity at rest through the narrowed valve.
- Using Bernoulli, , compute the pressure the ventricle must add to push blood through it, in mmHg.
- Recompute both in exercise.
- What must the ventricle’s peak pressure be in each case to keep the aortic pressure normal, and by what factor is its work per beat raised at rest?
- The ventricle wall thickens in response. Explain why this helps and why it eventually fails (think of the coronary supply and of diastolic filling).
- State the result: the output at rest and in exercise, the work per beat at rest, and the gradient across the narrowed valve at rest and in exercise.
Solution
Solution of Problem 17.1.
1. ; ; . 2. ; diastole . 3. ; . 4. , about . 5. ; . 6. Both ventricles ; at , metabolic; of oxygen a second, . 7. Extracting per millilitre of blood: . 8. Interval , drift time : . 9. Interval , drift : . 10. Interval , drift : . 11. R–R ; P: atrial depolarisation; QRS: ventricular depolarisation; T: ventricular repolarisation. 12. The delay lets the atria empty into the ventricles before they contract; at 180 the whole cycle is , so an unchanged delay would consume half of it — the sympathetic nerves speed the node’s conduction as well. 13. Complete heart block: the ventricles at 40 a minute, paced by the bundle or Purkinje fibres, the atria at 75 under the sinoatrial node. 14. ; ; . 15. : almost no time to fill; faster still and the stroke volume collapses. 16. , a second: ; both ventricles ; metabolic ; oxygen , . 17. , five times the resting flow, to be delivered in a diastole shrunk to a tenth of the cycle: the coronary arterioles must dilate to their limit. 18. Rate about 100 without vagal tone, end-systolic volume unchanged at : stroke volume , output . 19. Rate alone ( at , i.e. ): ; filling ( more at 180): ; contractility ( less residual at 180): — from 4.9 to , the three contributions totalling exactly . 20. , . 21. , . 22. , ; , . 23. Peak at rest, about in exercise; the mean ejection pressure at rest rises from 100 to 122: work per beat . 24. A thicker wall generates more force and lowers the stress per fibre; but the mass to be perfused grows while the coronary flow, squeezed by the thick wall in systole and given a shorter diastole, does not keep pace, and a thick wall relaxes poorly and fills less: ischaemia and failure follow. 25. at rest, in exercise; per beat; gradient at rest and in exercise.