University Biology — Year 3 · Bachelor Year 3
25Molecular Evolution and Phylogenomics
In 1968 Motoo Kimura did a sum that unsettled a field. Comparing the haemoglobins, cytochromes and other proteins of mammals whose common ancestors were dated by fossils, he found that amino acids had been replaced at a rate of roughly one substitution per site per billion years — which, over a mammalian genome and a generation, came to a new substitution fixed in the population every two years or so. Haldane had shown a decade earlier that natural selection can fix at most about one substitution per three hundred generations before the cost in lost offspring becomes unpayable. The arithmetic left one way out: most of the changes that accumulate in DNA are not driven by selection at all, but are neutral, fixed by chance in finite populations, at a rate that — as this chapter’s first theorem shows — is simply the mutation rate. The neutral theory became the null hypothesis of molecular evolution, the baseline against which selection is detected; the molecular clock became a way of dating what fossils could not; and the genomes sequenced since have given the tools to see, gene by gene, where selection has acted, how new genes are born from old, and why the tree of a gene is not always the tree of its species.
25.1 Drift, mutation and the neutral rate
Theorem 25.1 (The neutral substitution rate)
In a diploid population of individuals, a new mutation with no effect on fitness has probability of eventually replacing all other alleles (fixation) and of being lost. If each of the gene copies mutates at rate per generation, new neutral mutations arise per generation and, in the long run, the rate at which substitutions accumulate is
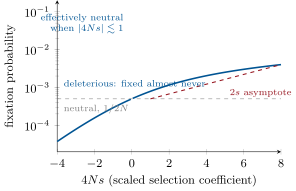
the neutral substitution rate equals the mutation rate, independent of population size. A mutation destined to fix takes on average generations to do so, so large populations hold more variation in transit but fix it no faster. For a mutation with selective advantage , Kimura’s formula gives the fixation probability
so an advantage of is fixed with probability about — forty times a neutral mutation’s chance in a population of two thousand, but still lost forty-nine times in fifty; and a disadvantage with is fixed essentially never, while one with behaves as neutral: selection sees only what drift does not swamp, and the boundary is — effectively neutral.
Proof. Neutrality: some copy present today will be the ancestor of the whole population in the distant future, and by symmetry each of the copies is equally likely to be it; the new mutant is one copy, hence . Rate: substitutions per generation (mutations arising per generation) (probability each fixes) . Kimura’s formula follows from the diffusion approximation to the change of allele frequency under drift and selection, admitted here; its limits are checked directly: as , , the neutral value; for the denominator is and the numerator . Fixation time: the frequency of a neutral allele performs a random walk with variance per generation, and the expected time to reach from , conditional on doing so, is generations (Kimura and Ohta, 1969), admitted. ∎
Evidence. Kimura (1968) and King and Jukes (1969) made the argument from rates: the observed rate of amino-acid substitution across mammalian proteins implied more substitutions per generation than Haldane’s cost of selection allowed, so most had to be neutral. The theory’s predictions then held: rates are highest where function is least constrained — synonymous sites, introns, pseudogenes, the third codon position — and lowest in histones and ubiquitin, which change one residue in a hundred million years; the level of variation within species tracks mutation and population size; and the rate of substitution per year is roughly constant across lineages with very different population sizes, as the formula requires and a selectionist account does not. The controversy that followed did not overturn it: it fixed the neutral rate as the null against which selection is measured. ∎

25.2 The molecular clock
Proposition 25.2 (The clock and its irregularities)
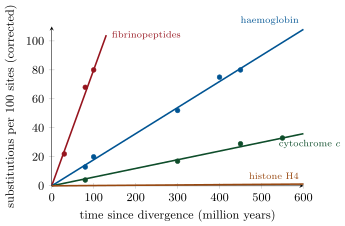
If substitutions accumulate at a constant rate per site per year in two lineages that split years ago, the fraction of sites at which they differ is, for small values, : the divergence of two sequences is a molecular clock (Zuckerkandl and Pauling, 1965), which can be calibrated by one fossil-dated split and then read for splits with no fossils. The clock is stochastic — a Poisson process, so has variance about equal to its mean over a fixed number of sites — and it is irregular in three known ways. Each protein has its own rate, set by the fraction of its sites that function permits to change: fibrinopeptides at , haemoglobin , cytochrome , histone H4 substitutions per site per billion years. Rates differ between lineages: since the neutral rate is per generation, animals with short generations (rodents) accumulate more change per year than those with long (primates, whales) — the generation-time effect, partly offset because per-generation mutation rates rise with generation length. And saturates: once many sites have changed, further changes hit sites already changed, so the raw difference must be corrected for multiple hits, as the alignment chapter’s distances do. Modern relaxed clocks let the rate vary between branches within a statistical model and are calibrated by many fossils at once; they date the split of humans and chimpanzees at six to seven million years, of placental mammal orders near the end of the Cretaceous, and of animals and fungi in the Precambrian, with uncertainties of ten to twenty per cent that come mostly from the fossils.
Proof. Two lineages each accumulate substitutions per site, so the difference between them is where sites have not been hit twice; a fossil-dated pair gives . The Poisson variance and the per-protein rates are Zuckerkandl and Pauling’s, Dickerson’s (1971) and Kimura’s fits to vertebrate protein sets; the saturation correction is the Jukes–Cantor formula of the alignment chapter, . Rate variation between lineages was shown by relative-rate tests: with an outgroup and two species , , the distances should be zero under a strict clock, and are not for rodents against primates. ∎
25.3 Reading selection in sequences
Definition 25.3 (dN/dS)
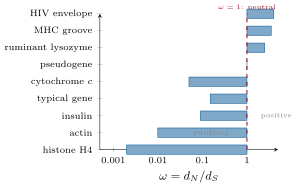
In a protein-coding gene a substitution is synonymous if it leaves the amino acid unchanged and nonsynonymous if it changes it. Because the genetic code lets most third positions and some first positions change silently, about a quarter of the possible mutations in a typical gene are synonymous. Let be the number of synonymous substitutions per synonymous site and the nonsynonymous substitutions per nonsynonymous site, each corrected for multiple hits. Synonymous changes are close to neutral, so estimates — the clock; and the ratio
measures what selection has done to the protein: if amino-acid changes are as free as silent ones (no constraint, as in a pseudogene); under purifying selection, most changes being removed — the typical gene has to , histones ; under positive selection, amino-acid changes being favoured faster than drift alone allows — the antigen-binding groove of MHC molecules, the surface proteins of viruses in an arms race with antibodies, the sperm and egg proteins of fertilisation, and the lysozyme of ruminants, which was recruited to digest bacteria in the stomach. Computed along one branch of a tree or site by site, maps where and when a protein was changed by selection rather than by chance.
Method 25.4 (Estimating )
(1) Align the two coding sequences codon by codon (align the proteins, then map back to the DNA, so that no gap breaks the reading frame). (2) For each codon count the synonymous and nonsynonymous sites: each of its three positions is scored by the fraction of possible changes that are silent — a fourfold-degenerate third position counts as one synonymous site, a position where every change alters the amino acid as one nonsynonymous site, a twofold position as a third of one and two thirds of the other. Sum over codons: synonymous and nonsynonymous sites, with codons. (3) Count the synonymous and nonsynonymous differences between the sequences, resolving codons that differ at two positions by averaging over the possible paths. (4) differences, differences; correct each for multiple hits with Jukes–Cantor. (5) ; test against the sampling variance, which is large when is small — two closely related sequences give an unreliable ratio, and two very distant ones have a saturated . (6) For where and when: fit per branch of a tree, or per site with a mixture of site classes, and test whether a class with improves the fit.
25.4 New genes from old
Definition 25.5 (Duplication, families and transfer)
Most new genes are copies of old ones. A gene duplication — by unequal crossing-over, retrotransposition, or the doubling of a whole genome, as happened twice at the origin of vertebrates and again in the ancestor of teleost fish and in many plant lineages — leaves two paralogues where there was one; genes in different species descended from a single ancestral gene are orthologues. The copy’s usual fate is decay: freed from constraint () it accumulates a stop codon or a frameshift and becomes a pseudogene, of which the human genome carries some twenty thousand. Sometimes both survive: by neofunctionalisation, one copy acquiring a new function while the other keeps the old (the antifreeze glycoprotein of icefish, from a trypsinogen gene; the red and green opsins of primates, from a duplication forty million years ago that gave the trichromatic vision the Year 1 volume described; the lens crystallins, from metabolic enzymes); or by subfunctionalisation, each copy keeping part of the ancestor’s expression or activity so that both are needed. Repeated duplication builds gene families — the globins, the Hox clusters of the development chapter, the thousand olfactory receptor genes of a mouse, a third of them pseudogenes in humans. The other source of new genes is horizontal transfer: bacteria acquire genes from unrelated bacteria by plasmids, phages and free DNA, which is how antibiotic resistance crosses species in a hospital and why a bacterium’s “species” is a core genome surrounded by a shifting cloud; in eukaryotes transfer is rarer but real — the T-DNA Agrobacterium inserts into plants, bacterial genes in bdelloid rotifers, and the ancient wholesale transfers that were the mitochondrion and the chloroplast. Where transfer is common the history of life is a network, and the tree drawn from any one gene is the tree of that gene.
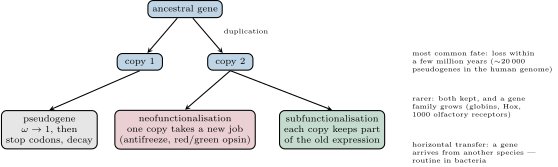
Evidence. Ohno (1970) proposed duplication as the main source of new genes before a single family was sequenced; the globins confirmed it, their tree of , , , , myoglobin and the plant and bacterial globins matching duplication dates to the vertebrate radiation. Chen, DeVries and Cheng (1997) showed the icefish antifreeze gene shares its signal sequence and flanking sequences with trypsinogen and that the antifreeze repeats arose by expansion of a nine-nucleotide piece spanning an intron–exon junction: a new protein from a digestive enzyme’s spare parts, dated by the clock to the freezing of the Southern Ocean. Thornton and colleagues (2006) reconstructed the ancestral sequence of the steroid receptors, synthesised the 450-million-year-old protein, and found it responded to oestrogens only; two later substitutions, identified and tested, switched the duplicated copy’s preference to cortisol — a resurrected ancestor, and the path between it and its descendants walked in the laboratory. ∎
25.5 Gene trees and species trees
Proposition 25.6 (Incomplete lineage sorting)
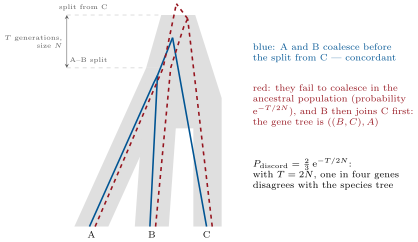
The tree of a gene need not match the tree of the species that carry it. Consider three species with species tree , the – split preceded by an ancestral population of size that persisted for generations before the split from . Two gene copies, one from and one from , traced backward, coalesce in a common ancestor at a rate per generation; the probability that they have not yet coalesced when they enter the population ancestral to all three is , and then the three lineages coalesce in random order, so two thirds of the time the gene tree groups or with . The probability that the gene tree disagrees with the species tree is therefore
For humans, chimpanzees and gorillas, with of a few hundred thousand generations and near , about a third of the genome supports a tree in which humans are closer to gorillas or chimpanzees to gorillas than the species tree — observed. This incomplete lineage sorting, together with duplication and loss and horizontal transfer, is why phylogenomics infers the species tree from thousands of gene trees under a model of the coalescent, rather than concatenating them and drawing one; it also lets the ancestral population sizes themselves be estimated from the fraction of discordant trees, and ancient hybridisations (Neanderthal DNA in modern humans, the gene flow between bears, between butterflies) be read from trees that disagree in a direction drift alone would not produce.
Proof. Two lineages in a diploid population of pick parents from copies each generation and share one with probability ; over generations the chance of never doing so is . Three lineages entering the common ancestral population are exchangeable, so the first pair to coalesce is each of the three pairs with probability ; only the pair matches the species tree, hence of these cases are discordant. Neither the coalescent’s rate nor the exchangeability depends on the gene, so the formula holds for every neutral locus independently, and the fraction of discordant trees across a genome estimates . ∎
Example 25.7 (Reading a genome’s history)
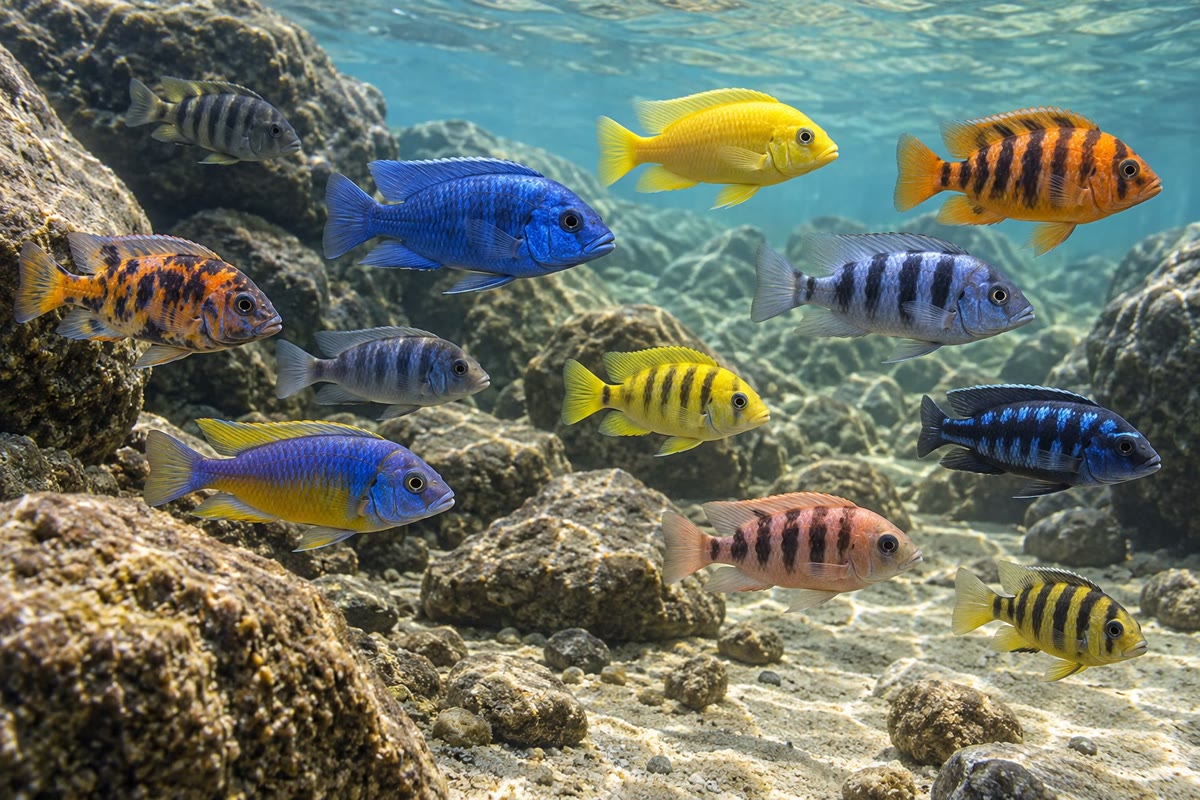
The five hundred cichlid species of Lake Victoria arose in the fifteen thousand years since the lake refilled — too fast for mutation to supply the differences between them. Their genomes show how: the variants that distinguish a bottom-feeder from an algae-scraper were present as standing variation in the river fish that colonised the lake, sorted and recombined, and augmented by hybridisation between lineages; the opsin genes were tuned to clear or turbid water by substitutions that the of their branches shows to have been selected; and the gene trees disagree with one another across the genome in exactly the pattern incomplete lineage sorting and gene flow predict. A radiation is not the origin of new genes but the redistribution of old alleles among new combinations under new selection — which the sequences record, allele by allele, if one knows how to read a tree that is really a forest.
Remark 25.8 (Chance as the baseline)
The neutral theory is not a claim that selection is unimportant; it is a statement of what happens when selection is absent, precise enough to be tested against. Because the neutral rate is the mutation rate, divergence measures time; because neutral change fills the sites that selection leaves free, measures constraint; because neutral lineages coalesce at a known rate, the disagreement of gene trees measures the size of populations no one saw. Selection is then what remains when chance has been subtracted — a gene with above one, a sweep that has emptied variation from a region, a tree that disagrees in a direction drift cannot explain. The Antarctic icefish’s antifreeze, the ruminant’s stomach lysozyme, the primate’s third opsin are the exceptions found this way, and each is a story of a copied gene and a new job. The rest of the genome is a clock.
25.6 Exercises
Exercise 25.1 ★
State the neutral substitution rate and explain in words why it does not depend on population size.
Solution
Solution of Exercise 25.1.
: the neutral substitution rate per site per generation equals the mutation rate. Each generation new neutral mutations arise and each has probability of fixing; a larger population makes more mutations and gives each a proportionally smaller chance, and the two effects cancel exactly.
Exercise 25.2 ★
Define orthologue, paralogue and pseudogene, with one example each from the globin family.
Solution
Solution of Exercise 25.2.
Orthologues: genes in two species descended from one gene in their common ancestor — human -globin and mouse -globin. Paralogues: genes in one genome descended from a duplication — human - and -globin, or and . Pseudogene: a decayed copy that no longer encodes a protein — the gene in the human -globin cluster, complete with stop codons.
Exercise 25.3 ★
What does measure? Interpret , and , and name a gene of each kind.
Solution
Solution of Exercise 25.3.
compares the rate of amino-acid-changing substitution with the rate of silent substitution, which is the neutral baseline. : strong purifying selection, of amino-acid changes removed — actin, histone H3. : no constraint — a pseudogene. : positive selection, amino-acid changes favoured — the peptide-binding groove of MHC, the envelope of HIV, ruminant lysozyme.
Exercise 25.4 ★
Why did Kimura conclude that most substitutions are neutral? Restate the argument with the numbers in the chapter’s opening.
Solution
Solution of Exercise 25.4.
Proteins compared across mammals change at about one substitution per site per billion years; over a genome of a billion coding sites and a generation of a few years that is of the order of one substitution fixed per generation, or one every two years. Haldane’s cost of selection allows about one selected substitution per three hundred generations. The rates differ by a factor of a hundred or more, so nearly all fixed changes must be neutral.
Exercise 25.5 ★★
. Compute the fixation probability of a new mutation with , , and , using Kimura’s formula, and comment on which are effectively neutral.
Solution
Solution of Exercise 25.5.
Neutral: . , : . : . : . None is effectively neutral: that would need , i.e. ; a selection coefficient of a tenth of a per cent is already decisive in a population of five thousand.
Exercise 25.6 ★★
Two species differ at of the sites of a gene whose neutral rate is per site per year. Estimate their divergence time with and without the Jukes–Cantor correction. At what raw difference does the correction reach a factor of two?
Solution
Solution of Exercise 25.6.
Uncorrected: . Jukes–Cantor: , . The correction reaches a factor of two when , at : by then the raw difference has lost most of its information.
Exercise 25.7 ★★
A gene of 300 codons has 700 nonsynonymous and 200 synonymous sites. Between two species it shows 7 nonsynonymous and 10 synonymous differences. Compute , and (uncorrected). Which selection regime? What if the counts were 35 and 10?
Solution
Solution of Exercise 25.7.
, , : purifying selection removing four fifths of amino-acid changes. With and : , : no detectable constraint — a pseudogene, or a gene in which positive selection at some sites balances purifying selection at others.
Exercise 25.8 ★★
Human and chimpanzee neutral sequences differ at ; the split was ago, generation time . Estimate the mutation rate per site per generation, and the number of new mutations in a diploid genome of bases each generation.
Solution
Solution of Exercise 25.8.
per site per year; per site per generation; new mutations per diploid genome per generation. Direct sequencing of parents and children finds about seventy: the divergence estimate is inflated by polymorphism already present in the ancestral population, which adds a few hundred thousand generations to the apparent split.
Exercise 25.9 ★★
With and generations between the two splits, compute the fraction of gene trees discordant with the species tree for human, chimpanzee and gorilla. What would make it ?
Solution
Solution of Exercise 25.9.
; discordant fraction . For : , generations.
Exercise 25.10 ★★★
Show that Kimura’s formula reduces to as and to for , and that for with it behaves as . Hence estimate how strongly deleterious a mutation must be, in a population of , to have its fixation probability reduced a hundredfold below neutral.
Solution
Solution of Exercise 25.10.
As : and , ratio . For the denominator is and the numerator . For with : numerator , denominator , so . A hundredfold below neutral in : ; gives . So , : a disadvantage of a hundredth of a per cent is enough, in ten thousand individuals, to make fixation a hundred times rarer than chance.
Exercise 25.11 ★★★
A relative-rate test: an outgroup is at corrected distance from mouse and from human, and mouse and human are apart. Compute the mouse and human branch lengths since their split (assume the split point is equidistant from on the two paths), and their ratio. With a mouse generation of and a human one of , what would a strict per-generation clock predict for the ratio, and what does the observation say about mutation rates per generation?
Solution
Solution of Exercise 25.11.
With the split point at distance from on both paths, , , : , so , , ratio . A strict per-generation clock would give the ratio of generation counts, . The observed means the mouse has accumulated only twice the human change per year despite fifty times the generations: the mutation rate per generation must be some times higher in humans — more germ-line cell divisions per generation — so that per year the two lineages differ by only a factor of two.
Exercise 25.12 ★★★
A duplicated gene is released from constraint () at neutral rate per site per year. In a 1000-base coding sequence, roughly how many years until the first stop codon or frameshift is expected (assume about of random point mutations in a coding sequence create a stop codon, and ignore indels)? Compare with the time selection has to find a new function, and explain why most duplicates die.
Solution
Solution of Exercise 25.12.
Stop-creating substitutions arrive at per year: the first is expected after about (frameshifts roughly halve this). In that window a beneficial mutation, one in to of all mutations, is far less likely to arrive than a stop codon, and even when it arrives it fixes with probability only . So the copy is usually dead before selection can find it a use — the observed half-life of duplicates in vertebrates is a few million years.
25.7 Problem: The Rate of Change
Problem 25.1
Weekend problem — a genome’s history in numbers: the mutation rate from the human–chimpanzee divergence, Kimura’s substitution load, the fixation odds of selected mutations, a gene’s from codon counts, the clock read for a duplication, and the discordance of gene trees among the great apes, ending on the mutation rate, the of the gene and the discordant fraction
Data: human–chimpanzee neutral divergence ; split ago; generation ; diploid genome bases, coding. Ancestral population . Gene: 400 codons, 920 nonsynonymous and 280 synonymous sites; human–mouse differences 46 nonsynonymous and 84 synonymous. Human–mouse split . Globin: and differ at of amino-acid sites (raw); haemoglobin rate per site per year. Apes: between the gorilla and chimpanzee splits generations. Haldane’s limit: one selected substitution per 300 generations.
Part I — The rate.
- From , compute per site per year, then per site per generation.
- New mutations per diploid genome per generation, and how many of them fall in coding sequence.
- Substitutions fixed per generation in the whole genome at the neutral rate (the population fixes per site per generation). Compare with Haldane’s limit and draw Kimura’s conclusion.
- In a population of , how many new neutral mutations arise per site per generation in the whole population, and what fraction of them will ever fix?
- How long does a neutral mutation destined to fix take, in generations and years? Compare with the time since the human–chimpanzee split.
- Explain why, despite question 5, the divergence between two species measures the time since their split and not the time since their alleles fixed.
Part II — Selection’s odds.
- Fixation probability of a neutral mutation in , and of one with , , .
- For which is ? Interpret the boundary.
- A deleterious mutation with : fixation probability relative to neutral. And ?
- If a fraction of new mutations in a gene are beneficial with and the rest neutral, what fraction of the substitutions in that gene are adaptive? Comment on how rarely selection shows in the sequence even when it acts.
- Compute and for the human–mouse gene, correct each with Jukes–Cantor, and give .
- Interpret ; and estimate the neutral rate the gene’s implies (per site per year) using the split time. Is it consistent with question 1?
Part III — Clocks and copies.
- Correct the – globin difference for multiple hits (use , the protein version with many states), and date the duplication with the haemoglobin rate.
- The date falls near the origin of jawed vertebrates (). What does having separate and chains allow that a single chain does not?
- Fibrinopeptides change at per site per year. Two species split ago: expected raw difference? Why is this protein useless for dating splits of ?
- Histone H4 changes at : how many substitutions in 100 sites over ? Why is it useless for dating recent splits?
- A duplicate gene drifts with from the moment of duplication. If of substitutions in coding sequence create stops, and the gene has 1200 sites at rate per site per year, estimate the expected time to the first stop codon.
- Why does whole-genome duplication give duplicates a better chance of survival than a single tandem duplication?
Part IV — Trees within trees.
- Probability that a human and a chimpanzee lineage fail to coalesce in the generations before the gorilla split.
- Fraction of gene trees discordant with the species tree. Observed: about . Consistent?
- Of the discordant trees, what fraction group human with gorilla, and what fraction chimpanzee with gorilla? What would a strong departure from equality indicate?
- If the ancestral population had been , what discordant fraction would you expect? What does the observed fraction therefore say about our ancestors’ numbers?
- Why does concatenating a thousand genes into one alignment give a confident but possibly wrong tree, and what does a coalescent method do instead?
- Neanderthal DNA in non-African humans is about and the trees carrying it group some Europeans with Neanderthals more often than Africans. Why is this not incomplete lineage sorting?
- Summarise: (question 1), of the gene (question 11), and the discordant fraction (question 20).
Solution
Solution of Problem 25.1.
1. per site per year; per site per generation. 2. new mutations per diploid genome; of them, about , in coding sequence. 3. Per haploid genome, substitutions fixed per generation, against Haldane’s : twenty thousand times more than selection could drive, so the overwhelming majority are neutral. 4. new mutations per site per generation in the population; of them will fix. 5. generations, — nearly as long as the time since the split. 6. Divergence counts the mutations that arose along the two separate lineages since their common ancestor; each fixes within its own lineage, and the long-run rate is whatever the time each takes, since mutations arise steadily and the lag only delays, without changing, the flow. (The only correction is for polymorphism present at the split, which makes the common ancestor of two alleles older than the species split.) 7. Neutral ; : ; : ; : . 8. : below this drift swamps selection and the mutation behaves as neutral; above it selection governs the odds. 9. : , zero for all purposes — of neutral. , : , of neutral: mildly deleterious mutations do fix. 10. Beneficial substitutions per site per generation: ; neutral: . Adaptive fraction . Though each beneficial mutation is two thousand times likelier to fix than a neutral one, they are so rare that only one substitution in fifty is adaptive: selection acts and barely shows. 11. , . Corrected: , . . 12. Purifying selection removing about of amino-acid changes — a typical gene. per site per year: twice the human–chimp value, as expected for a comparison that includes the fast-ticking rodent lineage; the same order of magnitude. 13. per site; . 14. Two different chains make the tetramer, whose cooperative oxygen binding, Bohr effect and allosteric control by 2,3-bisphosphoglycerate depend on the interface between unlike subunits; and the cluster could then diversify into embryonic, fetal and adult chains with different affinities. 15. substitutions per site; with saturation among twenty amino acids the raw difference is about . At , : every site has changed many times and the raw difference sits at its ceiling of , carrying no information about time. 16. substitutions between two lineages in 100 sites over a billion years. For a split the expectation is : almost always zero differences, no resolution. 17. per year: the first stop is expected after about . 18. Doubling the whole genome doubles every gene at once, so the stoichiometry of interacting proteins is preserved and no dosage imbalance selects against the copies; a lone tandem duplicate changes one gene’s dose and is often deleterious, or immediately redundant and free to decay. 19. . 20. : consistent with the observed . 21. Half each, of all trees grouping human with gorilla and chimpanzee with gorilla. A clear excess of one would indicate gene flow between those two species after their split, which drift cannot produce. 22. : , discordance . The observed therefore requires an ancestral population of some fifty thousand — several times the effective size of humans today. 23. Concatenation assumes every gene has the species tree; with incomplete lineage sorting the genes have many trees, and for short internal branches the commonest gene tree can differ from the species tree, so more data make the wrong answer more confident. A coalescent method computes, for each candidate species tree, the expected distribution of gene trees, and picks the species tree that best explains the frequencies observed. 24. Incomplete lineage sorting happened in the common ancestral population of all modern humans, so it would make every human population equally related to Neanderthals. An excess in non-Africans means Neanderthal alleles entered after the ancestors of non-Africans left Africa: admixture, some fifty thousand years ago. 25. per site per generation; ; about of gene trees discordant with the species tree.