University Biology — Year 3 · Bachelor Year 3
14Microbiomes and Symbioses
You carry about thirty-eight trillion bacteria, roughly one for every cell of your own, most of them in the last metre of your gut, where they weigh about as much as your brain and carry a hundred times more genes than you do. A mouse raised without any of them needs a third more food to keep its weight, has a stunted immune system, and behaves oddly. A pea plant feeds a tenth of its sugar to bacteria in nodules on its roots and gets its nitrogen in return; four fifths of all land plants trade sugar for phosphate with fungi wrapped around their roots, as they have for four hundred million years; a coral is an animal that farms algae inside its cells and dies when the sea warms enough to make it evict them. Living things are not individuals but consortia, and this chapter treats the biology of the partnerships: how they are counted and characterised by sequencing, what the partners exchange, how the exchange is negotiated and policed, and why some partners end up as organelles.
14.1 Words for living together
Definition 14.1 (Symbiosis)
Symbiosis is the sustained, intimate association of organisms of different species; it is a mutualism if both gain, a commensalism if one gains and the other is unaffected, and a parasitism if one gains at the other’s expense — and the same pair may move along that line with circumstances. An endosymbiont lives inside its host’s cells; an obligate partner cannot live alone. Symbionts are transmitted vertically, from parent to offspring (the aphid’s Buchnera pass through the egg), or horizontally, acquired anew each generation from the environment or from other hosts (the squid’s Vibrio, the human gut’s bacteria). The microbiome is the whole community of microbes of a habitat — a gut, a leaf surface, a gram of soil — and the holobiont is a host together with its microbiome, considered as the unit that natural selection sees.
Example 14.2 (Three obligate partners)
The aphid Buchnera has lived inside its host’s cells for two hundred million years, makes the essential amino acids that phloem sap lacks, and has shrunk its genome to — a seventh of its free-living relatives’ — losing every gene the host now supplies. The bacterium Wolbachia, in two thirds of insect species, is transmitted through eggs only, and so has evolved to favour females: it kills male embryos, feminises them, or makes uninfected females’ eggs die when fertilised by infected males (cytoplasmic incompatibility), which spreads it through a population; mosquitoes carrying it transmit dengue poorly, and releasing them has cut dengue in several cities. The amoeba Paulinella took in a cyanobacterium about a hundred million years ago that is now neither quite a bacterium nor quite a chloroplast — a second, independent origin of photosynthetic organelles, caught halfway.
14.2 Counting a community
Method 14.3 (Profiling a microbiome by sequencing)
Most microbes cannot be cultured; they are counted by their DNA. (1) Extract DNA from the sample — faeces, soil, seawater filtered onto a membrane. (2) Either amplify the gene for the small-subunit ribosomal RNA (16S) with primers matching its universal regions, and sequence the variable regions between them — an amplicon survey, cheap, which identifies bacteria to about the genus and counts them by read number; or sequence all the DNA — shotgun metagenomics, which recovers genes and whole genomes and so reports what the community can do, not only who is there. (3) Cluster the reads into sequence variants or operational taxonomic units (OTUs, conventionally at identity for a “species”), assign them by comparison with databases (Chapter 5), and tabulate counts per sample. (4) Compute diversity within a sample and compare composition between samples. The counts are relative — a sample’s reads sum to a fixed total — and are biased by extraction, primers and copy number, so differences between samples processed the same way are trustworthy where absolute numbers are not.
Definition 14.4 (Diversity)
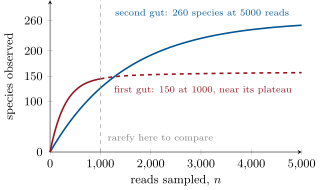
For a community of species with relative abundances (): the richness is ; the Shannon index measures the uncertainty about the species of a randomly drawn individual, and is the number of equally abundant species that would give the same uncertainty (the effective number of species); the Simpson index is the probability that two individuals drawn at random are of the same species, and is another effective number, weighted toward the common species. Richness depends on how many individuals one has looked at: a rarefaction curve plots the species found against the number of individuals sampled, and flattens when most species have been seen.
Theorem 14.5 (Rarefaction)
A sample contains individuals of species, of species . The expected number of species in a random subsample of individuals, drawn without replacement, is
which rises with and equals at . Two samples of different sizes are compared by rarefying both to the same . The fraction of the community’s individuals belonging to species not yet seen is estimated by Good’s coverage: about , where is the number of species seen exactly once (singletons).
Proof. Species is absent from the subsample exactly when all individuals are drawn from the others, which happens in of the equally likely subsamples; so species is present with probability , and the expected count of species present is the sum of these probabilities (expectation of a sum of indicators). Each term increases with , and at every binomial in the numerator is zero. Good’s estimate: an individual drawn next belongs to an unseen species with about the probability that a randomly chosen individual of the sample was the only one of its kind, (Good, 1953); its justification is admitted here. ∎
Example 14.6 (Two guts)
A sample of reads from one person yields species, with and singletons; a sample of reads from another yields species. The second is not necessarily more diverse: it was sampled five times more deeply, and rarefying it to reads may give too. The first sample’s coverage is : four per cent of the bacteria in that gut belong to species the sample never saw, and a deeper sample will find them. Effective numbers, species’ worth of evenness against a richness of , say that a few species dominate — which is how every gut looks.
14.3 The human microbiome
Definition 14.7 (The gut community)
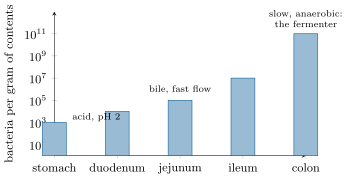
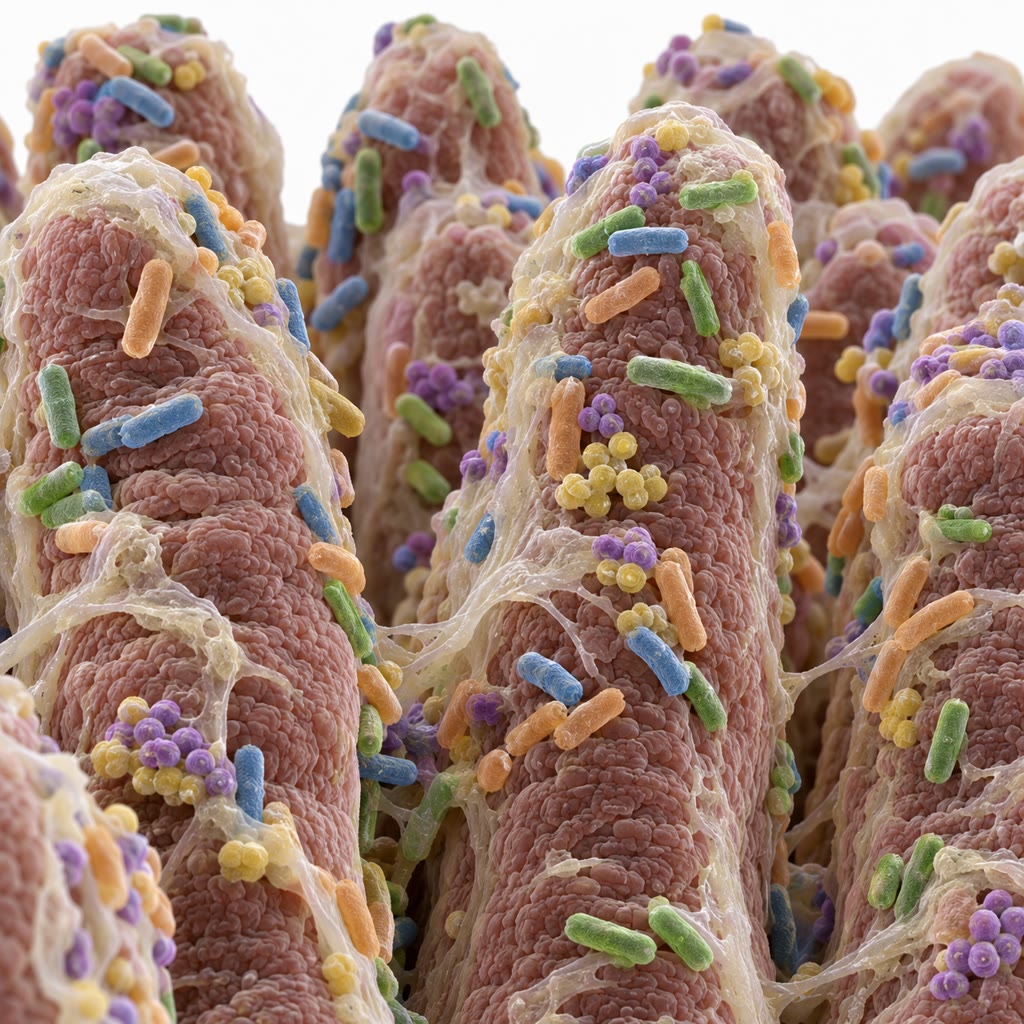
The human gut holds about bacteria, nearly all in the colon at per gram of contents, against per gram in the acid stomach and – along the small intestine, whose flow is fast and whose bile is hostile. Some five hundred to a thousand species per person, most from two phyla, the Bacteroidetes and the Firmicutes, nearly all anaerobes; each person’s set is distinct and stable for years, fixed largely in the first three years of life from the mother and the household. What they do: ferment the fibre that human enzymes cannot digest into short-chain fatty acids — acetate, propionate, butyrate — which feed the colon’s own cells and supply up to a tenth of the host’s calories; make vitamin K and some B vitamins; transform bile acids and drugs; occupy every niche so that an invader finds no foothold (colonisation resistance); and train the immune system, whose regulatory T cells and IgA-secreting cells develop in response to them (Chapter 16). A community shifted away from this state — fewer species, fewer fermenters, more facultative aerobes — is a dysbiosis, seen in inflammatory bowel disease, after antibiotics, and in obesity, though which is cause and which effect is usually unclear.
Evidence. Mice raised germ-free in sterile isolators (Gordon and colleagues, 2000s) have thin intestinal walls, small lymphoid organs, low levels of antibody, and need more calories to maintain their weight; colonised with a normal mouse microbiota they gain fat within two weeks. Given the microbiota of an obese mouse rather than a lean one, germ-free mice gained more fat on the same food (Turnbaugh, 2006): the community itself affects energy harvest. In humans, recurrent Clostridioides difficile colitis — a dysbiosis in which antibiotics have cleared the competitors of a toxin-producing spore former — was cured in of patients by infusion of a healthy donor’s faeces, against with the standard antibiotic (van Nood, 2013), the first randomised trial in which a community, not a molecule, was the drug. ∎
14.4 Plants and their partners
Definition 14.8 (The legume–rhizobium symbiosis)
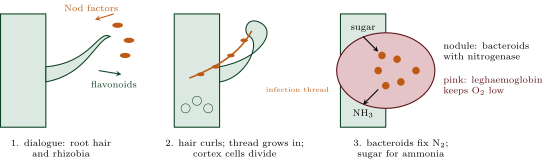
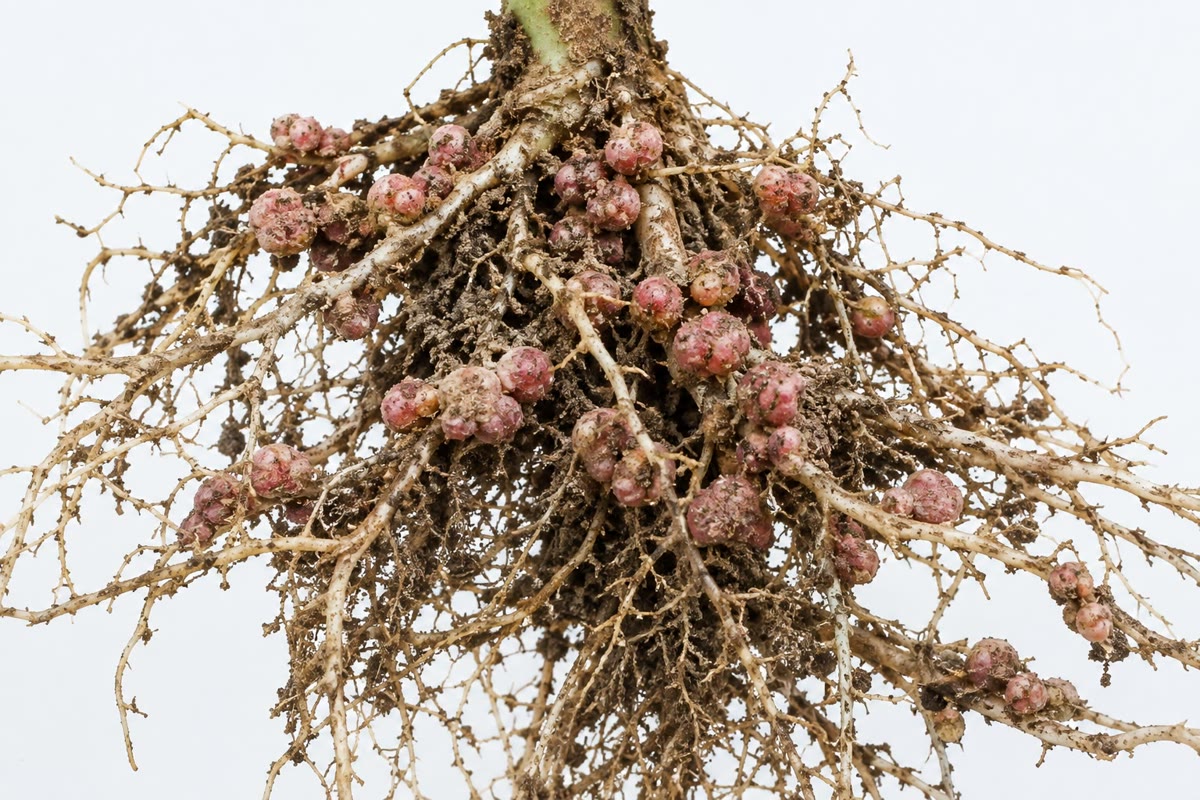
Legumes house nitrogen-fixing bacteria (rhizobia) in root nodules, organs built for the purpose after a molecular dialogue. The root secretes flavonoids; a rhizobium of the matching species answers with Nod factors — lipochitooligosaccharides whose decorations specify the partner; a receptor kinase on the root hair binds them and triggers oscillations of calcium in the nucleus, the curling of the root hair around the bacteria, and an infection thread that grows inward through the cells while the cortex below begins to divide into a nodule. The bacteria are released into the nodule cells inside membranes and differentiate into bacteroids that express nitrogenase, the enzyme that reduces N to ammonia at the cost of sixteen ATP per molecule. Nitrogenase is destroyed by oxygen, yet the bacteroids respire hard; the nodule solves the contradiction with a diffusion barrier and with leghaemoglobin, a plant haemoglobin that binds oxygen tightly and ferries it to the bacteroids at a low free concentration — it is what makes a cut nodule pink. The plant pays six to ten per cent of its photosynthate and receives most of its nitrogen; the fixed nitrogen of the world’s legume crops approaches that of the fertiliser industry.
Definition 14.9 (Mycorrhizas)
Mycorrhizas are associations of roots with fungi, found in some of plant species and in the earliest land-plant fossils. In arbuscular mycorrhizas the fungus (a Glomeromycete) enters the root cells and branches into a tree-like arbuscule across which phosphate, nitrogen and water pass to the plant and sugars and lipids to the fungus; the fungal hyphae extend the absorbing surface of the root a hundredfold and reach phosphate the root cannot. In ectomycorrhizas, of forest trees, the fungus sheathes the root and grows between the cells. The plant genes that admit the fungus are the same common symbiosis pathway — receptor, calcium spiking, transcription factors — that legumes reuse for rhizobia: the nodule is a late invention built on a fungal partnership four hundred million years older.
Proposition 14.10 (Trade and its policing)
A mutualism is an exchange, and each partner is selected to give less and take more; it persists because the other partner can retaliate. Legumes restrict oxygen to nodules whose rhizobia fix no nitrogen, halving their reproduction (Kiers, 2003): sanctions. Plants in mycorrhizal networks allocate more carbon to the fungal partners that deliver more phosphate, and the fungi more phosphate to the roots that pay more carbon — a market in which both sides reward the better trader (Kiers, 2011). Squid expel light-organ bacteria that do not glow; humans’ immune systems tolerate the commensals that stay in the lumen and attack those that cross the wall. Where a host can neither choose nor sanction — an endosymbiont inherited through the egg — the alignment of interests comes instead from shared fate: a vertically transmitted symbiont reproduces only when its host does, and selection on the symbiont favours the host’s reproduction. The mode of transmission thus predicts the character of the partnership: vertical transmission toward mutualism and dependence, horizontal transmission toward exploitation held in check by policing.
Proof. Admitted at this level. ∎
14.5 Partnerships in the sea and elsewhere
Definition 14.11 (Coral and alga)
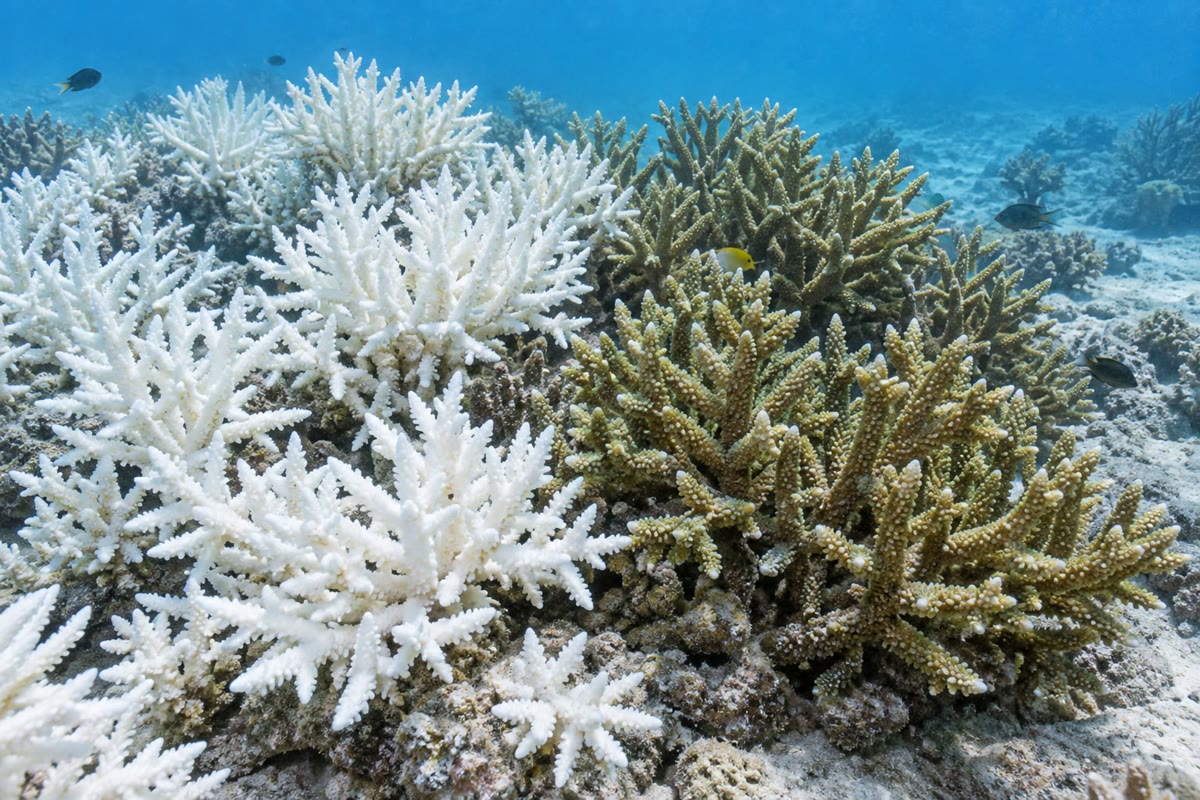
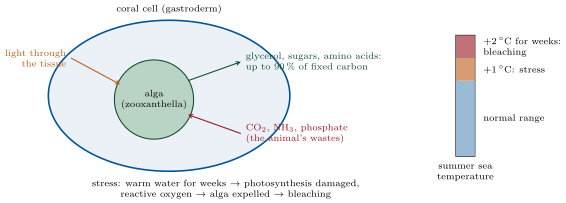
Reef-building corals house dinoflagellate algae (Symbiodiniaceae, the zooxanthellae) inside the cells of their gut lining, a million or more per square centimetre. The algae photosynthesise in the animal’s tissue, using the animal’s waste CO, ammonia and phosphate, and pass back up to of their fixed carbon as glycerol, sugars and amino acids, which feed the coral and the calcification that builds the reef; the coral, in turn, controls the algae’s nitrogen supply and hence their growth. The partnership works within a narrow thermal window: when the water stays about one to two degrees above the summer maximum for a few weeks, the algae’s photosynthesis is damaged, they release reactive oxygen into the host cells, and the coral expels them — bleaching, the white skeleton showing through the translucent animal. A bleached coral starves; it recovers if the water cools within weeks and dies if not. The frequency of bleaching has risen fivefold since 1980, and it is the mechanism by which warming is removing reefs.
Example 14.12 (Symbioses that make habitats)
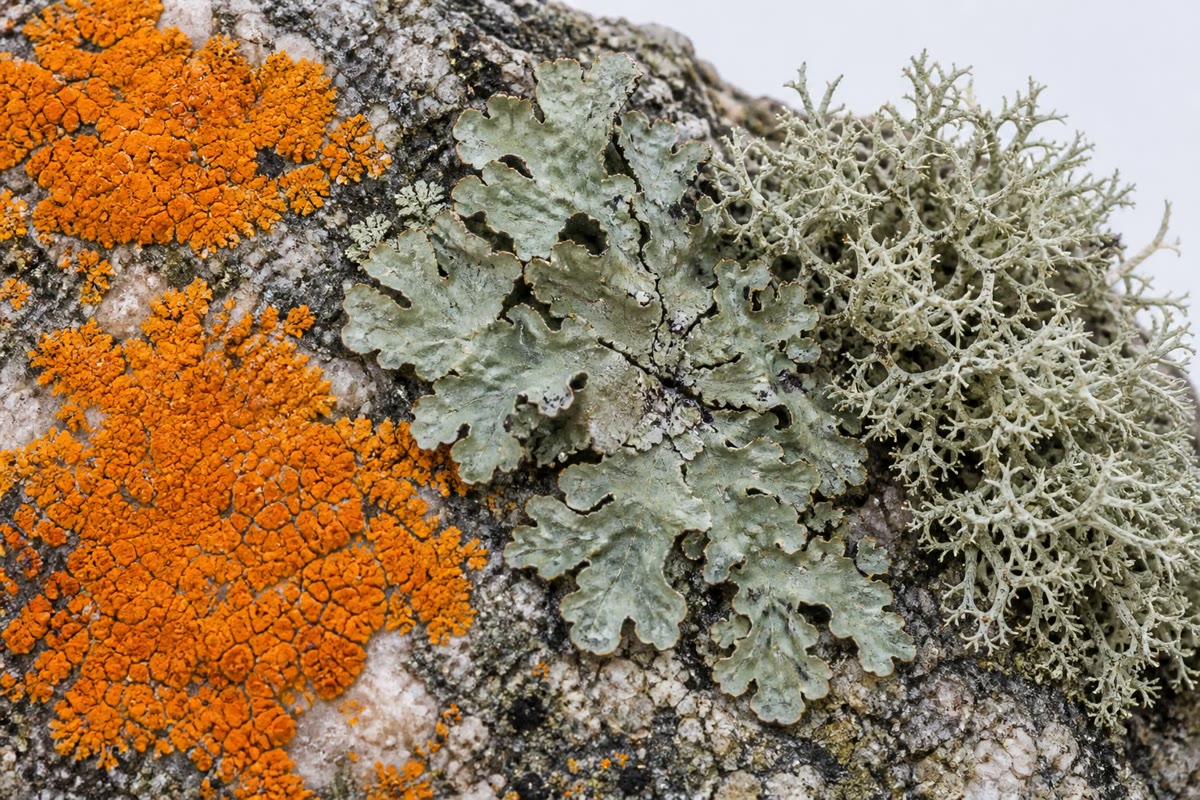
A lichen is a fungus housing a green alga or a cyanobacterium, the fungus providing structure, water retention and minerals dissolved from rock, the photobiont providing sugar (and, if a cyanobacterium, nitrogen); lichens cover about of the land surface, colonise bare rock, and begin its conversion to soil. The tube worm Riftia of the deep-sea vents has no mouth or gut as an adult; it houses sulfide-oxidising bacteria in a trophosome and delivers them sulfide and oxygen on a haemoglobin that binds both, growing at over a metre a year in the dark on chemical energy. Termites digest wood with a gut community of protists and bacteria, and ruminants digest grass with a rumen the size of a bathtub in which bacteria, archaea and fungi ferment cellulose to fatty acids and methane; the cow lives on the fatty acids and on the bodies of the microbes themselves. In every case a metabolic capacity — photosynthesis, nitrogen fixation, sulfide oxidation, cellulose digestion — that the host lineage never evolved has been acquired by partnership in one step.
14.6 From partner to organelle
Proposition 14.13 (Genome reduction and the road to the organelle)
An endosymbiont inherited through the egg lives in a population of a few cells that never recombine with outsiders. Selection on it is weak (Chapter 25: a small population fixes slightly harmful mutations by drift), genes whose products the host supplies are not missed when they break, and a lost gene is never regained. The genome therefore shrinks, generation after generation — Buchnera to , some insect symbionts to and a few hundred genes, the mitochondrion to and thirteen proteins in humans — and the host’s nucleus acquires copies of symbiont genes by endosymbiotic gene transfer, whose products are imported back with a targeting sequence. When the host makes most of the symbiont’s proteins, controls its division, and cannot live without it, the symbiont has become an organelle. Mitochondria and plastids travelled this road two billion and one billion years ago (the Year 1 volume); Paulinella’s chromatophore is a third traveller, a hundred million years along.
Remark 14.14 (The individual revisited)
An animal or plant is a community with a genome at its centre, most of whose metabolic repertoire, and much of whose development and immunity, depends on partners it did not inherit in its own DNA. The practical consequences are already here: the microbiome as a drug (faecal transplant), as a target of drugs (antibiotics’ collateral damage, dietary fibre as a prescription), as a diagnostic, and as a route — through engineered symbionts and Wolbachia-carrying mosquitoes — to changing the biology of wild populations. The theoretical one is that natural selection acts on partnerships, and that the strongest partnerships are those in which one partner’s fate is the other’s.
14.7 Exercises
Exercise 14.1 ★
Define mutualism, commensalism and parasitism, and give one example of each from this chapter. Why can one pair of species move between the categories?
Solution
Solution of Exercise 14.1.
Mutualism: both gain — legume and rhizobium, coral and alga. Commensalism: one gains, the other unaffected — most gut bacteria feeding on what the host cannot digest. Parasitism: one gains at the other’s cost — Wolbachia killing male embryos. The same pair can shift: a gut commensal that crosses the wall becomes a pathogen, a rhizobium that stops fixing becomes a parasite of the nodule, and an alga under heat stress harms the coral that housed it.
Exercise 14.2 ★
Compute , , and for a community with abundances , , , , .
Solution
Solution of Exercise 14.2.
; effective species. ; .
Exercise 14.3 ★
Contrast a 16S amplicon survey and shotgun metagenomics: what does each report, and what can each not tell you?
Solution
Solution of Exercise 14.3.
The 16S survey reports who is there, to about the genus, and their relative read counts; it says nothing about the genes they carry, misses fungi and viruses (other primers), and is biased by copy number and primers. Shotgun metagenomics reports genes, functions and, with enough depth, whole genomes and strains; it costs more per sample, is swamped by host DNA in tissue samples, and still cannot say which genes are expressed or which cells are alive.
Exercise 14.4 ★
List four services the gut microbiome provides to its host and one disease that follows its disruption.
Solution
Solution of Exercise 14.4.
Fermenting fibre to short-chain fatty acids that feed the colon and the host; synthesising vitamin K and B vitamins; transforming bile acids and drugs; colonisation resistance against pathogens; educating the immune system. Disruption: Clostridioides difficile colitis after antibiotics (also implicated: inflammatory bowel disease, obesity).
Exercise 14.5 ★★
A sample of reads holds species with . Compute for from the theorem, and Good’s coverage.
Solution
Solution of Exercise 14.5.
. Species with : ; with : ; with : ; with : . species. Coverage: one singleton, .
Exercise 14.6 ★★
The colon holds of contents at bacteria per gram; a bacterium weighs and its genome has genes; a person’s gut has species. Estimate the mass of the microbiome and the number of distinct genes it carries, and compare with the human genome’s .
Solution
Solution of Exercise 14.6.
bacteria, about . Genes: species , less overlap — of the order of distinct genes, more than a hundred times the human .
Exercise 14.7 ★★
Explain the oxygen paradox of the nodule and how leghaemoglobin and the diffusion barrier solve it. Why is a nodule pink, and what does a green nodule mean?
Solution
Solution of Exercise 14.7.
Nitrogenase is destroyed by oxygen, but the bacteroids must respire to make sixteen ATP per N. The nodule cortex forms a diffusion barrier that limits oxygen entry, and leghaemoglobin, at millimolar concentration, binds the oxygen that enters so that the free concentration stays near while the flux to the bacteroids is high. Pink is oxyleghaemoglobin; a green nodule has degraded its leghaemoglobin — it is senescent and no longer fixing.
Exercise 14.8 ★★
A legume mutant lacks the calcium-spiking component of the common symbiosis pathway. Predict its nodulation and its mycorrhization, and explain what that says about the evolution of the two symbioses.
Solution
Solution of Exercise 14.8.
Both fail: no nodules and no arbuscular mycorrhiza, because the calcium spike is the shared signal of the common symbiosis pathway. The pathway therefore predates nodulation — it was built for the fungal symbiosis four hundred million years ago and recruited by the legumes for the rhizobia later.
Exercise 14.9 ★★
Describe Kiers’s sanction experiment and what would be predicted if the plant could not distinguish fixing from non-fixing nodules.
Solution
Solution of Exercise 14.9.
Kiers exposed some soybean nodules to an atmosphere of argon and oxygen, in which the rhizobia could not fix nitrogen, while the rest of the plant’s nodules fixed normally; the plant cut the oxygen supply to the non-fixing nodules and their rhizobia reproduced about half as much. Without such discrimination, rhizobia that skipped the costly fixation would reproduce faster than fixers, spread through the population, and the plants would end by housing bacteria that gave nothing: the mutualism would collapse.
Exercise 14.10 ★★★
Prove that in the rarefaction theorem is an increasing function of and reaches at , and show that for a species with and its probability of being seen is about .
Solution
Solution of Exercise 14.10.
, each factor below ; going from to multiplies by one more factor below , so the miss probability falls and the presence probability rises with ; at the numerator is zero and every species is present, giving . For each factor is about , the product about — the sampling-with-replacement approximation.
Exercise 14.11 ★★★
Wolbachia is transmitted only through eggs. Explain why selection on it favours female hosts, describe cytoplasmic incompatibility and show why it lets an infected strain spread even if infection carries a small cost.
Solution
Solution of Exercise 14.11.
A male is a dead end for a symbiont that travels only in eggs, so any trait that turns males into females, kills them in favour of their sisters, or handicaps uninfected females raises the symbiont’s transmission. Cytoplasmic incompatibility: sperm of infected males are modified so that the zygote dies unless the egg carries the same Wolbachia, which rescues it. Uninfected females therefore lose the offspring they conceive with infected males, while infected females lose none; the advantage grows with the infection frequency, so above a threshold the infection spreads to fixation even if infected females lay slightly fewer eggs — the cost is outweighed by the fraction of uninfected females’ broods destroyed.
Exercise 14.12 ★★★
Using Proposition 14.13, explain why the genomes of vertically transmitted endosymbionts shrink but those of free-living relatives do not, which genes are lost first and which last, and what would reverse the trend.
Solution
Solution of Exercise 14.12.
The endosymbiont passes through a bottleneck of a few cells at each host generation and never recombines with outsiders: drift fixes slightly deleterious mutations, deletions included, and there is no source of replacement genes (Muller’s ratchet). Genes whose products the host supplies, or that serve a free life — envelope, motility, regulation, most repair — are not missed and go first; the translation machinery and the genes that make what the host needs (essential amino acids in Buchnera) are kept longest. Free-living relatives have huge populations, recombination and gene influx, and selection maintains their genomes. Reversal needs new genes from outside — impossible in isolation — so hosts instead replace an eroded symbiont with a fresh one, as several insect lineages have done.
14.8 Problem: The Census of a Gut
Problem 14.1
Weekend problem — a gut microbiome counted in cells, genes and calories, its diversity measured and rarefied, a legume’s nitrogen budget balanced against its sugar, and a reef’s carbon accounted for, ending on the calories a microbiome earns, the coverage of a sequencing sample and the sugar a field of beans pays for its nitrogen
Data: colon contents at bacteria per gram, cell mass ; species, genes each, of genes shared between any two species. Diet: of fibre a day, fermented to short-chain fatty acids at per gram, each worth ; a diet of . A sequencing sample: reads, species, singletons; abundances of the top three species , , , the rest evenly spread. A bean crop fixes of N per hectare per season and pays of sugar per gram of N fixed; its photosynthesis yields of sugar per hectare per season. Nitrogenase: ATP per N. A coral: algae per cm, each fixing of carbon a day, passed to the host; the coral tissue respires of carbon per cm per day.
Part I — Cells and genes.
- How many bacteria in the colon, and what do they weigh?
- How many bacterial genomes’ worth of DNA is that, and how does the total compare with the DNA in the human cells ( each)?
- Estimate the number of distinct bacterial genes in the gut, allowing for the overlap (count each species’ unshared plus one shared set). Compare with .
- How many millimoles of short-chain fatty acids does the fibre yield per day, how many kilojoules, and what fraction of the diet?
- A germ-free mouse needs more food. Is the fatty-acid contribution of question 4 enough to explain that? What else might?
- Bacteria divide in the colon about once a day and the contents are voided at the same rate. What steady state does that imply, and what happens to the community when a course of antibiotics kills of the cells?
Part II — Diversity.
- Compute the relative abundance of each of the minor species, then the Shannon index and .
- Compute the Simpson index and . Why is smaller than ?
- Good’s coverage of the sample; how many reads belong to unseen species per thousand?
- A second sample of reads from the same gut yields species. Explain, using the rarefaction theorem, why this is not a contradiction, and what to do before comparing the two.
- In the theorem, what is the probability that a species with appears in a subsample of from ? With ?
- After antibiotics the same gut shows species, , and one species at abundance . Compute and and describe the community in words.
Part III — The nodule’s account.
- How much sugar does the crop pay per hectare for its of N, and what fraction of its photosynthesis is that?
- How many moles of N is of N, and how many moles of ATP does nitrogenase spend on it?
- At ATP per glucose respired, how many kilograms of glucose does that ATP represent? Compare with the sugar paid; what is the rest for?
- Industrial ammonia costs about per kg of N. Using per gram of sugar, compare the energy cost of the crop’s nitrogen with the factory’s.
- A non-fixing rhizobium enters a nodule. If the plant sanctions it by halving its oxygen, and its reproduction falls by half, what fraction of the next season’s rhizobia are cheaters if they began at and fixers reproduce normally? (One round.)
- Without sanctions, cheaters that save the cost of fixing reproduce more. Over ten seasons, what fraction are cheaters, from the same start? What does the comparison show?
Part IV — The reef’s account.
- How much carbon do the algae of one square centimetre fix per day, and how much reaches the coral?
- Compare with the coral’s respiration. What is the surplus, and what is it used for?
- After bleaching, of the algae are gone. Recompute the carbon supplied. How long can the coral last on reserves of of carbon per cm?
- The stress is often measured in degree-heating-weeks: the sum, over the season, of the weekly excess above the summer maximum. Eight weeks at or four at both give ; bleaching begins near . Which of the two profiles is worse, and why might the metric nevertheless work?
- Corals can host several algal species with different thermal limits. Propose how a reef might adapt, and what limits that.
- A reef of of living coral surface: how much carbon do its algae fix per day and per year, in tonnes?
- Summarise: the fraction of the diet supplied by the microbiome (question 4), the coverage of the sequencing sample (question 9), and the fraction of photosynthesis a bean crop pays for its nitrogen (question 13).
Solution
Solution of Problem 14.1.
1. bacteria, . 2. A -gene genome is about , : of bacterial DNA, against of human DNA — about equal. 3. distinct genes, some times the human genome’s. 4. ; ; of the diet. 5. No — does not explain . Germ-free mice also absorb less efficiently, have altered gut hormones, fat storage and thermogenesis, and different appetite: the microbiome acts on the host’s physiology, not only as a fuel supplier. 6. Division balanced by voiding: a steady population, each cell replaced daily. After a kill, remain and ten doublings restore the numbers within about ten days — but the survivors and the fastest growers dominate, the composition is changed (a dysbiosis), and in the gap an invader such as C. difficile can establish. 7. Minor species share over : each. ; . 8. ; . The Simpson index squares the abundances, so the three dominant species decide it and the rare ones hardly count; Shannon gives rare species more weight. 9. : about reads per thousand belong to species not yet seen. 10. Richness rises with sample size while rare species keep appearing; reads reach species that miss. Rarefy the large sample to reads with the theorem (or by subsampling) — it should give about if it is the same community — and compare at equal depth. 11. : . : about . 12. effective species; , about : a community with one dominant species and a few dozen minor ones — the collapsed, low-diversity gut in which C. difficile takes hold. 13. of sugar per hectare, of the photosynthesised. 14. mol of N; mol of ATP. 15. mol of glucose, — about of the sugar paid. The rest builds and maintains the nodules and bacteroids, supplies the eight electrons per N as reductant, and assimilates the ammonia. 16. for of N: , nearly four times the factory’s — but paid in sunlight, in the field, with no fuel. 17. Fixers ; cheaters ; cheaters are — halved in one season. 18. Cheaters against fixers : after ten seasons, rising toward domination. Sanctions turn selection against the cheater; without them the mutualism erodes. 19. of carbon per cm per day; to the coral. 20. Respiration : surplus per cm per day for growth, the organic matrix of calcification, mucus and gametes. 21. With of the algae, a day against respired: a deficit of a day; of reserves last about three weeks. 22. Four weeks at is worse: the damage to the algae’s photosystems rises steeply, not linearly, with temperature. The metric nevertheless works as a warning because bleaching integrates cumulative stress and the two profiles differ by less than the uncertainty in the threshold; it is an empirical index, calibrated on observed bleaching. 23. A stressed coral can shuffle toward more heat-tolerant algal species already present at low abundance, or acquire them from the water after bleaching; the tolerant algae give less carbon, so the coral grows more slowly, and the tolerance gained is one or two degrees — less than the warming projected — while the pace of warming outruns the corals’ own adaptation. 24. cm of carbon a day, about a year. 25. About of the diet from the microbiome’s fermentation; coverage of the sequencing sample; of photosynthesis paid for the bean crop’s nitrogen.