High School Earth and Space Sciences · Grades 10–12
11Seismic Waves Reveal the Interior
On 8 October 1909 an earthquake shook the valley of the Kupa river, about south-east of Zagreb, in Croatia. A few months earlier, Andrija Mohorovičić had installed a new seismograph at the Zagreb Meteorological Observatory, and it recorded the whole event. He then asked other observatories for their records and gathered those of 41 stations. On the records of the more distant stations he found something unexpected: two separate P waves, a weak one and then a stronger one, where there should have been one. From that pair of waves he deduced that the rock beneath the crust is different, and he measured the depth of the boundary. This chapter shows how the times at which earthquake waves arrive reveal the layers of the Earth: the base of the crust, the core and its liquid outer part, and the whole interior, depth by depth.
You already know
An earthquake starts at a point inside the Earth, the focus; the point of the surface right above it is the epicentre. A seismometer records the shaking of the ground, and the magnitude measures the size of an earthquake (Book 1, grade 7). The Earth has a crust, a mantle and a core; the core has a liquid outer part and a solid inner part. Earthquake waves are of two main kinds, the faster P waves and the slower S waves, and S waves cannot cross a liquid (Book 1, grade 6). A wave that crosses the boundary between two materials in which it travels at the speeds and is refracted: , where the angles are measured from the perpendicular to the boundary (Snell’s law; the physics books).
11.1 Seismic waves and travel times
11.1.1 Two kinds of body waves
An earthquake sends waves in all directions. Some travel along the surface; others, the body waves, travel through the inside of the Earth, and they are the ones that reveal it.
Definition 11.1 (P wave; S wave)
A P wave is a seismic wave that alternately compresses and stretches the rock: the rock moves back and forth along the direction in which the wave travels. It crosses solids, liquids and gases, and it is the fastest seismic wave, so it arrives first. An S wave shears the rock: the rock moves at right angles to the direction in which the wave travels. It crosses only solids, and it arrives after the P wave.
A liquid flows and offers no resistance to a change of shape, so it cannot pass a shear on: this is why S waves stop at the surface of a liquid. In most rocks a P wave travels about times as fast as an S wave. In the upper crust a P wave travels at about and an S wave at about ; just below the crust they reach about and .

11.1.2 Travel-time curves
The distance from an earthquake to a station far away is measured as an angle: the angle at the centre of the Earth between the epicentre and the station, the epicentral distance. One degree of it is along the surface.
Definition 11.2 (Travel time; travel-time curve)
The travel time of a seismic wave at a station is the time it takes to go from the focus to the station. The travel-time curve of a wave is the graph of its travel time against the epicentral distance of the station.
A station records the time at which each wave arrives; when the time of the earthquake is known, the difference is the travel time. Thousands of earthquakes recorded by thousands of stations have given the travel-time curves very precisely. In the figure, the curves are computed from the reference Earth model of Section 11.4, and the points are travel times observed in real earthquakes: the two agree to within two per cent everywhere, and most often to within one or two seconds.
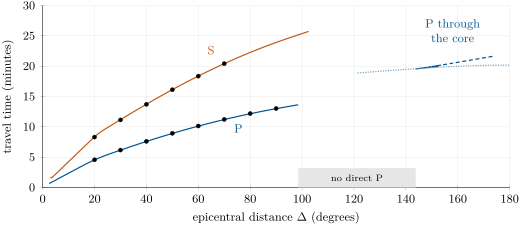
The S curve rises more steeply than the P curve, so the delay between the two arrivals grows with distance. This gives the distance of an earthquake from a single record.
Method 11.3 (Distance of an earthquake from the S–P delay)
- On the record, read the time of the first P wave and of the first S wave; their difference is the S–P delay.
- On the travel-time curves (or in a table of them), find the epicentral distance at which the S curve lies that delay above the P curve.
- Convert to kilometres, if needed, with per degree.
With three stations, the epicentre is the point at the right distance from all three.
Example 11.4 (An earthquake away)
Observed travel times are for P and for S at , and at . A station that records an S wave (8 minutes 13 seconds) after the P wave therefore lies from the epicentre: about . At the delay would only be .
11.2 Refraction and the Moho
11.2.1 The wave that runs along a boundary
Inside the Earth the speed of seismic waves changes with depth, mostly gradually, but in places all at once.
Definition 11.5 (Seismic discontinuity)
A seismic discontinuity is a surface inside the Earth across which the speed of seismic waves changes suddenly — over a thickness much smaller than the length of the waves.
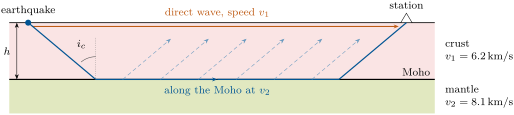
At a discontinuity, part of a wave is reflected and part is refracted. Take a layer of thickness in which P waves travel at , on top of a layer in which they are faster, . A ray going down at the angle from the vertical is refracted at the angle given by : it is bent away from the vertical. When reaches , the refracted ray runs exactly along the boundary. The angle
is the critical angle. The wave refracted at the critical angle travels along the top of the faster layer at the speed , and as it goes it sends waves back up into the upper layer, all at the angle : they reach the surface as the head wave.
Proposition 11.6 (Travel time of the head wave)
For a source at the surface, a station at the distance receives the head wave after
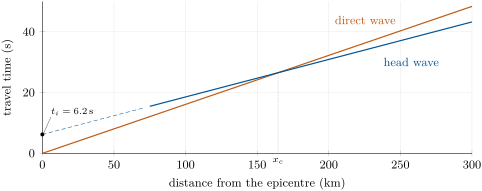
Its travel-time curve is a straight line of slope which, extended back, cuts the time axis at the intercept time .
Proof. The ray goes down a slanted leg of length , which advances horizontally by ; it does the same on the way up. In between it runs along the boundary for . The time is
Since , the last two terms make . ∎
The direct wave arrives after : its curve is a line through the origin, steeper than the head-wave line. Near the source the direct wave comes first; far away, the head wave, which has run most of the way at the higher speed, overtakes it.
Proposition 11.7 (Crossover distance)
The head wave arrives before the direct wave beyond the crossover distance
Proof. The two arrive together when , that is , so . Now , hence . Beyond it the head wave, whose line is less steep, arrives first. ∎
11.2.2 The base of the crust
Definition 11.8 (Moho)
The Mohorovičić discontinuity, or Moho, is the seismic discontinuity at the base of the crust, where the speed of P waves jumps from at most about to about , the speed in the uppermost mantle.
History — Mohorovičić and the two P waves, 1909
Andrija Mohorovičić (1857–1936) found, on the records of the 1909 earthquake, that beyond a certain distance — in general between 100 and — a weak, faster P wave arrived before the strong P wave. He explained it as a wave that had travelled through faster rock beneath the crust. He named the two waves Pg (the direct wave in the crust) and Pn (the head wave along the top of the mantle), did the same for S waves, and deduced the speeds of both layers and the depth of the boundary between them. The Pn wave travels at about , the speed of the uppermost mantle. His papers of 1910 proved that the crust and the mantle are different; the boundary carries his name.
Method 11.9 (Depth of the Moho from a travel-time diagram)
- Plot the first arrival times against the distance from the epicentre.
- Draw the line of the direct wave (through the origin) and the line of the head wave; their slopes are and .
- Extend the head-wave line back to the time axis: it cuts it at the intercept time .
- With , the thickness of the crust is .
Example 11.10 (A crust thick)
With and , , and . An intercept time of gives . The head wave first reaches the surface at and overtakes the direct wave beyond .
Measured in this way all over the world, the Moho lies only about below the floor of the oceans. Under the continents it lies about down on average: about where the crust has been stretched, more than under mountain belts, and down to about under the highest ranges. The crust is a thin skin: even is less than one per cent of the Earth’s radius.
11.3 The core
11.3.1 Rays that curve
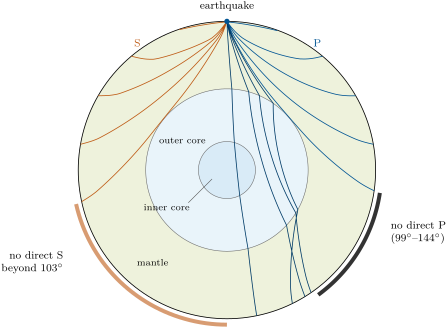
In the mantle, the speed of seismic waves increases with depth. A ray that goes down crosses faster and faster rock and, by Snell’s law, is bent a little more away from the vertical at each step: its path curves and turns back up towards the surface. The deeper a ray turns, the farther from the earthquake it comes back up. The figure shows such rays, computed with the speeds of the reference Earth model.
11.3.2 The shadow zone and the liquid outer core
In 1906, the seismologist Oldham noticed that P waves recorded on the far side of the Earth from an earthquake arrived late compared with the times expected, and proposed a central core in which they travel more slowly. In 1912 Gutenberg showed that P waves do not reach a whole band of distances, between about and , with strong arrivals just beyond ; in 1914 he placed the top of the core down.
Definition 11.11 (Shadow zone)
The shadow zone of a seismic wave is the range of epicentral distances that the wave cannot reach directly from an earthquake, because the core bends it away or stops it.
The rays explain it. The P rays that turn just above the core come back up about from the earthquake. A ray that goes a little steeper enters the core, where the P speed drops suddenly from to about : by Snell’s law it is bent towards the vertical, crosses the core and emerges much farther away, beyond about . No P ray turning in the mantle and no P ray crossing the core lands in between. In the reference model the P shadow zone runs from to , close to Gutenberg’s –.
S waves tell more. No S wave crosses the outer core: the outer core does not carry shear waves, so it is liquid. As a result, no S wave arrives directly beyond about in the reference model — on the whole far side of the Earth.
Definition 11.12 (Core–mantle boundary; inner-core boundary)
The core–mantle boundary is the seismic discontinuity between the solid mantle and the liquid outer core, at a depth of ; there the P speed drops from about to about , and S waves stop. The inner-core boundary, at a depth of , separates the liquid outer core from the solid inner core; there the P speed jumps from about to about .
The shadow zone is not completely silent: weak P waves arrive in it. Inge Lehmann explained them in 1936 with a solid inner core in which P waves travel faster (Book 1, grade 6). The rays show how. A P ray that reaches the inner core is bent away from the vertical where the speed jumps up, as at the Moho, and comes back out of the core sooner: in the reference model, rays through the inner core reach the surface from about on, inside the shadow zone (dotted curve of the travel-time figure).
11.4 A reference Earth model
Put together, millions of travel times give the speed of P and S waves at every depth. Their speeds depend on the rock and on its density, and the total mass of the Earth fixes its average density; together they give the density at every depth too.
Definition 11.13 (Reference Earth model)
A reference Earth model is a table of the speed of P waves, the speed of S waves and the density against depth, the same in every direction, chosen to agree with the observed travel times of seismic waves and with the mass of the Earth.
The most used is the Preliminary Reference Earth Model (PREM), published by A. M. Dziewonski and D. L. Anderson in 1981. The rays and travel times of this chapter were computed with it: the P travel time at , for instance, comes out at , against observed.
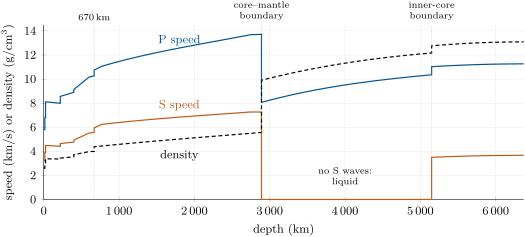
Reading the model from the top:
- the crust, with P speeds of 5.8 to , ends at the Moho ( in this average model);
- in the mantle, the speeds rise with depth, with smaller sudden steps, the largest near and ;
- at , the S speed falls to zero and the P speed drops by more than : the liquid outer core;
- at , S waves exist again: the solid inner core, in radius.
The density rises from in the crust to at the base of the mantle, then jumps to at the top of the core and reaches at the centre. The mean density of the whole model is , twice that of the rocks of the crust: the deep interior, and the core above all, is made of much denser material than the surface. The core holds about one third of the Earth’s mass.
11.5 Exercises
Exercise 11.1 ★
Give two differences between P waves and S waves. Which one is recorded first by a seismometer, and why?
Solution
Solution of Exercise 11.1.
A P wave compresses and stretches the rock, which moves along the direction of travel; an S wave shears it, and the rock moves at right angles to that direction. P waves cross solids and liquids; S waves cross only solids. The P wave is recorded first, because it is the faster of the two.
Exercise 11.2 ★
A station lies from an epicentre. How far is it, measured along the surface? How many degrees away is a station from an epicentre?
Solution
Solution of Exercise 11.2.
, about . .
Exercise 11.3 ★
The observed travel times at are for P and for S. Convert them to minutes and seconds, and give the S–P delay.
Solution
Solution of Exercise 11.3.
is 7 minutes 36 seconds; is 13 minutes 42 seconds. The S–P delay is , that is 6 minutes 6 seconds.
Exercise 11.4 ★
A crust in which P waves travel at lies on a mantle where they travel at . Compute the critical angle.
Solution
Solution of Exercise 11.4.
, so .
Exercise 11.5 ★
In the reference model the core–mantle boundary lies deep and the inner-core boundary deep; the Earth’s radius is . Compute the thickness of the outer core, the radius of the core, and the core’s radius as a fraction of the Earth’s radius.
Solution
Solution of Exercise 11.5.
The outer core is thick. The core’s radius is , and : a little more than half the Earth’s radius.
Exercise 11.6 ★★
Observed S–P delays are at , at , at , at and at . A station records an S wave 6 minutes 6 seconds after the P wave. How far is the earthquake, in degrees and in kilometres? Why can a single station not tell where the earthquake is?
Solution
Solution of Exercise 11.6.
6 minutes 6 seconds is : the earthquake is away, that is . A single delay gives only the distance: the epicentre can be anywhere on a circle of that radius around the station. Two more stations are needed to find the one point at the right distance from all three.
Exercise 11.7 ★★
With the speeds of Exercise 11.4 and a crust thick, compute the travel times of the direct wave and of the head wave at a station from the epicentre. Which arrives first?
Exercise 11.8 ★★
For the crust of Exercise 11.7, compute the critical distance and the crossover distance. Check that the answer to Exercise 11.7 agrees.
Solution
Solution of Exercise 11.8.
: the critical distance is . The crossover distance is . The station of Exercise 11.7 lies at , beyond the crossover: the head wave arrives first, as found.
Exercise 11.9 ★★
Under an ocean, a crust thick, in which P waves travel at , lies on a mantle at . Compute the critical angle, the intercept time and the crossover distance. Why must the stations be much closer together to find the Moho beneath an ocean than beneath a continent?
Solution
Solution of Exercise 11.9.
, and . Intercept time: . Crossover distance: . Under a continent the crossover lies near , so stations a few tens of kilometres apart catch both lines; under the ocean the head wave already arrives first beyond about , and the direct-wave line is only a few tens of kilometres long: the stations must be a few kilometres apart to draw it.
Exercise 11.10 ★★
A P ray in the lowest mantle, where it travels at , meets the core–mantle boundary at from the perpendicular. Below the boundary the P speed is . Compute the angle of the refracted ray. Is the ray bent towards the perpendicular or away from it? Use this to explain why P rays that enter the core emerge far from the earthquake.
Solution
Solution of Exercise 11.10.
, so : the ray is bent towards the perpendicular, that is towards the centre of the Earth. It therefore crosses the core along a long path close to its middle, and comes back out far round the other side: P rays that enter the core emerge much farther from the earthquake than the rays that just miss it.
Exercise 11.11 ★★
In the reference model, a P wave going straight down through the centre takes to reach the opposite point of the Earth. How long would it take if it travelled the whole diameter () at , the P speed at the base of the mantle? What did Oldham conclude from such delays?
Solution
Solution of Exercise 11.11.
, about 15.5 minutes, whereas the wave takes , about 20 minutes: it is some 280 seconds late. Even at the highest speed of the mantle the wave would arrive much earlier, so the middle of the Earth must slow it down. Oldham concluded that the Earth has a central core in which P waves travel more slowly than in the mantle.
Exercise 11.12 ★★★
(1) From Proposition 11.6, show that the thickness of the crust is
(2) Apply it to , and .
Solution
Solution of Exercise 11.12.
(1) By the proposition, , and . So
(2) .
Exercise 11.13 ★★★
The mean density of the Earth is . Treat the Earth as a core of radius and uniform density , inside a mantle and crust of uniform density (the mean of the reference model). (1) What fraction of the Earth’s volume is the core? (2) Compute . (3) Compare with the density at the top of the core in the reference model, , and with the density of the crust.
Solution
Solution of Exercise 11.13.
(1) : the core is about of the volume. (2) The mean density is the volume-weighted mean: , so . (3) This is more than , as it should be, since the density of the core increases towards the centre (to ); it is about four times the density of the crust, . The core is made of much denser material than the rocks of the surface.
Exercise 11.14 ★★★
Gutenberg’s P shadow zone extends from to . (1) Give its limits in kilometres along the surface. (2) On a sphere, the area between the angular distances and from a point is the fraction of the whole surface. What fraction of the Earth’s surface receives no direct P wave from a given earthquake? (3) Why does every earthquake have its own shadow zone?
Solution
Solution of Exercise 11.14.
(1) and . (2) : about of the surface, a ring around the point opposite the earthquake. (3) The shadow zone is a range of distances from the epicentre: it moves with the earthquake. Each earthquake has its own ring.
Exercise 11.15 ★★★
Under a high mountain range, a refraction survey finds , and an intercept time of . (1) Compute the thickness of the crust there. (2) What intercept time would a crust thick with the same speeds give? (3) Compare with the average thickness of the continental crust.
Solution
Solution of Exercise 11.15.
(1) . (2) , , and . (3) The crust under the range is about thick, thicker than the continental average of about and close to the average of mountain belts: high ranges stand on thick crust.
11.6 Problem: Finding the Moho
Problem 11.1
Weekend problem — the depth of the crust from fifteen stations
A small earthquake occurs at a very shallow depth beneath a continent. Fifteen stations set out on a straight line from the epicentre record the arrival times of the first P wave and, where they can be read, of a second one. The readings below are invented, but computed as a real survey would find them, to the nearest tenth of a second. Pg is the wave that travels through the crust, Pn the one that has run along the top of the mantle.
| distance () | Pg () | Pn () | distance () | Pg () | Pn () |
|---|---|---|---|---|---|
| 20 | 3.3 | — | 180 | 29.0 | 28.5 |
| 40 | 6.5 | — | 200 | 32.3 | 30.9 |
| 60 | 9.7 | — | 220 | — | 33.3 |
| 80 | 12.8 | 16.2 | 240 | — | 35.8 |
| 100 | 16.1 | 18.6 | 260 | — | 38.3 |
| 120 | 19.3 | 21.1 | 280 | — | 40.8 |
| 140 | 22.6 | 23.6 | 300 | — | 43.2 |
| 160 | 25.8 | 26.0 |
Part I — The direct wave.
- On graph paper, plot the Pg and Pn times against distance ( for and for ). How do the Pg points lie?
- Why does the Pg line pass close to the origin?
- Using the stations at 20 and , compute the slope of the Pg line in seconds per kilometre.
- Deduce the speed of P waves in the crust.
- If the crust continued, when would the Pg wave reach the station at ?
Part II — The refracted wave.
- Using the stations at 100 and , compute the slope of the Pn line and the speed of P waves beneath the crust.
- Compare with the speed of the Pn wave that Mohorovičić measured, about . What rock lies beneath the crust?
- Compute the critical angle .
- No station closer than records a Pn wave. Using Proposition 11.6, explain why there is a smallest distance at which the head wave can be recorded.
- Between 80 and , Pn arrives after Pg. Why is it still recorded?
Part III — The crossover.
- From the table, between which two stations does the first wave to arrive change from Pg to Pn?
- Write the equations of the two lines, using the points at (Pg) and (Pn).
- Compute the distance at which the two lines cross.
- Beyond no station records Pg as a separate wave. Which wave does a station at record first, and when?
Part IV — The depth of the Moho.
- Extend the Pn line back to the time axis: what is the intercept time ?
- Compute , and the thickness of the crust by Method 11.9.
- Check: with this , compute the crossover distance with Proposition 11.7 and compare with question 13.
- Check again: compute the critical distance and compare with the nearest station that records Pn.
- The seismologists give to the nearest few kilometres only. Why is a finer value not justified?
- Conclude: at what depth does the Moho lie beneath this region? Is the crust here thin or thick for a continent?
Solution
Solution of Problem 11.1.
1. The Pg points lie on a straight line; the Pn points lie on another straight line, less steep.
2. The earthquake is at a very shallow depth beneath the epicentre: a station at distance zero would record the wave at once.
3. per kilometre.
4. .
5. .
6. per kilometre, so .
7. It is close to : beneath the crust lies the rock of the uppermost mantle.
8. , so .
9. The head wave goes down at the angle and comes back up at the same angle. The first point where it can return to the surface lies beyond the point where it reached the Moho, itself from the source: no station closer than can receive it.
10. A seismometer records every wave that reaches it, not only the first; the Pn wave arrives after the Pg wave but is still seen as a separate wave on the record.
11. At , Pg () comes before Pn (); at , Pn () comes before Pg (). The change happens between these two stations.
12. Pg: . Pn: ( in kilometres, in seconds).
13. gives .
14. Pn, after .
15. .
16. , so .
17. , within of the of question 13.
18. : . The nearest station that records Pn is at , and the one at does not: the two agree.
19. The times are read to , and an error of on alone changes by about ; the speeds, taken from slopes, are uncertain too, and the earthquake was not exactly at the surface. The crust is also not perfectly uniform. A precision of a kilometre or two is the most the data allow.
20. The Moho lies about beneath this region: the crust here is on the thin side for a continent, whose crust averages about ; is typical of regions where the crust has been stretched.