High School Earth and Space Sciences · Grades 10–12
8Drainage Basins, Rivers and Floods
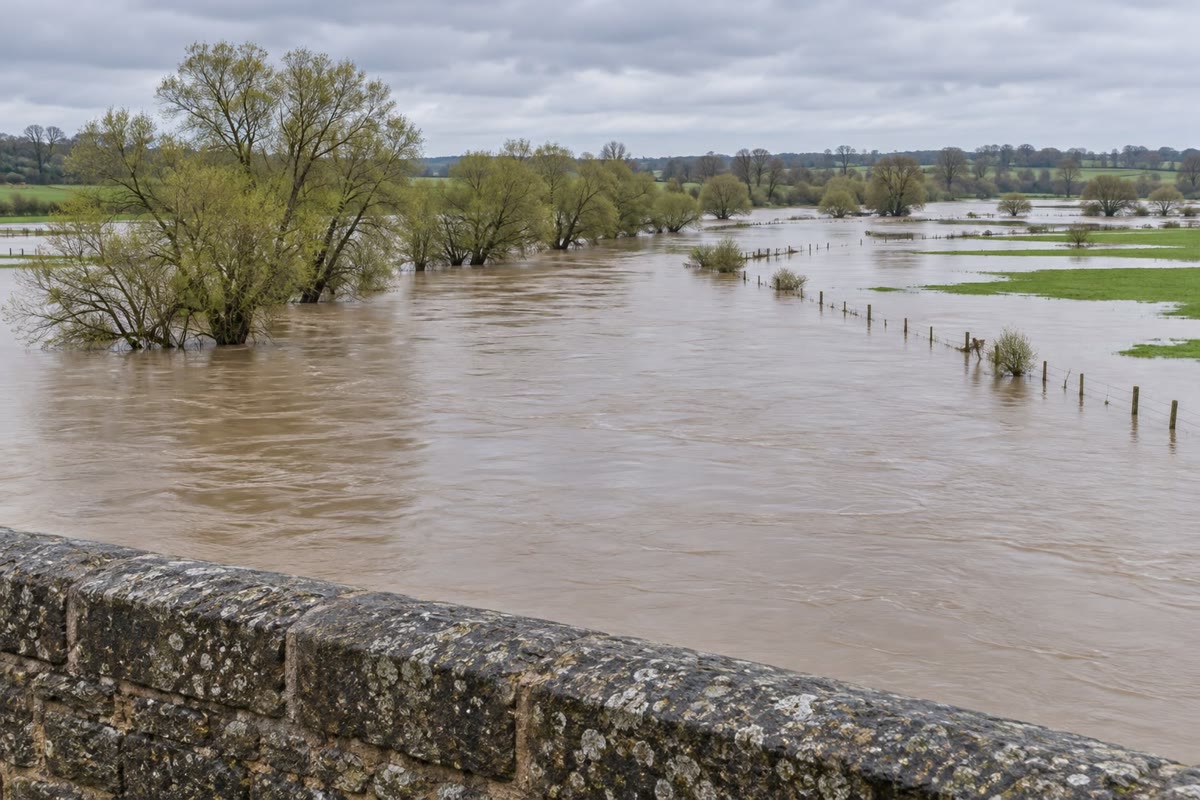
A river can rise two days after the rain has stopped, at a town where no rain fell at all. The water that floods its streets fell earlier, on hills far upstream; it ran down their slopes into streams, and the streams joined into the river that brought it, all at once, to the town. To understand a flood, one must look beyond the river to the whole area that feeds it, and follow the water through it. This chapter defines that area, the drainage basin; measures what a river carries, its discharge; follows a flood as it passes a point of the river; and shows how a long record of floods tells how often a given flood comes back.
You already know
Rain that reaches the ground soaks into it, runs off its surface, or evaporates; the water cycle carries it back to the sea (the physics books). Water soaks into permeable rocks and fills them below the water table, forming aquifers that feed springs and rivers (Book 1, grade 6). A river winds in meanders across its flat floodplain, which it covers when it floods (Book 1, grade 5). Contour lines join points of equal height; the Varden Hills are the region drawn on the maps of this series (Book 1, grades 2 and 9).
Safety
Flood water is far more dangerous than it looks. About of fast-moving water can knock an adult over, and about can carry a car away; the road under it may have collapsed. Never walk or drive into flood water: turn around and go another way.
8.1 The drainage basin
Every drop of rain that does not evaporate or soak in deeply runs downhill. It follows the steepest slope of the ground, joins a rill, then a stream, and the streams join into rivers. All the land whose water ends in the same river forms one unit.
Definition 8.1 (Drainage basin; drainage divide)
The drainage basin of a point of a river is the whole area of land whose runoff flows to the river upstream of that point and passes that point. The drainage divide is the line that separates two neighbouring drainage basins: it follows the crests of the land, and the rain falling on either side of it flows to different rivers.
A basin is always defined for a point of the river, its outlet: the basin of a river where it reaches the sea is the largest, and every point upstream has a smaller basin inside it. Two drops falling a metre apart, on either side of a divide, can end in different rivers and even in different oceans.
The basin of the Varden river
A computer finds a drainage basin from a map of heights in a few steps. The map is cut into small squares, on a side here. For each square, the computer looks at its eight neighbours and sends the water to the one reached by the steepest downward slope. (Where a small hollow has no lower neighbour, it is first filled up to the level at which it would overflow, as a puddle does.) Following these steps from square to square traces the path of a drop from anywhere on the map. The squares whose drops reach the river form the basin.
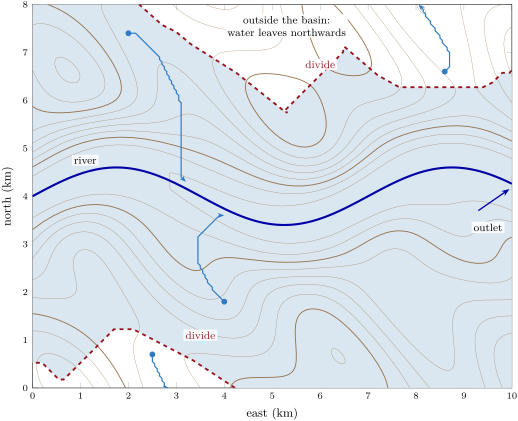
The basin covers of the of the map, about four-fifths of it. In the north the divide follows the crests of the hills and passes over their summits; beyond them the land slopes away from the river and its water flows to another valley. In the south-west corner a small area also drains off the map. The river itself enters the map from the west, so its full basin is larger: it also takes in the land upstream, beyond the edge of the map.
The largest rivers
Rivers are compared by the area of their basin and by the water they carry. The largest river in the world by far is the Amazon. The Mississippi, the largest river of the United States, drains about square miles, about 2.98 million , from the United States and Canada.
8.2 Discharge
Definition 8.2 (Discharge)
The discharge of a river at a point is the volume of water that passes through a cross-section of the river in one second. It is measured in cubic metres per second, .
A discharge of is a thousand litres every second, or a day. The water flows fastest near the surface in the middle of the channel and slowest along its bed and banks, where it rubs against them; the mean velocity is the velocity averaged over the whole cross-section.
Proposition 8.3 (Discharge, velocity and cross-section)
The discharge of a river is the product of the mean velocity of the water and the area of the wetted cross-section:
Proof. In a time , the water that crosses the section has moved forward by a distance : it fills a slab of the river of cross-section and length , of volume . Dividing this volume by the time gives the volume per second, . ∎
A river with a cross-section of flowing at a mean velocity of carries . In flood, both factors grow: the water deepens and widens, so the cross-section grows, and it flows faster.
Measuring a discharge
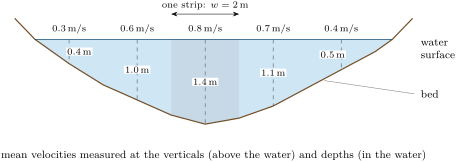
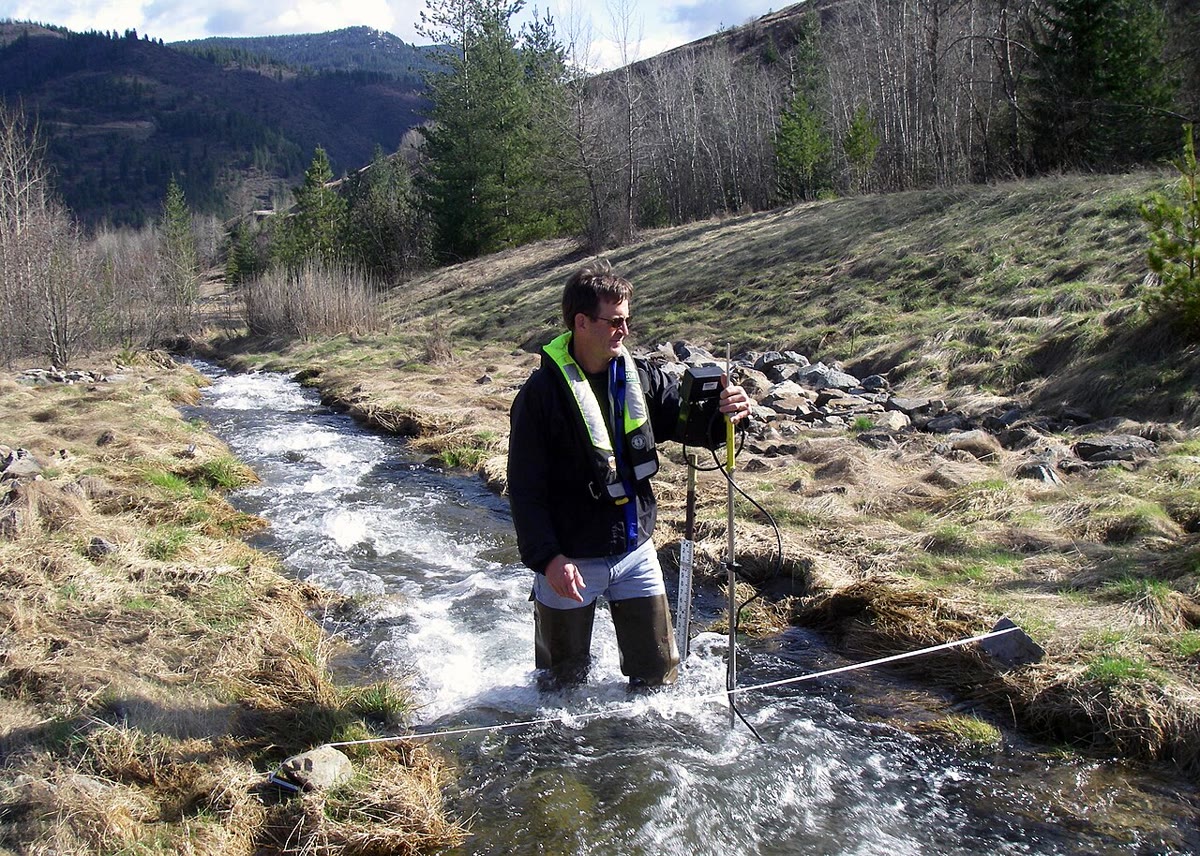
Since the velocity changes across the river, it is measured at several points. The river is cut into vertical strips; in each, the depth and the velocity are measured, and the discharges of the strips are added.
Method 8.4 (The velocity–area method)
- Stretch a measuring tape across the river and choose verticals at regular spacings along it.
- At each vertical, measure the depth and the mean velocity of the water over that depth with a current meter.
- Each vertical stands for a strip of width and area ; its discharge is .
- Add the discharges of all the strips: . The cross-section is and the mean velocity .
Example 8.5 (A gauging)
In the stream of the figure, the five strips, each wide, have areas , , , and : the cross-section is . Their discharges are , , , and , so the stream carries . The mean velocity is , less than the of the middle of the stream.
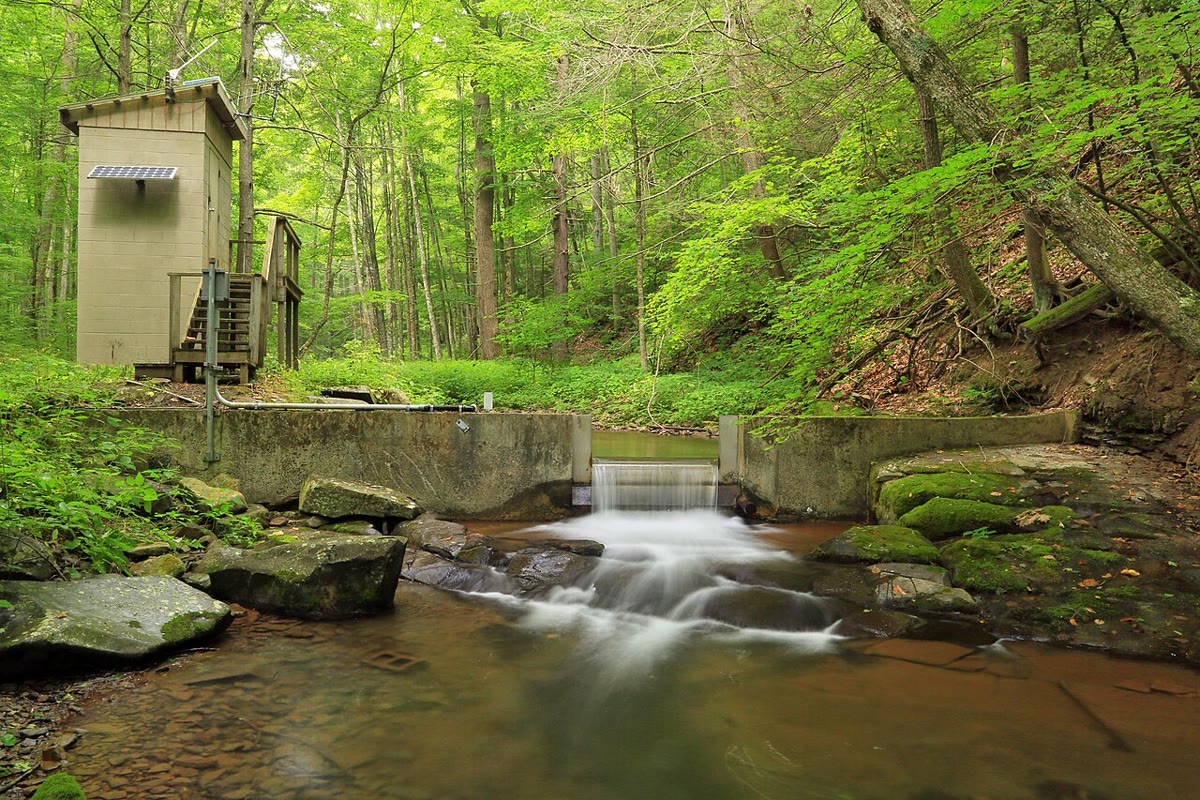
A gauging takes time and cannot be made continuously. A gauging station records instead the level of the water, without a break. A few gaugings made at different levels give a curve relating the level to the discharge, and the station turns each level it records into a discharge.
Large rivers carry enormous discharges. From 1972 to 2003 the Amazon delivered on average about to the Atlantic Ocean, within about : about of all the fresh water that the rivers of the world bring to the sea. The Mississippi brings on average cubic feet per second, about , to the Gulf of Mexico: the Amazon carries some twelve times more.
8.3 The hydrograph
Definition 8.6 (Hydrograph; baseflow; lag time)
A hydrograph is the graph of the discharge of a river at one point against time. The baseflow is the part of the discharge fed by groundwater, which keeps the river flowing between rains. The lag time of a flood is the time between the peak of the rainfall on the basin and the peak of the discharge.
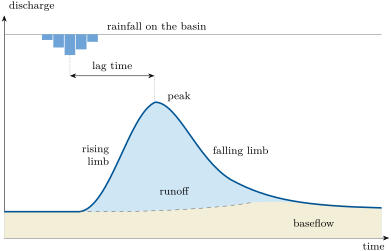
The water of a storm reaches the river at different times. Rain falling near the channel arrives within minutes or hours; rain falling far upstream takes much longer, since it must flow down the slopes and along the river. The discharge therefore rises steeply, on the rising limb, while the water of the nearby slopes arrives, peaks when the most water arrives at once, and falls more slowly, on the falling limb, as the last water drains from the far corners of the basin and from the soil. The larger the basin, the longer the lag time: hours for a small stream, days for a large river.
Some basins give flashy floods, with a high, sudden peak and a short lag time; others give slow, flat floods. The same rain gives a flashier flood when:
- the basin is small and steep, so that the water has a short, fast way to go;
- the ground lets little water soak in: bare rock, clay, ground that is already soaked, frozen ground, and above all the roofs, roads and car parks of a town, which send almost all the rain straight into drains and streams;
- the basin has a dense network of streams and drains, which collects the water quickly.
Forests, deep permeable soils and wide floodplains do the opposite: they hold the water back and release it slowly, which lowers and delays the peak.
A real flood
The Potomac River drains a basin of square miles, about , upstream of a gauging station near Washington, in the eastern United States. In January 1996 the station recorded the hydrograph below.
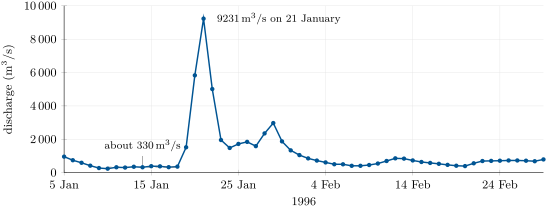
In the days before the flood the river carried about , its baseflow. On 21 January the daily mean reached , almost thirty times more. Spread over the whole basin, the water passing the station that day would make a layer , about deep: a heavy fall of rain, delivered in one day from the whole basin at once.
8.4 Floods and their return period
How large a flood should a town expect? The answer comes from the past: a gauging station that has run for decades has recorded the largest discharge of every year, the annual peak. Small peaks come almost every year, large ones rarely. The rarer a flood, the larger it is.
Definition 8.7 (Return period)
The return period of a flood is the average interval, in years, between years whose annual peak equals or exceeds it. A flood of return period , a -year flood, has a probability of being equalled or exceeded in any one year.
A hundred-year flood is not a flood that comes once every hundred years, like a timetable. It is a flood that has one chance in a hundred of being equalled or exceeded each year, every year, whatever happened the year before. Two can come in successive years; a century can pass without one.
Method 8.8 (Return periods from a record of annual peaks)
- List the annual peaks of years.
- Rank them from the largest (rank ) to the smallest (rank ).
- Give the peak of rank the return period .
- Plot the peaks against on a logarithmic scale of , and read the discharge for the return period wanted.
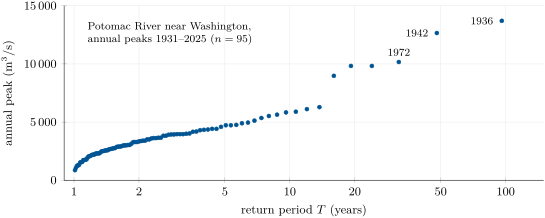
The largest of peaks thus gets years: in a record of years, years. The formula reflects what the record shows: the peak of rank has been equalled or exceeded in of the years, about once every years. The method cannot reliably reach beyond the length of the record: a -year record says little about the -year flood.
Figures as of 2026
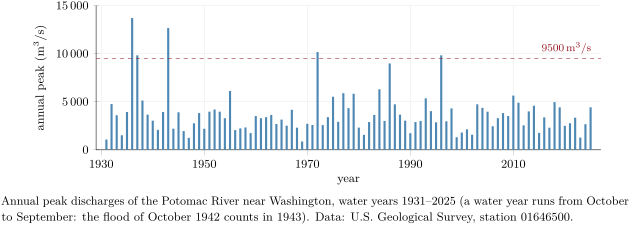
In the record of the Potomac near Washington, from 1931 to 2025, the five largest annual peaks came in March 1936 (), October 1942, June 1972, April 1937 and January 1996, the last two equal at .
The chance of a flood over many years
A house or a bridge stands for decades. What matters to it is not the chance of a flood in one year, but over its whole life.
Proposition 8.9 (At least one flood in years)
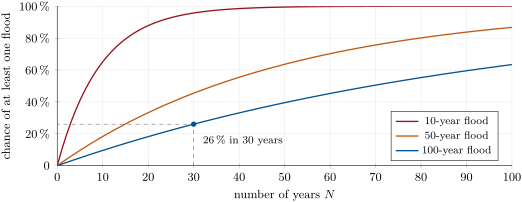
If the years are independent of one another, the probability that a flood of return period is equalled or exceeded at least once in years is
Proof. In one year, the probability that the flood does not happen is . The years being independent, the probability that it happens in none of years is the product of such factors, . The event “at least once” is the opposite of “never”, so its probability is . ∎
For a hundred-year flood over thirty years, , and : one chance in four. Over a hundred years, and : the hundred-year flood is far from certain to come in a hundred years.
8.5 Dams and levees
People have long built structures that change how a flood passes. Two change it in opposite ways.
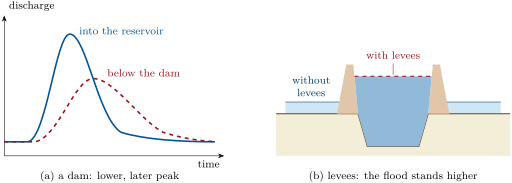
A dam holds back a reservoir. When a flood arrives, part of its water is stored in the reservoir, whose level rises, and is released afterwards, over a longer time. Downstream, the same volume of water passes, but spread out: the peak is lower and later. A reservoir lowers a flood only as long as it has room left; once full, all the water that enters it passes on.
A levee is a bank of earth built along a river to keep its floods off the floodplain. Between the levees the water cannot spread out; to carry the same discharge through the narrower section, it must stand higher and flow faster. The land behind the levees stays dry, as long as the levees hold and are not overtopped. But the floodplain no longer stores water during the flood, so more of it, and sooner, travels downstream.
8.6 Exercises
Exercise 8.1 ★
Define a drainage basin and a drainage divide. Why can two raindrops falling a metre apart end in two different seas?
Solution
Solution of Exercise 8.1.
The drainage basin of a point of a river is the whole area of land whose runoff flows to the river upstream of that point and passes it. The drainage divide is the line, along the crests, that separates two neighbouring basins. Two drops falling a metre apart on either side of a divide run down opposite slopes, into two different basins: their rivers can reach different seas.
Exercise 8.2 ★
Define the discharge of a river and give its unit. How many litres pass a point of a river carrying in one day?
Solution
Solution of Exercise 8.2.
The discharge is the volume of water passing through a cross-section of the river each second, in . is each second; in a day, million litres.
Exercise 8.3 ★
On the hydrograph of the Potomac in January 1996, read the baseflow before the flood, the peak discharge and its date, and the number of days the rise took.
Solution
Solution of Exercise 8.3.
Before the flood the river carried about (between about and ). The peak was on 21 January. The rise began on 18 January (): it took three days.
Exercise 8.4 ★
What is the probability that a -year flood is equalled or exceeded next year? A -year flood came last year: is it less likely this year?
Solution
Solution of Exercise 8.4.
, . No: the years are independent; the chance is again this year, whatever happened last year.
Exercise 8.5 ★
The Mississippi brings on average cubic feet of water per second to the sea ( foot = ). Convert this discharge to , and compare it with the of the Amazon.
Solution
Solution of Exercise 8.5.
One cubic foot is , so . The Amazon carries times more.
Exercise 8.6 ★★
A hydrologist gauges a stream with four verticals apart. The depths are , , and ; the mean velocities , , and . Compute the cross-section, the discharge and the mean velocity.
Exercise 8.7 ★★
A storm drops of rain over the whole basin of the Varden river on the map, . What volume of water is that? If all of it reached the outlet over two days, what would be the mean extra discharge?
Solution
Solution of Exercise 8.7.
. Two days are : on average.
Exercise 8.8 ★★
The annual peaks of a small river over nine years are, in : , , , , , , , , . Rank them and give the return periods of the three largest. What is the return period of the median peak?
Solution
Solution of Exercise 8.8.
Ranked: 120, 88, 65, 59, 51, 47, 42, 38, 35. With , : the largest (120) has years, the second (88) 5 years, the third (65) about 3.3 years. The median, 51, has rank 5 and years: it is equalled or exceeded one year in two.
Exercise 8.9 ★★
The same storm falls on two basins of the same area: one steep, covered by a town, the other gently sloping and forested. Sketch their two hydrographs on the same axes and explain the differences.
Solution
Solution of Exercise 8.9.
The town’s hydrograph rises sooner and much higher, and falls quickly: on steep slopes, roofs and roads, little water soaks in and the runoff reaches the stream fast and all at once; its lag time is short. The forested basin’s hydrograph rises later, to a lower, broader peak: the soil and the forest take in much of the rain and release it slowly, and the water flows slowly on gentle slopes. Its baseflow stays higher after the storm.
Exercise 8.10 ★★
At the peak of 21 January 1996, the Potomac carried from a basin of . What depth of water, spread over the whole basin, does one day of this discharge represent? Compare with the baseflow of .
Solution
Solution of Exercise 8.10.
, spread over : about , . The baseflow gives , about a day: the peak day carried about 28 times more.
Exercise 8.11 ★★
What is the probability that a -year flood comes at least once in years? That it does not come at all in these ten years?
Solution
Solution of Exercise 8.11.
: about . It does not come at all with probability , about .
Exercise 8.12 ★★★
The discharge entering a reservoir in a flood rises steadily from to in one day, then falls steadily back to in two days (baseflow neglected). What volume does the flood bring? The dam lets at most through, and the reservoir can store million . Can it hold back everything above ?
Solution
Solution of Exercise 8.12.
The hydrograph is a triangle three days long and high: its area is , million cubic metres. The part above is a smaller triangle of the same shape, three times smaller in height ( instead of ) and in duration (one day instead of three): , million cubic metres. That is less than the million the reservoir can store: yes.
Exercise 8.13 ★★★
A river wide is full to its banks at , flowing at . A flood of arrives.
- Without levees, the extra spreads over a floodplain wide, where it flows at . How deep is the water on the floodplain?
- With levees, all the flood passes between them, at . How deep is the river, and how far above its banks does it stand?
Solution
Solution of Exercise 8.13.
Full to its banks, the river is deep. (1) The floodplain carries over at : its depth is . (2) Between the levees: deep, above its banks, more than twice the depth on the floodplain without levees.
Exercise 8.14 ★★★
What return period gives a flood a chance of one in two of coming at least once in years?
Solution
Solution of Exercise 8.14.
We want , so , and years.
Exercise 8.15 ★★★
A small map is cut into squares of ; their heights in metres are given below (north at the top). Water leaves each square towards the lowest of its four neighbours (north, south, east, west) if it is lower; the squares at (north-west corner) and (south-east corner) are the outlets of two streams.
| 34 | 38 | 46 | 50 |
|---|---|---|---|
| 37 | 42 | 48 | 47 |
| 45 | 49 | 44 | 39 |
| 51 | 46 | 37 | 30 |
Draw the direction of flow of each square, find the basin of each outlet and its area, and draw the divide.
Solution
Solution of Exercise 8.15.
Each square sends its water to its lowest neighbour (rows from north to south, columns from west to east):
| outlet | west | west | west |
|---|---|---|---|
| north | west | west | south |
| north | north | south | south |
| north | east | east | outlet |
Following the arrows, the squares 47, 39, 44, 37, 46 and 30 drain to the south-east outlet: 6 squares, . The other 10 squares drain to the north-west outlet: . The divide runs from the east edge between 50 and 47, then between 48 and 47, between 48 and 44, between 49 and 44, between 49 and 46, and between 51 and 46 to the south edge.
8.7 Problem: The Hundred-Year Flood
Problem 8.1
Weekend problem — how often does the river come into town?
Imagine a town on the Potomac River, just upstream of Washington, near a gauging station that has recorded the river’s largest discharge every year since 1931. The annual peaks are drawn below, with the hydrograph of January 1996 given in the chapter.
Part I — The basin and the discharge.
- The station’s basin covers square miles ( mile = ). Convert this area to .
- What line on a map bounds this area?
- The largest peak, on 19 March 1936, was cubic feet per second. Convert it to ( foot = ).
- The median annual peak is . How many times larger than the median was the flood of 1936?
- Suppose that at the peak of 1936 the river was wide and deep on average at the station. What would its mean velocity have been?
Part II — Reading the flood of 1996.
- On the hydrograph of January 1996, what was the baseflow in the days before the flood?
- What was the peak daily discharge, and on what day?
- How many days did the rise take, from on 18 January to the peak?
- What depth of water over the whole basin did the peak day carry past the station?
- A second, smaller rise peaks on 29 January. What does it tell about the water reaching the basin?
- The discharge was back near on 7 February. How long after the peak was that? Why does the falling limb last longer than the rising limb?
Part III — Ranking the floods.
- The record holds annual peaks. What return period does the method give to the largest?
- The peak of October 1942 () ranks second. What is its return period?
- The peak of June 1972 () ranks third. What is its return period?
- The floods of April 1937 and January 1996 were equal (). Given ranks 4 and 5, what return periods do they get? Does sharing a value matter much here?
- On the bar chart, count the years whose peak exceeded . Estimate the chance of such a peak in any one year, and its return period.
Part IV — The chance of a flood.
- What is the probability that a -year flood is equalled or exceeded in a given year?
- What is the probability that it is not, in that year?
- What is the probability that it does not come in years, the time a family might live in a house by the river?
- What is the chance of at least one -year flood in years?
Solution
Solution of Problem 8.1.
1. .
2. The drainage divide of the basin upstream of the station.
3. .
4. times.
5. and .
6. About .
7. , on 21 January.
8. Three days.
9. : about .
10. New water reached the river: another fall of rain on the basin (or melting snow) sent a second, smaller pulse of runoff.
11. Seventeen days after the peak. The rise comes from the runoff of the slopes near the streams, which arrives quickly and all at once; on the falling limb the river still receives the water of the farthest parts of the basin and the water that drains slowly out of the soil.
12. years.
13. years.
14. years.
15. years and years. Not much: either way this discharge comes back about once in twenty years.
16. Five years (1936, 1937, 1943, 1972 and 1996): , about a year, a return period of about years.
17. , .
18. .
19. .
20. : the chance of at least one 100-year flood in 30 years is about , one in four.