书籍暂未推出简体中文版——当前显示英文版。
High School Earth and Space Sciences · 10–12 年级
23The Destruction of Mountains
Seen from the International Space Station, the Appalachian Mountains of eastern North America are a striking pattern of long, dark, forested ridges and pale farmed valleys, more than of them in the photograph below. The ridges are hard rock layers that were crumpled into tight folds when Africa pushed against North America, in the Carboniferous and Permian periods, more than 250 million years ago. Today their highest summit, Mount Mitchell, the highest point east of the Mississippi River, stands above sea level, less than a quarter of the height of Everest.
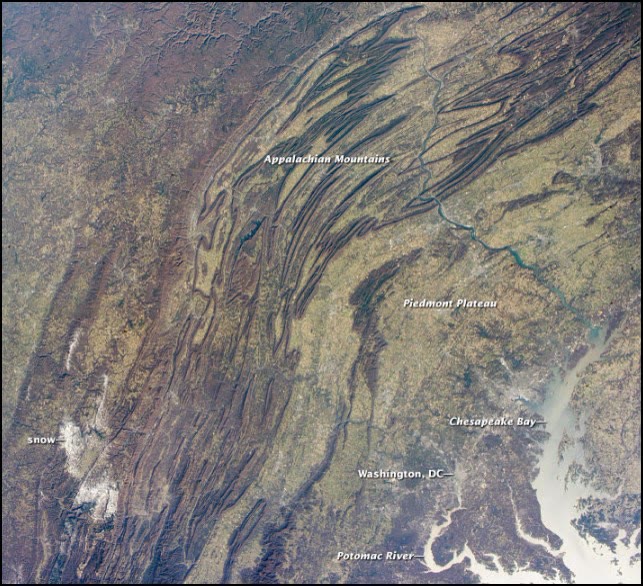
A mountain range does not last. From the moment it rises, rain, ice and rivers attack it; the rock they carry away ends up in the sea, where it becomes new rock. This chapter measures how fast that happens, follows the debris to the place where it turns to stone, and shows why a range that is being worn down keeps rising as it goes.
You already know
Weathering breaks rock down where it stands; erosion carries the debris away and deposition lays it down elsewhere (Book 1, grade 5). Chemical weathering turns feldspars into clay minerals by hydrolysis (Chapter 7). The discharge of a river is the volume of water that passes a point in a second (Chapter 8). The crust floats on the mantle in isostasy; in Airy’s model, a region whose crust is thicker by stands higher by (Chapter 12), and a high range rests on a root of thick crust (Chapter 19). Sediments accumulate in sedimentary basins (Chapter 18). Rocks buried deep in a mountain belt are metamorphosed (Chapter 21).
23.1 How fast is the land worn down?
Definition 23.1 (Denudation rate)
The denudation rate of a region is the mean thickness of rock that weathering and erosion together remove from it per unit of time. It is usually given in metres per million years (), which is the same as millimetres per thousand years.
How can one measure something so slow? Cosmic rays striking the ground make a rare isotope, beryllium-10, in the quartz of the top few metres of rock. The slower a surface is worn down, the longer each grain stays near the top, and the more beryllium-10 it gathers. Measuring it in the sand of a river gives the mean denudation rate of the whole basin upstream, over the last thousands to millions of years.
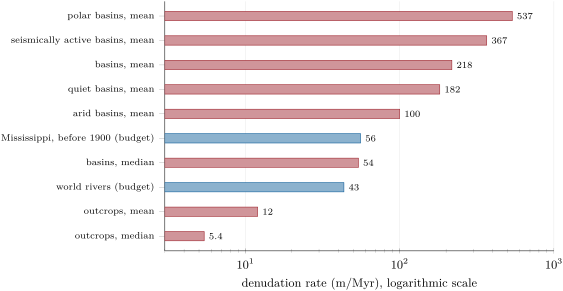
A compilation of 1599 such measurements found that bare rock outcrops are worn down slowly, by on average (median ), and never faster than . Whole drainage basins lose much more, on average, but with a median of only : a few fast basins pull the mean up. The fastest are the steep ones: the mean slope of a basin is the factor that best predicts its rate. Basins in seismically active regions, where mountains are rising, erode about twice as fast as those in quiet regions.
23.2 Rivers carry the mountains away
Much of what is worn off the land leaves it in rivers.
Definition 23.2 (Sediment load)
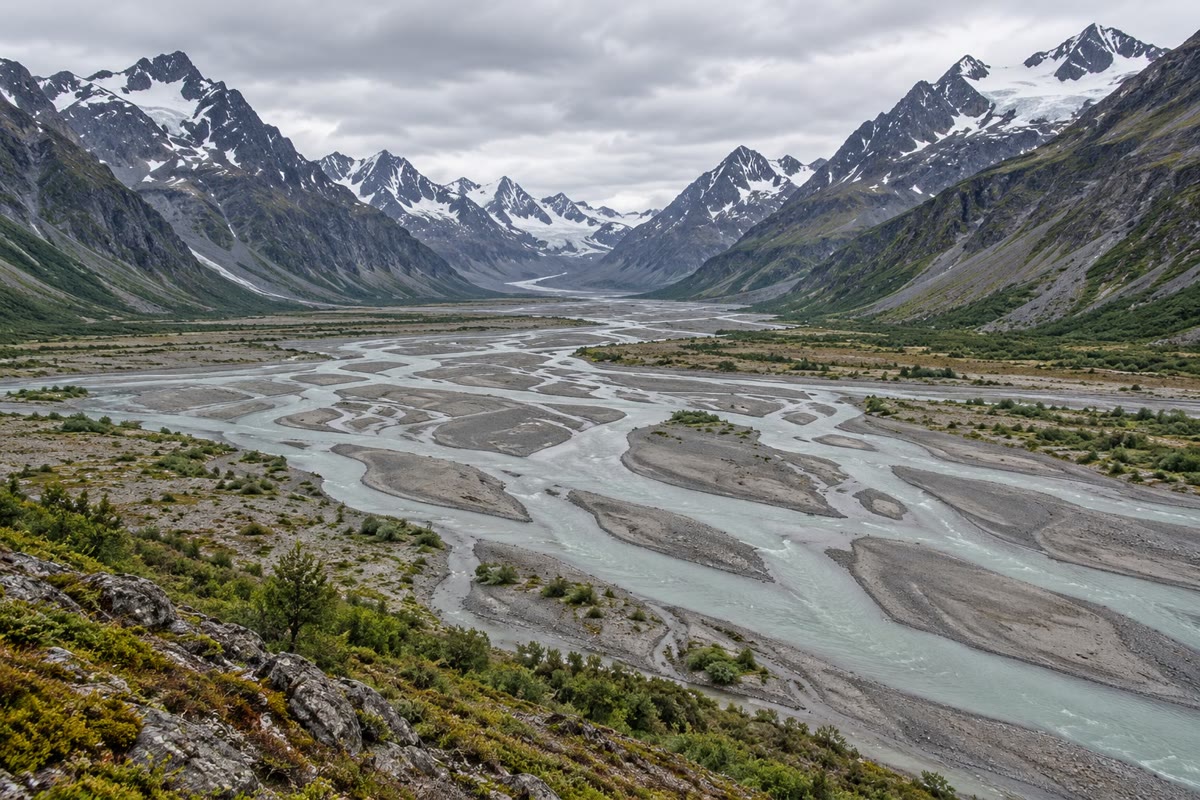
The sediment load of a river is the material it carries, in three forms: the bed load, large grains rolled, pushed or bounced along the bottom; the suspended load, small grains held up in the moving water; and the dissolved load, ions in solution, such as calcium and chloride, left by chemical weathering.
On average, the dissolved load is about of the mass a river carries. The faster the water, the larger the grains it can lift. A sand grain across is picked up from the bed at about , and once moving it stays in suspension until the current falls below . Silt grains are harder to lift than sand, because they stick together: a grain of needs to be picked up, but then a current of keeps it in suspension. That is why rivers in flood run brown, and why the finest mud travels all the way to the sea.
Measuring what a river carries gives a second way to find a denudation rate.
Method 23.3 (An erosion budget)
- Take the mass of sediment the river carries in a year, and add the dissolved load (if only the solid load is known, divide it by ).
- Divide by the density of the rock, about for the continental crust, to get the volume of rock removed each year.
- Divide by the area of the drainage basin: this is the thickness removed each year.
- Multiply by to express it in metres per million years.
Example 23.4 (The Mississippi)
Before 1900, the Missouri–Mississippi river system carried about 400 million tonnes of sediment a year to the sea, from a basin of about . With the dissolved load, million tonnes, that is of rock a year. Spread over , it is a layer
Between 1987 and 2006 the river carried only 145 million tonnes a year, which gives about : dams built on the Missouri in the 1950s trap about 100 to 150 million tonnes a year, and other works hold back more.
The same budget can be made for the whole world. Before people changed the rivers, they carried about 15.5 billion tonnes of solid sediment a year to the coasts; with the dissolved load, that is about of rock a year, taken from the of the continents: a mean denudation rate of about , close to the median of the beryllium-10 measurements. People have since changed both terms: soil erosion has increased what rivers pick up by about 2.3 billion tonnes a year, but more than 100 billion tonnes of sediment now lie behind dams.
23.3 From sediment to rock
What the rivers carry is laid down where the current slows: in valleys and lakes, on deltas, and above all in the sedimentary basins of the continental margins. Layer after layer, the sediment is buried, and it slowly turns to rock.
Definition 23.5 (Detrital rock; diagenesis)
A detrital rock (or clastic rock) is a sedimentary rock made of fragments, the clasts, of older rocks and minerals. Diagenesis is the set of changes that turn a buried sediment into rock at low temperature: compaction, as the weight of the layers above squeezes out water and air, then cementation, as minerals that crystallise from the water in the pores (calcite, quartz, hematite, clay minerals) glue the grains together.
Detrital rocks are named by the size of their clasts:
- a conglomerate is made of rounded clasts larger than , a breccia of angular ones;
- a sandstone is made of sand, grains between and , most often of quartz, the mineral that best resists weathering;
- a mudrock holds at least silt and clay; it is a shale if it splits into thin layers.
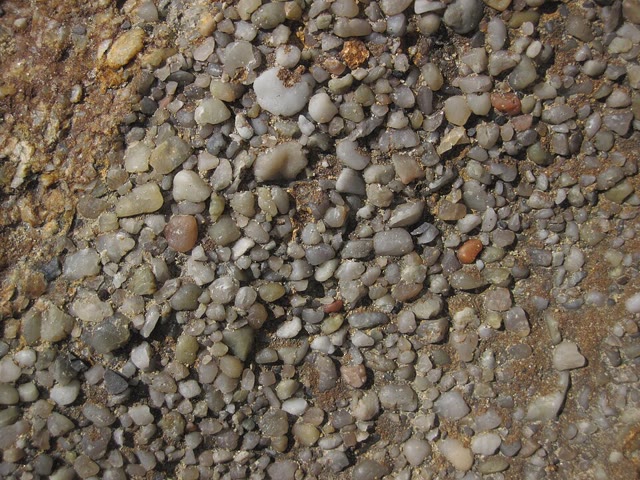
The clasts record the journey. Rounded pebbles have rolled a long way in a river or on a beach; angular ones have hardly travelled. A sandstone made almost only of quartz comes from rock that was weathered for a long time, until the other minerals had turned to clay.
23.4 The root rises
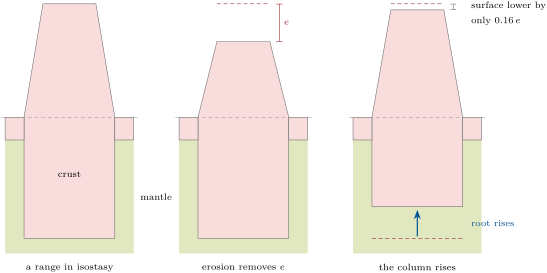
If erosion simply removed rock from the top of a range, a range high, worn down at , would be gone in ten million years. But the range floats on the mantle. As rock is removed from the top, the column becomes lighter, and it rises.
Definition 23.6 (Isostatic rebound)
Isostatic rebound is the rise of a region of the lithosphere when a load is removed from it — rock worn away by erosion, or an ice sheet that melts — until isostasy is restored.
Proposition 23.7 (Erosion and rebound)
In Airy’s model, when erosion removes a thickness of crust of density from a region in isostasy on a mantle of density , the surface goes down by only
while the base of the crust rises by .
Proof. Removing from the top makes the crust thinner by . By Airy’s model, a crust thinner by stands lower by . The top of the crust has gone down by this amount, and its thickness has decreased by , so its base has risen by . ∎
With and , . Removing of rock lowers the surface by only about : the other are made up by the whole column rising. To lower a range by , erosion must remove about of rock. Rocks that were more than down, metamorphic rocks and granites formed in the depths of the range, reach the surface: this is why the old, worn-down mountain belts expose schists, gneisses and granites over vast areas.
The same rebound can be watched today where a load disappeared quickly. The ice sheet that covered much of Canada at the last glacial maximum was thickest around Hudson Bay. That ice has melted, and the land there is still rising: by about a year, as measured by GPS, that is , about fifty times the mean denudation rate of drainage basins. Farther south, beyond the Great Lakes, the land sinks by 1 to a year.
23.5 How long does a range last?
The steeper a basin, the faster it erodes; for large basins, the denudation rate has been found proportional to their mean relief. Let us take the simplest model that says so.
Proposition 23.8 (The exponential decay of a range)
Let be the mean elevation of a range above the plains around it. If the denudation rate is , with a constant, and if isostasy is restored all the time, then
where is the elevation at . The elevation is divided by every , and by two every .
Proof. In a short time , erosion removes a thickness , and by the previous proposition the surface goes down by . So , and the solutions of this equation are . At , ; when . ∎
Measurements on large basins give : with no uplift at all, their relief would fall to a tenth in about 11 million years. So , and per million years. Without rebound (), the time constant would be million years. With rebound, and
and the mean elevation halves every million years: rebound makes a range last about six times longer.
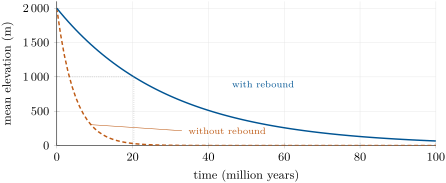
The Appalachians test this picture. Their collision ended in the Permian, more than 250 million years ago. That is more than twelve times the time the model takes to halve the elevation: . Yet Mount Mitchell still rises above the sea. The model alone cannot explain the present relief: the region must have been raised again since, or eroded more slowly than the model assumes.
So mountains are recycled. The rock worn from a range ends in sedimentary basins, where it becomes detrital rock; some of that rock is buried deep enough to be metamorphosed or even to melt, some is carried down into the mantle at a subduction zone (Chapter 22), and some is folded up again into a new range when two continents collide.
 schist
 sandstone (Triassic)
 limestone
 shale
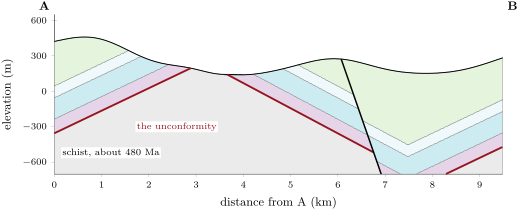
 chalk vertical exaggeration Section A–B across the Varden Hills, with the unconformity in red: the flat base on which the Triassic sandstone was laid across the schist basement, later folded and faulted. Data: the series’ model of the region.
The Varden Hills hold the record of such a cycle. Their basement is a schist, metamorphosed about 480 million years ago, into which a granite was intruded about 310 million years ago — both formed kilometres below the surface of an old mountain belt. Yet the Triassic sandstone, laid down from about 252 million years ago, rests directly on them, across a flat surface: the unconformity. In less than 60 million years, that old range had been worn down to a plain and its deep rocks brought to the surface. The sea then spread over the plain and buried it.
23.6 Exercises
Exercise 23.1 ★
Give the word: (a) the mean thickness of rock removed from a region per unit of time; (b) the grains a river rolls and bounces along its bed; (c) the ions a river carries in solution; (d) the changes that turn a buried sediment into rock; (e) the rise of the lithosphere when a load is removed from it.
Solution
Solution of Exercise 23.1.
(a) the denudation rate; (b) the bed load; (c) the dissolved load; (d) diagenesis; (e) isostatic rebound.
Exercise 23.2 ★
Name the detrital rock: (1) rounded pebbles of cemented together; (2) quartz grains of ; (3) a rock that is silt and clay and splits into thin sheets; (4) angular fragments of .
Solution
Solution of Exercise 23.2.
(1) A conglomerate. (2) A sandstone. (3) A shale. (4) A breccia.
Exercise 23.3 ★
Convert to millimetres a year: (1) ; (2) ; (3) the uplift of a year near Hudson Bay, in .
Solution
Solution of Exercise 23.3.
is in years, a year. (1) a year. (2) a year. (3) a year is in 1000 years, .
Exercise 23.4 ★
A river carries 60 million tonnes of solid sediment a year. Estimate its dissolved load, knowing that the dissolved load is on average of the total mass carried.
Solution
Solution of Exercise 23.4.
The solid load is of the total, so the total is million tonnes, and the dissolved load about million tonnes a year.
Exercise 23.5 ★
Put in order, from the surface downwards, what happens to a grain of quartz of a granite: deposition in a basin, weathering of the granite, burial under younger layers, transport by a river, cementation.
Solution
Solution of Exercise 23.5.
Weathering of the granite, transport by a river, deposition in a basin, burial under younger layers, cementation.
Exercise 23.6 ★★
A current slows from to . Using the values of the chapter, say what happens to a sand grain of resting on the bed, and to a silt grain of already in suspension, at each speed.
Solution
Solution of Exercise 23.6.
At the sand grain is picked up (above ); the silt grain stays in suspension. At the sand grain settles (below ), but the silt grain still stays in suspension, since is enough to keep it there.
Exercise 23.7 ★★
A basin of sends 4 million tonnes of solid sediment a year to the sea. Make its erosion budget, dissolved load included, with . Compare with the median of the beryllium-10 basin rates.
Solution
Solution of Exercise 23.7.
Total load million tonnes, of rock a year. Over : m a year, about , below the median of .
Exercise 23.8 ★★
(1) Compute for and . (2) How much is the surface lowered when of rock is eroded? (3) Compare with the chapter’s value.
Solution
Solution of Exercise 23.8.
(1) . (2) About . (3) A little more than the of the chapter: the lighter the crust compared with the mantle, the less the column rises.
Exercise 23.9 ★★
A granite crystallised about down beneath a range. (1) What thickness of rock must erosion remove to bring it to the surface? (2) By how much does the mean surface go down meanwhile? (3) At , how long does it take?
Solution
Solution of Exercise 23.9.
(1) of rock. (2) . (3) million years.
Exercise 23.10 ★★
The mean elevation of the continents is about . (1) At , how long would erosion take to remove a layer that thick? (2) How long, if isostatic rebound is taken into account and the rate stays the same? (3) Why do the continents nevertheless still stand above the sea after 4 billion years?
Solution
Solution of Exercise 23.10.
(1) million years. (2) The surface goes down by only times the thickness eroded, so the rock to remove is , which takes about million years. (3) The continents are not only worn down: mountain building and the magmatism of arcs keep raising them and adding new crust.
Exercise 23.11 ★★
More than 100 billion tonnes of sediment lie behind dams built mostly in the last fifty years. (1) What volume of rock is that, at ? (2) How many years of the world’s prehuman solid load, 15.5 billion tonnes a year, does it represent?
Solution
Solution of Exercise 23.11.
(1) , that is about . (2) years.
Exercise 23.12 ★★★
Show that, in the model of the chapter, the denudation rate of a range is . Compute the total thickness of rock removed while the mean elevation falls from to 0, and explain the result with the rebound proposition.
Solution
Solution of Exercise 23.12.
and give . The thickness removed from to is . To lower the surface by , erosion must remove , as the rebound proposition says: each metre eroded lowers the surface by only metres.
Exercise 23.13 ★★★
Near Hudson Bay the land rises by a year. (1) If that rate stayed the same, how much would it rise in 1000 years? (2) The rise is a rebound after the melting of an ice sheet. Take ice of density and the mantle at : how much would the land rise in all, in Airy’s model, after the melting of of ice? (3) Why should the rate slow down with time?
Solution
Solution of Exercise 23.13.
(1) , . (2) Removing a load of ice of thickness is like removing a mass per unit area; the column rises until it has displaced that much less mantle: . (3) The land rises less and less as it nears its new equilibrium: what drives the rise is the part not yet recovered.
Exercise 23.14 ★★★
The Mississippi carried 400 million tonnes of solid sediment a year before 1900 and 145 million tonnes a year in 1987–2006. (1) Compute the denudation rate of its basin of in both periods, with the dissolved load. (2) Which of the two better measures the natural erosion of the basin? (3) The dams trap 100 to 150 million tonnes a year: does that account for the whole decrease?
Solution
Solution of Exercise 23.14.
(1) Before 1900: about (as in the example). In 1987–2006: million tonnes, , over : about . (2) The earlier one: the later load is held back by dams and other works. (3) No: the decrease is million tonnes a year, of which the dams account for 100 to 150, about half.
Exercise 23.15 ★★★
In the Varden Hills, a granite intruded about 310 million years ago lies under Triassic sandstone, laid down from about 252 million years ago. Suppose the granite crystallised down. (1) What thickness of rock was removed above it, at least? (2) What mean denudation rate does that require, at least? (3) Compare with the measured rates of basins.
Solution
Solution of Exercise 23.15.
(1) At least . (2) million years at most, so at least . (3) It is between the median () and the mean () of the basins: an ordinary rate for a mountain belt.
Problem 23.1
Weekend problem — How long to flatten a mountain range?
A young range has a mean elevation of above the plains around it. Its rivers wear it down at a rate proportional to its height, , with per million years. The crust has a density of , the mantle below it .
Part I — The erosion rate.
- Compute the denudation rate of the range today, in .
- Express it in millimetres a year.
- Compare it with the mean rates measured in seismically active basins () and in quiet ones ().
- Which feature of a basin best predicts its erosion rate?
- How many tonnes of rock leave each square kilometre of the range every year?
Part II — Without rebound.
- If the rate stayed at its present value, how long would it take to remove of rock?
- In fact the rate falls as the range is lowered. Write the equation and its solution with .
- What is the time constant ?
- How long does the elevation take to halve?
- Check that a tenth of the elevation is left after 11 million years.
Part III — With rebound.
- Compute .
- When of rock is eroded, by how much does the surface go down, and by how much does the root rise?
- Write the new equation for and its solution.
- What thickness of rock must be eroded to lower the range from to ?
- What kinds of rock does that bring to the surface?
Part IV — The time constant.
- Compute the time constant with rebound.
- How long does the range take to fall to a tenth of its height?
- How high is it after 200 million years?
- The Appalachian collision ended more than 250 million years ago. Had the range never been raised again, how high would the model leave it after 250 million years? Mount Mitchell still rises above the sea: what does this suggest?
- Sum up: in how many million years does the mean elevation of the range halve?
Solution
Solution of Problem 23.1.
1. .
2. a year.
3. Faster than both: it is a steep, young range, as fast as the seismically active basins and more.
4. Its mean slope.
5. A layer of over is , : about 1200 tonnes.
6. million years.
7. ( in millions of years).
8. million years.
9. million years.
10. .
11. .
12. The surface goes down by ; the root rises by about .
13. , so .
14. of rock.
15. Rocks that were about down: metamorphic rocks such as schists and gneisses, and granites.
16. million years.
17. million years.
18. .
19. : a flat plain. A summit of means that the model alone does not fit: the region must have been raised again since, or eroded more slowly than the model assumes.
20. The mean elevation halves in 20 million years.