书籍暂未推出简体中文版——当前显示英文版。
High School Earth and Space Sciences · 10–12 年级
13Plates and Their Motions
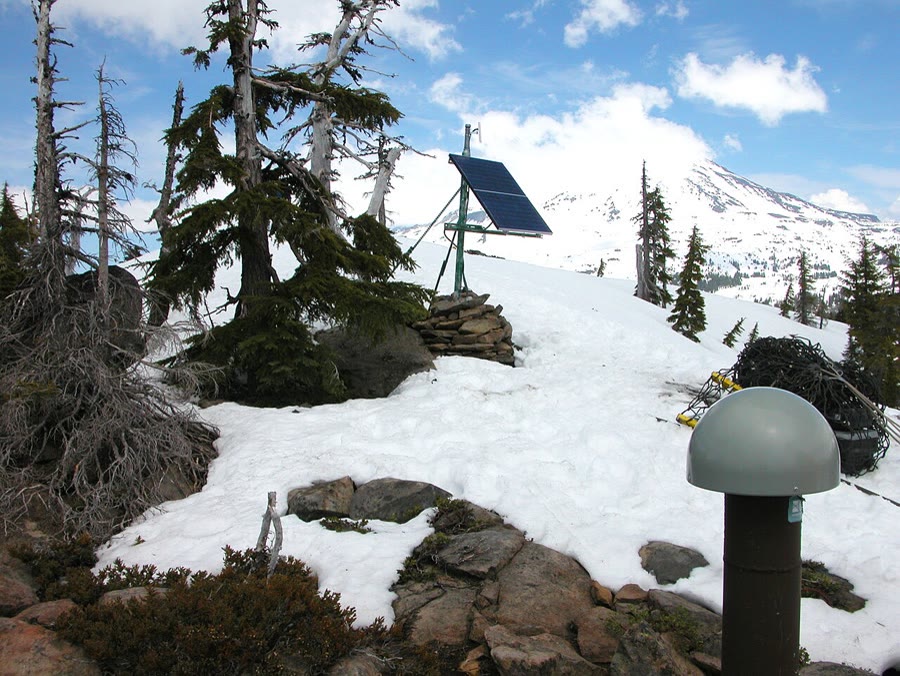
Near the summit of Mauna Kea, on the island of Hawaii, an antenna fixed to the rock has been receiving the signals of positioning satellites every day since October 1996. Each day a computer works out where the antenna is, to a few millimetres. Thirty years of positions tell the same story every year: the antenna, the mountain and the whole island move about a year toward the west-north-west, without stopping and without turning. By 2026 the antenna stood more than two metres from where it started. This chapter measures such motions, shows how they fit together on a sphere, and reads the same motion in the chain of dead volcanoes that stretches from Hawaii across the northern Pacific.
You already know
The lithosphere is broken into tectonic plates that move relative to each other at a few centimetres a year; their boundaries are ridges, trenches, collision zones and transform faults (Book 1, grade 7). A hotspot is a place deep in the mantle that feeds a volcano on the plate above it; the plate carries the volcano away while a new one grows over the hotspot (Book 1, grade 7). A satellite-positioning receiver works out its own position from the signals of several satellites (Book 1, grade 9). The magnetic stripes of the ocean floor give the spreading rate of a ridge (Chapter 10), and the lithosphere is the rigid outer shell of the Earth, about thick (Chapter 12). A speed of a year is per million years, and a year is per million years.
13.1 Rigid plates on a sphere
Earthquakes are not scattered at random over the Earth: almost all of them happen along narrow belts, the plate boundaries (Book 1, grade 7). Inside a plate the rock hardly breaks at all. A plate is therefore not a soft skin that stretches and wrinkles as it moves, but a stiff piece of lithosphere that moves as a whole.
Definition 13.1 (Rigid plate)
A rigid plate is a piece of lithosphere that moves as a single block: the distances between points on it do not change, and its deformation is gathered in narrow zones along its boundaries.
The rigid-plate model is an approximation. Some regions deform over hundreds of kilometres, such as the high plateaus behind the Himalaya or the west of North America, and the model treats them as broad boundaries. But over most of the Earth’s surface it works remarkably well: the velocities it predicts for rigid plates match those that satellite stations measure to within a few millimetres a year (Section 13.4), while plates move with respect to each other by centimetres a year.
How can a rigid cap move over the surface of a sphere? It cannot slide in a straight line, because a straight line leaves the sphere. Whatever the motion of a rigid cap, it is a rotation about an axis through the centre of the Earth. The axis meets the surface at the rotation pole of the plate. A point on the plate moves along a small circle around that pole, and the farther it lies from the pole, the larger its circle and the faster it moves (figure below). The proof that every motion of a rigid cap is such a rotation, and the use of rotation poles to describe plate boundaries, belong to Book 3; here only the speeds are used.
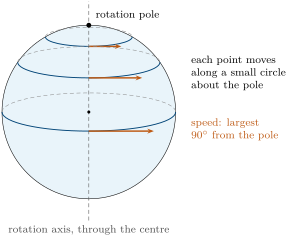
The speed of a point is easy to work out. A point at an angular distance from the pole lies at the distance from the axis, where is the radius of the Earth. If the plate turns by degrees per million years, the point travels the fraction of the circle of radius in a million years:
For per million years and this is per million years, a year. A plate therefore has no single speed: its points move at speeds that range from zero at the rotation pole (if the pole lies on the plate) to a maximum at from it. The transform faults along a ridge, which let two plates slide past each other, run along small circles about the pole of the two plates’ relative rotation.
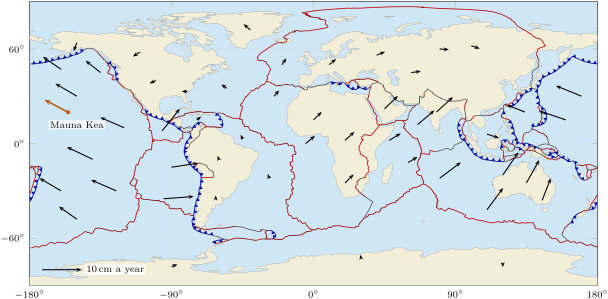
Published sets of rotation poles give, for each plate, the position of its pole and its rate of turning. One of them, built mainly from the spreading rates and the spreading directions measured along the ridges, describes 56 plates; the Pacific plate turns by per million years, the Eurasian plate by . From these numbers a computer works out the velocity of any point of any plate (map below).
13.2 Measuring the motions
13.2.1 Two ways to measure a speed
The magnetic stripes of the ocean floor give the speed at which two plates move apart across a ridge (Chapter 10): divide the distance of a stripe from the ridge axis by its age. The speed obtained is an average over the age of the stripe, often the last few million years, and it is a relative speed, that of one plate seen from the other. Stripes say nothing about plates that meet at a trench or a collision zone, since no ocean floor is made there.
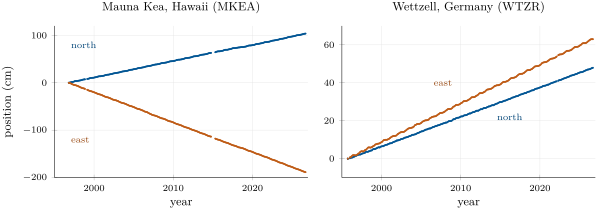
Satellite positioning measures the motion of a single point, today, over a few years or decades. A permanent station is anchored to solid rock, so that it moves with the plate; its daily positions, plotted against time, line up along a straight line whose slope is the velocity of the station.
Method 13.2 (A rate from a positioning time series)
- Plot the east position and the north position of the station against time, on two graphs or on the same graph.
- Draw the straight line that best follows each series (or read two points far apart on it). Its slope, in millimetres per year, is the east speed or the north speed ; a station moving west or south has a negative speed.
- The speed of the station is ; its direction makes the angle with the east–west line such that , toward the north if and toward the east if .
Example 13.3 (The station on Mauna Kea)
From October 1996 to September 2026, the monthly positions of the Mauna Kea station follow two straight lines with slopes a year (westward) and a year. The speed is a year, and gives : the station moves a year in a direction north of west. The rotation pole of the Pacific plate predicts a year, north of west, at this place.
The points scatter by a few millimetres about the lines, much less than the motion of a single year: after a few years of measurement the velocity of a station is known to better than a millimetre a year.
13.2.2 Relative and absolute motion
A velocity is always measured with respect to something. The Mauna Kea station moves a year with respect to a frame attached to the whole Earth; seen from a station in North America, which itself moves, its velocity is different.
Definition 13.4 (Relative motion; absolute motion)
The relative motion of a plate with respect to a plate is its motion as seen by an observer standing on . The absolute motion of a plate is its motion with respect to a frame attached to the deep Earth, for instance a set of hotspots assumed fixed, or the frame in which the lithosphere as a whole does not turn.
Ridges, trenches and transform faults are shaped by relative motions: what matters at a boundary is how the two plates move with respect to each other. Relative velocities are added like the displacements they produce.
Proposition 13.5 (Relative velocities add as arrows)
Let be the velocity of plate relative to plate , at a given point of the boundary, and similarly for the other pairs. For any three plates , , ,
Proof. Over a short time , let a point fixed to move from position to as seen from , and let the point of that was at move to as seen from . Seen from , the point of has moved from to . The displacements add as vectors: , that is, displacement of seen from = displacement of seen from + displacement of seen from . Dividing by gives . With , the left side is zero: . ∎
Method 13.6 (Closing a velocity triangle)
- Write each known velocity with its east and north components, all measured at the same point.
- To find from the velocities of and in the same frame , subtract: , component by component.
- On a drawing, place the tails of and at the same point: the arrow from the tip of to the tip of is , and it closes the triangle.
- Compute its length and direction as in Method 13.2.
Example 13.7 (The San Andreas fault)
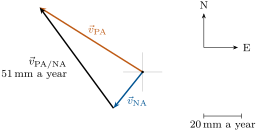
In central California, at North and West, the rotation poles give the Pacific plate the velocity and the North American plate , in millimetres a year (east, north), in the frame of the whole lithosphere. The Pacific plate relative to North America moves at , that is a year, in a direction west of north (figure below). The San Andreas fault, which runs north-west, carries most of this sliding.
13.3 Hotspot tracks
13.3.1 A plate over a fixed plume
Hawaii lies in the middle of the Pacific plate, more than from the nearest plate boundary.
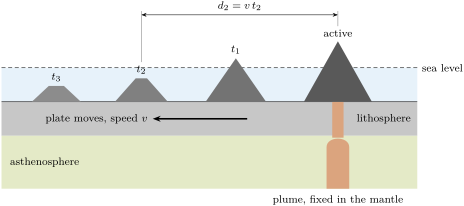
Its volcanoes are fed by a hotspot (Book 1, grade 7). The plate moves over it, and each volcano is carried away from the hotspot while a new one grows behind it.
Definition 13.8 (Hotspot track)
A hotspot track is the line of volcanoes, and of the drowned volcanoes called seamounts, that a plate carries away from a hotspot as it moves over it: the active volcano stands over the hotspot, and the volcanoes are older and older with distance from it.
Proposition 13.9 (Speed from a hotspot track)
If a hotspot stays fixed in the deep mantle and the plate above it moves at a steady speed in a steady direction, a volcano that stood over the hotspot a time ago now lies at the distance
from the active volcano, along the track. The ages of the volcanoes, plotted against their distances, fall on a straight line through the origin whose slope is , and is the absolute speed of the plate.
Proof. The volcano was built where the plate stood over the hotspot, and it has moved with the plate ever since. During the time the plate has moved by in a fixed direction, so the volcano lies at that distance from the point of the plate now over the hotspot, where the active volcano stands. The relation is that of a straight line through the origin with slope . The speed is measured with respect to the hotspot, that is with respect to the deep mantle: it is an absolute speed. ∎
13.3.2 The Hawaiian–Emperor chain
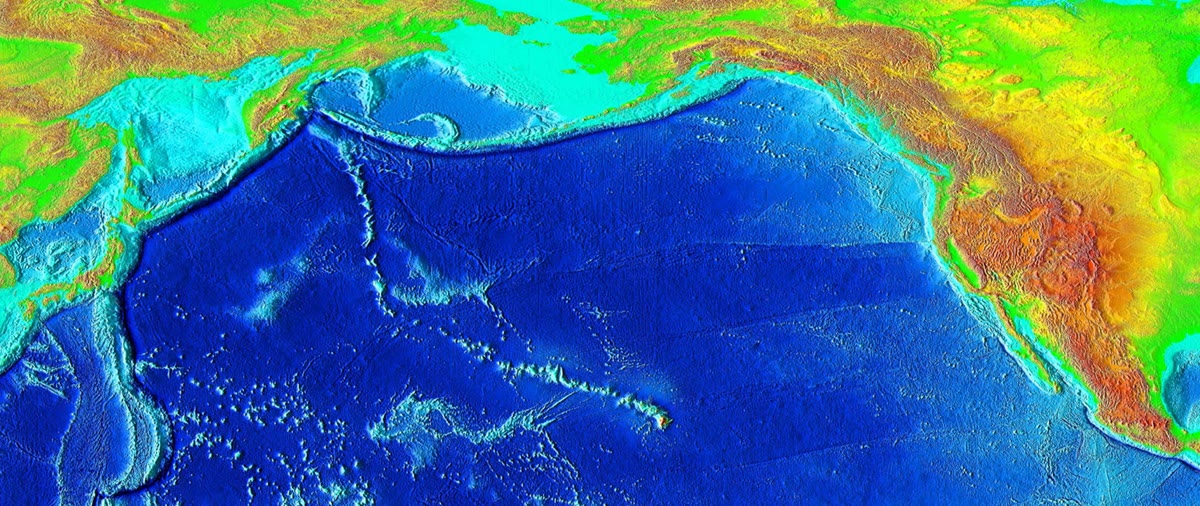
From the island of Hawaii a line of islands, reefs and seamounts runs some to the west-north-west, then turns sharply and continues northward as the Emperor seamounts, the Suiko seamount alone lying from Kilauea, as far as the trenches off Kamchatka and the Aleutians (image below).
Potassium–argon dating of lavas from 37 volcanoes of the chain, collected on the islands, dredged from the seamounts or drilled through their sediments, gives their ages (graph below). Mauna Kea is about million years old, Kauai , Midway , and the Suiko seamount, near the far end of the Emperor chain, . The ages grow with distance from Kilauea, the active volcano, as a hotspot track predicts.
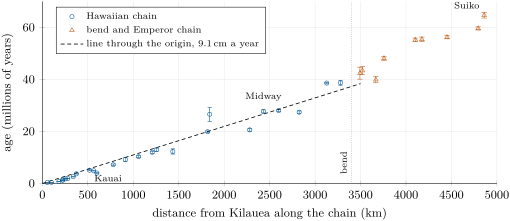
Along the Hawaiian chain, up to about , the points scatter around a straight line through the origin. The line that best fits the 26 dated volcanoes of this part rises by one million years every : by Proposition 13.9, the Pacific plate has moved over the hotspot at about per million years, a year. The authors of the ages, fitting the whole chain in their own way, found a year.
Beyond the bend, the ages grow faster with distance: along the Emperor chain the plate moved more slowly, about a year on average (best straight line through the nine dated seamounts). And the chain changes direction. If the hotspot stayed in place, the bend records a change in the direction of motion of the Pacific plate. Newer ages place the beginning of the bend near the Kimmei seamount, about 50 million years ago, at the same time as a reorganisation of the spreading ridges of the Pacific and the first volcanoes of the island arcs along its western edge: the plate changed course.
13.4 The predictive power of the model
The plate model says that a few rigid plates turn about their rotation poles, and that almost everything happens at their boundaries. Its strength is that measurements made by entirely different methods, over very different spans of time, give the same answers.
- Earthquakes and volcanoes gather along the boundaries, and the kind of boundary predicts their kind: shallow earthquakes along the ridges, deep ones only near trenches (Chapter 15).
- The ocean floor is youngest along the ridges and older and older away from them, symmetrically on both sides (Chapter 10).
- Mountain belts rise where plates converge: India still moves toward Eurasia at about a year across the Himalaya, as computed from the rotation poles (Chapter 20).
- Speeds agree across methods: the table below compares the speeds measured today by satellite positioning with those predicted by the rotation poles, whose spreading rates come mainly from magnetic stripes and average the motion over the last to million years, and with the speed recorded by a hotspot track over tens of millions of years.
| what is measured | method | speed ( a year) |
|---|---|---|
| Mauna Kea, Pacific plate | satellite positioning, 30 years | 7.2 |
| Mauna Kea, Pacific plate | rotation pole | 6.9 |
| Wettzell, Eurasian plate | satellite positioning, 31 years | 2.6 |
| Wettzell, Eurasian plate | rotation pole | 2.3 |
| Pacific plate over the Hawaiian hotspot | volcano ages, 40 million years | 9.1 |
The rotation-pole speeds and the station speeds agree to within a year, though the first average millions of years and the second only decades: the plates move today as they have moved for millions of years. The hotspot speed is larger: it is measured in another frame, that of the hotspot itself, and over a far longer time.
One more pattern appears when the speeds of whole plates are compared. The plates that move fastest, Cocos, Nazca, Pacific, Australian and Philippine Sea, all have a long edge that sinks into the mantle at a trench; their mean speeds average about a year. The plates without such an edge, among them the Eurasian, North and South American, African and Antarctic plates, move at about a year on average. This clue to what drives the plates is taken up in Chapter 15.
13.5 Exercises
Exercise 13.1 ★
Define a rigid plate. Where is the deformation of the lithosphere gathered, and which everyday seismic observation shows it?
Solution
Solution of Exercise 13.1.
A rigid plate is a piece of lithosphere that moves as a single block: the distances between its points do not change, and its deformation is gathered in narrow zones along its boundaries. The earthquakes show it: almost all of them happen along narrow belts, the plate boundaries, and very few inside the plates.
Exercise 13.2 ★
The Mauna Kea station moves a year. Express this speed in kilometres per million years. How far does the station move in 30 years? In a million years?
Solution
Solution of Exercise 13.2.
a year is per million years. In 30 years the station moves , about ; in a million years, .
Exercise 13.3 ★
In ten years, a station moved east and north. Find its east and north speeds, its speed, and the angle its direction makes with the north.
Solution
Solution of Exercise 13.3.
a year and a year. The speed is a year. The angle with the north satisfies , so : the station moves toward the north-east, east of north.
Exercise 13.4 ★
Define a hotspot track. Along the Hawaiian chain, where is the youngest volcano, and in which direction do the ages increase? What does that tell about the direction in which the Pacific plate moves?
Solution
Solution of Exercise 13.4.
A hotspot track is the line of volcanoes and seamounts that a plate carries away from a hotspot as it moves over it, older and older with distance from the active volcano. The youngest volcano, Kilauea, stands at the south-eastern end of the chain, on the island of Hawaii; the ages increase toward the west-north-west. The plate carries its volcanoes away from the hotspot in the direction of its motion: the Pacific plate moves toward the west-north-west.
Exercise 13.5 ★
Kauai lies from Kilauea along the chain, and its oldest lavas are million years old. Assuming the hotspot is fixed, at what average speed has the plate carried it, in kilometres per million years and in centimetres a year?
Solution
Solution of Exercise 13.5.
per million years, that is a year, about a year.
Exercise 13.6 ★★
In the graph of the two station series, the Wettzell station moved about east and north in 31 years. Find its east and north speeds, its speed, and its direction. Compare its speed with that of Mauna Kea.
Solution
Solution of Exercise 13.6.
a year and a year. The speed is a year; gives : the station moves north of east, toward the north-east. Mauna Kea moves times faster.
Exercise 13.7 ★★
In Iceland, at North and West, the rotation poles give the North American plate the velocity and the Eurasian plate , in millimetres a year (east, north). (1) Find the velocity of North America relative to Eurasia, its speed and its direction. (2) What is this speed for the ridge that crosses Iceland? (3) Compare with the rate of a year often quoted for the North Atlantic.
Solution
Solution of Exercise 13.7.
(1) In millimetres a year,
Its speed is a year, and gives north of west. (2) The two plates move apart across the ridge at about a year: this is the full spreading rate of the ridge in Iceland. (3) It agrees with the a year quoted for the North Atlantic.
Exercise 13.8 ★★
The Pacific plate turns by per million years. (1) Find the speed of a point from its rotation pole, in centimetres a year. (2) And of a point from the pole? (3) Where on a plate is the speed zero? Can the speed of a whole plate be given by one number?
Solution
Solution of Exercise 13.8.
(1) per million years, about a year. (2) per million years, about a year. (3) At the rotation pole, if it lies on the plate. The speed changes from point to point, from zero at the pole to its largest value away from it: a whole plate has no single speed, only a speed at each point (or an average over its surface).
Exercise 13.9 ★★
North of the Himalaya, at North and East, the rotation poles give the Indian plate the velocity and the Eurasian plate , in millimetres a year (east, north). (1) Find the velocity of India relative to Eurasia, its speed and its direction. (2) If it stayed the same, by how much would the two plates converge in 10 million years?
Solution
Solution of Exercise 13.9.
(1) In millimetres a year,
The speed is a year; the angle with the north satisfies , so : India moves toward Eurasia, east of north. (2) per million years, so in 10 million years.
Exercise 13.10 ★★
Necker lies from Kilauea and is million years old; Midway lies away and is million years old. Find the speed of the plate over the hotspot between the times the two volcanoes were built. Compare with a year.
Solution
Solution of Exercise 13.10.
per million years, about a year, a little less than a year. The ages are uncertain by about half a million years each; the age difference, million years, gives a speed between about 75 and per million years. Between these two volcanoes the plate seems to have moved a little more slowly than on average.
Exercise 13.11 ★★
At a point, plate moves a year east relative to plate , and plate moves a year north relative to plate . (1) Draw the velocity triangle and find the velocity of relative to : speed and direction. (2) What is the velocity of relative to ?
Solution
Solution of Exercise 13.11.
(1) : a year east plus a year north. The two arrows form a right angle, and the third side of the triangle has the length a year, in the direction east of north (). (2) : a year in the opposite direction, west of south.
Exercise 13.12 ★★★
Mauna Kea lies from Kilauea and is million years old. (1) What speed does it give for the plate? (2) A volcano is some tens of kilometres across, and it grows for several hundred thousand years. Suppose its distance from the hotspot is uncertain by : between which values does the speed then lie? (3) Explain why young volcanoes close to the hotspot give a poor estimate of the speed, and why the volcanoes far from it are better.
Solution
Solution of Exercise 13.12.
(1) per million years, a year. (2) From to per million years: between about 8 and a year. (3) Close to the hotspot the distance is no larger than the size of a volcano or of the region over which the hotspot feeds volcanoes, and the age is no larger than the time a volcano takes to grow: both are very uncertain in relative terms. Far from the hotspot an error of on , or of half a million years on 28 million, is only one or two per cent.
Exercise 13.13 ★★★
The monthly positions of a station scatter by about about their straight line. A motion is clearly seen once it exceeds ten times the scatter. (1) How long must one measure to see clearly the motion of the Mauna Kea station, a year? (2) And a motion of a year, as across a slowly deforming region inside a continent? (3) Why were plate speeds measured from magnetic stripes long before satellites could measure them?
Solution
Solution of Exercise 13.13.
(1) Ten times the scatter is : years, about eight months. (2) years. (3) Over millions of years the plates move tens to hundreds of kilometres, distances that the magnetic stripes record and that were easy to measure at sea; positioning precise to a few millimetres, which makes a motion visible in months, came much later.
Exercise 13.14 ★★★
On the Mid-Atlantic Ridge at South ( West), the rotation poles give the South American plate the velocity and the African plate , in millimetres a year (east, north). (1) Find the velocity of South America relative to Africa, its speed and its direction. (2) Deduce the full and the half spreading rates of the ridge. (3) The sediments of the South Atlantic gave a half rate of about a year averaged over the last 66 million years (Chapter 10). Compare, and suggest what the difference may mean.
Solution
Solution of Exercise 13.14.
(1) In millimetres a year,
The speed is a year, and gives south of west. (2) The full spreading rate is about a year, the half rate about a year. (3) The half rate of the last few million years, a year, is a little smaller than the a year averaged over 66 million years: the South Atlantic may have opened slightly more slowly recently than on average, or the difference may come from the uncertainties of the sediment ages. Both measurements agree that the ridge is slow.
Exercise 13.15 ★★★
A station moves steadily a year east. Exactly halfway through ten years of measurement, an earthquake shifts it suddenly by toward the west. (1) Sketch its east position against time. (2) What speed would one find from the first and the last positions alone? (3) What speed do the two halves of the series give, each on its own? (4) How should a geodesist deal with such a jump?
Solution
Solution of Exercise 13.15.
(1) A straight line rising by a year, a sudden drop of after five years, then a line rising again with the same slope. (2) The station ends at east of its start: a year, a quarter too small. (3) Each half gives a year. (4) The jump is a separate, sudden motion caused by the earthquake: the geodesist measures its size from the positions just before and just after it, removes it from the series (or fits the two parts with the same slope and a step between them), and keeps a year as the velocity of the station.
13.6 Problem: Reading the Hawaiian–Emperor Chain
Problem 13.1
Weekend problem — a plate’s speed written in volcanoes
The table gives the distance from Kilauea, measured along the chain, and the potassium–argon age of thirteen volcanoes of the Hawaiian–Emperor chain. Kilauea is the active volcano over the hotspot; the bend lies between Abbott and Daikakuji.
| volcano | distance () | age () | volcano | distance () | age () |
|---|---|---|---|---|---|
| Mauna Kea | 54 | 0.375 | Abbott | 3280 | 38.7 |
| Kauai | 519 | 5.1 | Daikakuji | 3493 | 42.4 |
| Nihoa | 780 | 7.2 | Koko (south) | 3758 | 48.1 |
| Necker | 1058 | 10.3 | Ojin | 4102 | 55.2 |
| Laysan | 1818 | 19.9 | Nintoku | 4452 | 56.2 |
| Midway | 2432 | 27.7 | Suiko (centre) | 4860 | 64.7 |
| Colahan | 3128 | 38.6 |
Part I — Ages and distances.
- Which volcano of the table is the youngest, and which the oldest? How do the ages change along the chain?
- Show that a distance in kilometres divided by an age in millions of years is a speed in millimetres a year.
- Compute the average speed given by Kauai.
- Compute for Necker, Laysan, Midway, Colahan and Abbott.
- Plot the age against the distance for the eight volcanoes of the table that lie before the bend. Do the points lie close to a straight line through the origin?
Part II — The plate’s speed over the hotspot.
- Explain why, for a fixed hotspot and a plate moving at a steady speed , the age and the distance satisfy .
- Compute the mean of the five speeds of question 4.
- The straight line through the origin that best fits all 26 dated volcanoes of the Hawaiian chain gives per million years. Compare with question 7.
- At this speed, how long would the plate take to carry Kauai from the hotspot to its present place? Compare with its age.
- In which direction does the Pacific plate move over the hotspot?
Part III — The bend.
- Compute the average speed of the plate between the times Daikakuji and Suiko (centre) were built.
- The best straight line through the nine dated volcanoes from Daikakuji onward gives per million years. Compare with the speed along the Hawaiian chain.
- Newer ages place the start of the bend near the Kimmei seamount, from Kilauea, about 50 million years ago. What average speed does that give for the whole Hawaiian chain? Compare with per million years, and explain why both can be right.
- If the hotspot stayed fixed, what does the bend record about the Pacific plate?
- The newer dating found large changes of speed along the Emperor chain with little change in its direction. Explain why the direction of a chain and the spacing of its ages are two independent pieces of information.
Part IV — Comparison with today’s satellite measurement.
- The Mauna Kea station moves a year east and a year north. Find its speed and its direction.
- The Hawaiian chain runs from Kilauea toward the west-north-west. Is the direction of the station consistent with it?
- The station gives a year, the chain a year. Give two reasons why the two numbers need not be equal.
- At per million years, how long will the plate take to carry Mauna Kea another away from the hotspot?
- Conclude: at what speed has the Pacific plate moved over the Hawaiian hotspot during the last 40 million years?
Solution
Solution of Problem 13.1.
1. Mauna Kea ( million years) is the youngest, Suiko (centre) ( million years) the oldest. The ages increase with the distance from Kilauea.
2. and one million years is years: per million years is years, a year.
3. a year.
4. Necker ; Laysan ; Midway ; Colahan ; Abbott (millimetres a year).
5. The points (54; 0.375), (519; 5.1), (780; 7.2), (1058; 10.3), (1818; 19.9), (2432; 27.7), (3128; 38.6), (3280; 38.7) lie close to a straight line through the origin, with some scatter (against a line of per million years, Kauai, Nihoa and Necker lie a little below it, Laysan on it, Colahan and Abbott a little above).
6. Each volcano was built over the hotspot and has moved with the plate since then. In the time , the plate has moved in a steady direction, so the volcano lies at from the point now over the hotspot: .
7. a year.
8. 89.5 against per million years: they differ by less than .
9. million years, against an age of million years: close, Kauai being slightly younger than the average line predicts.
10. The volcanoes are older and older toward the west-north-west: the plate carries them in that direction. The Pacific plate moves toward the west-north-west over the hotspot.
11. per million years, about a year.
12. : along the Emperor chain the plate moved about more slowly than along the Hawaiian chain.
13. per million years, about a year, less than per million years. The line through the origin uses the 1987 ages, which put the end of the Hawaiian chain at 39 to 43 million years; the newer age of about 50 million years for the start of the bend spreads the same distance over a longer time. Both are right if the plate moved more slowly in the early part of the Hawaiian chain and faster later: the speed was not constant.
14. A change in the direction of motion of the Pacific plate, about 50 million years ago.
15. The direction of the chain is the direction in which the plate moved; the spacing of the ages along it is its speed. A plate can speed up or slow down without turning, or turn without changing speed, so the two are independent. Changes of speed with no change of direction along the Emperor chain show that its speed record and the bend are separate events: the bend was not made by the hotspot slowing down.
16. a year, and gives north of west.
17. West-north-west is north of west, north-west : the station’s direction, north of west, lies between the two, close to the direction of the chain. It is consistent.
18. The station’s velocity is measured with respect to a frame in which the lithosphere as a whole does not turn, while the chain gives the motion with respect to the hotspot: if the two frames move with respect to each other, the speeds differ. And the station measures the last 30 years, the chain the last 40 million years, during which the speed may have changed. The scatter of the ages also leaves an uncertainty of a few millimetres a year on the speed of the chain.
19. million years.
20. The Pacific plate has moved over the Hawaiian hotspot at about a year during the last 40 million years, toward the west-north-west; before the bend it moved more slowly, and in another direction.