High School Earth and Space Sciences · Grades 10–12
12Lithosphere and Asthenosphere
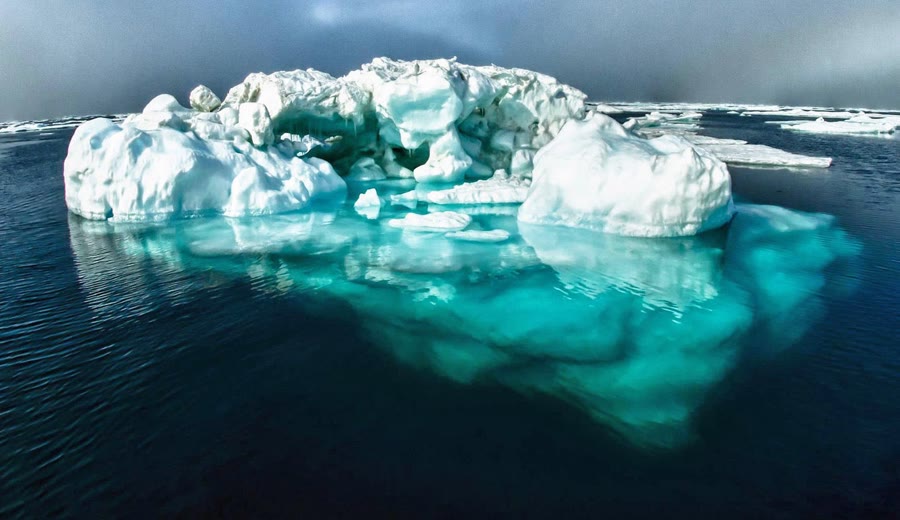
Nine tenths of an iceberg lie under water: the ice floats because it is a little less dense than the sea, and it sinks into the water until the water it pushes aside weighs as much as the whole iceberg. Mountain ranges behave in much the same way. Under the highest of them the crust is nearly twice as thick as usual, and most of that extra crust lies hidden underneath, like the ice under the waterline. But an iceberg floats in a liquid, and the mantle beneath a mountain range is solid rock. This chapter shows how a solid can behave like a fluid on which the outer shell of the Earth floats, and what that shell is.
You already know
The Earth has a crust, a mantle and a core (Book 1, grade 6). The Moho, at the base of the crust, lies about down under the continents on average and a few kilometres below the ocean floor; seismic speeds and densities are known at every depth from a reference Earth model (Chapter 11). The rock gets hotter with depth, by about 25 to per kilometre near the surface (Book 1, grade 6). A body floating in a liquid pushes aside a weight of liquid equal to its own weight, and the pressure at the bottom of a column of material is the weight of the column divided by its area (the physics books).
12.1 Two ways to layer the Earth
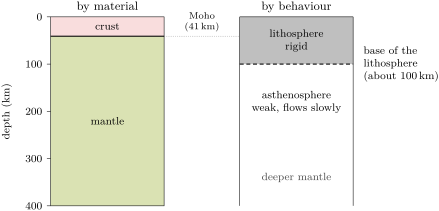
The crust, the mantle and the core are layers of different materials: the crust is made of rocks rich in silicon, aluminium and oxygen, the mantle of a denser rock, the core of metal. But the outer part of the Earth can also be divided by how its rock behaves when forces act on it for a very long time.
Definition 12.1 (Lithosphere; asthenosphere)
The lithosphere is the rigid outer shell of the Earth: the crust and the uppermost, coldest part of the mantle, which together break into the tectonic plates and do not flow. The asthenosphere is the layer of the mantle beneath the lithosphere, hotter and weaker, which flows slowly over long spans of time, like a very stiff paste.
The boundary between the two lies about 70 to down under the oceans and most continents, and deeper under the oldest parts of the continents; across the United States, for instance, the lithosphere is from about thick in the west to more than thick in the middle of the continent. The base of the lithosphere is not the Moho: most of the lithosphere is mantle rock.
12.2 The low-velocity zone
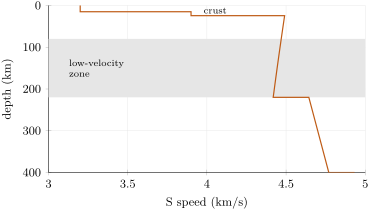
Seismic waves show the asthenosphere. Almost everywhere in the Earth, seismic speeds increase with depth, because the rock is more and more squeezed. Under the lithosphere the opposite happens.
Definition 12.2 (Low-velocity zone)
The low-velocity zone is the layer of the upper mantle, below the lithosphere, in which seismic waves travel more slowly than in the rock above and below it.
In the reference Earth model, the S speed falls slowly from the Moho down to , then jumps up. Seismic studies all over the world find a sharp drop of speed somewhere between 70 and : the top of the asthenosphere. The rock there is hot enough to be close to melting, and may contain a very little melt; it may also hold more water than the rock above. Rock close to melting is weak: it slows seismic waves, and it can flow.
12.3 The geotherm
Definition 12.3 (Geotherm; geothermal gradient)
A geotherm is the curve of temperature against depth beneath a place. The geothermal gradient is the rise of temperature per unit of depth, in degrees per kilometre.
Boreholes measure the geotherm only in the first few kilometres, where the temperature rises by 25 to per kilometre (Book 1, grade 6). Deeper, it is computed from the heat that flows out through the surface and from the properties of the rocks; Chapter 24 shows where that heat comes from. Two facts shape the result. Part of the heat is made inside the upper crust itself, so the gradient is steepest near the surface and smaller below the crust. And in the asthenosphere, which flows, the slow motion of the rock carries the heat and evens out the temperature: it rises only about per kilometre. The base of the lithosphere is placed where the steep geotherm of the lithosphere meets the gentle one of the asthenosphere, at about .
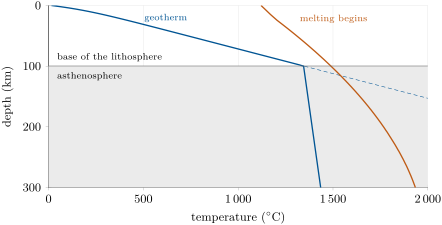
The melting temperature of the mantle rock rises with depth, because the rock is more and more squeezed (Book 1, grade 6): about at the surface, nearly at . In the model, the geotherm comes closest to it just below the lithosphere, about short of it. A little water, or a slightly hotter mantle, closes the gap: in the west of the United States, where the lithosphere is thin, a little of the mantle beneath it is partly molten.
12.4 Isostasy
12.4.1 Floating on a solid
Over the few seconds of an earthquake wave, the asthenosphere is a solid. Over long spans of time, it flows. A load placed on the lithosphere — a mountain range, an ice sheet — slowly pushes the asthenosphere aside until the load floats, like a block of wood on water.
Definition 12.4 (Isostasy; compensation depth)
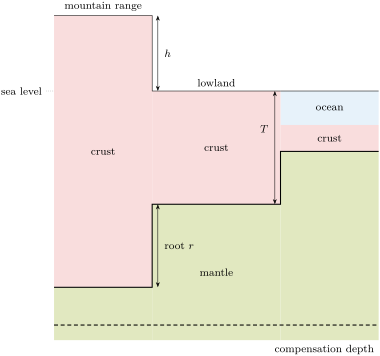
Isostasy is the balance in which the outer layers of the Earth float on the asthenosphere: at a depth in the mantle called the compensation depth, every column of rock of the same cross-section, from the surface down to that depth, has the same weight, whatever the relief above it.
12.4.2 The root of a mountain range
Proposition 12.5 (Airy isostasy)
Let the crust have a uniform density , and the mantle beneath it a density . If a region stands a height above another one and both are in isostatic balance, its crust is thicker by
of which stands above the other region and a root reaches below its crust.
Proof. Take two columns of the same area , the lowland with a crust of thickness and the range, whose crust stands higher and reaches deeper, so that its thickness is . Down to a compensation depth below both Mohos, the range column has more crust; the lowland column has, instead, mantle over the thickness . With the acceleration of gravity, the two weights are equal when
The crust is thicker by . ∎
With the mean density of the continental crust, , and that of the mantle just below the Moho, , the root is times the height, and the crust is thicker by about times the height: a range above its surroundings has a root of about .
Method 12.6 (Computing a root)
- Find the height of the region above a reference region whose crust thickness is known.
- Compute with the densities of crust and mantle.
- The crust is thicker than the reference crust by ; the root alone is that minus .
Example 12.7 (A plateau high)
A plateau stands above a lowland whose crust is thick. Its crust is thicker by : about in all, with a root of about .
12.4.3 Why the continents stand high
Definition 12.8 (Hypsometric curve)
The hypsometric curve of the Earth gives, for each elevation, the fraction of the Earth’s surface that lies higher than it. Its slope shows how much of the surface lies at each elevation.
If the surface had been shaped by chance, most of it would lie near one average level. It does not.
Proposition 12.9 (Two levels)
The elevations of the Earth’s surface cluster around two levels: one within a few hundred metres of sea level, on the continents, and one about 4 to below sea level, on the deep ocean floor. Land covers of the surface; more than half of the surface lies deeper than below sea level, and only rises higher than .
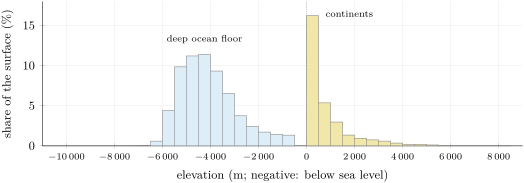
Isostasy explains the two levels. The continents are made of a thick crust, about on average, of light rock; the ocean floor of a thin crust of denser rock, only about thick. Both float on the asthenosphere: the thick, light continental crust floats high, the thin, dense oceanic crust low, and the oceans fill the low ground.
12.5 A flexible lid
Isostasy needs the asthenosphere to flow. The lithosphere above it does not flow; it bends. A load narrower than the thickness of the lithosphere, such as a single volcanic island, is carried by the stiffness of the plate, like a weight on a plank, and the plate sags around it. A load much wider than that thickness, such as a whole mountain range or an ice sheet, sinks until it floats. When the load is removed, the lithosphere slowly rises again (Chapter 23).
12.6 Exercises
Exercise 12.1 ★
Define the lithosphere and the asthenosphere. Which of the following belong to the lithosphere: the oceanic crust, the continental crust, the uppermost mantle, the outer core?
Solution
Solution of Exercise 12.1.
The lithosphere is the rigid outer shell of the Earth, made of the crust and the uppermost mantle; the asthenosphere is the hotter, weaker mantle beneath it, which flows slowly over long times. The oceanic crust, the continental crust and the uppermost mantle belong to the lithosphere; the outer core does not.
Exercise 12.2 ★
An iceberg of density floats in sea water of density . What fraction of its volume lies under water? If an iceberg with vertical sides stands above the water, what is its total height?
Solution
Solution of Exercise 12.2.
The iceberg sinks until it pushes aside its own weight of water: the fraction under water is , about . The fraction above is about , so the total height is , of which about lie under water.
Exercise 12.3 ★
The ground is at and the geothermal gradient is per kilometre. What is the temperature at the bottom of a borehole deep? Why can the same gradient not be used down to ?
Solution
Solution of Exercise 12.3.
. At the same gradient would give more than , far above the melting temperature of mantle rock; but S waves cross the upper mantle, which is therefore solid. The gradient must become much smaller with depth.
Exercise 12.4 ★
From the figure of the elevations of the Earth’s surface, give the two most common elevation bands and the share of the surface in each.
Solution
Solution of Exercise 12.4.
The band from 0 to above sea level, with about of the surface, and the band from 4000 to below sea level, with about (the band from 4500 to below is almost as large).
Exercise 12.5 ★
With the formula (temperature in , pressure in gigapascals), compute the temperature at which dry mantle rock begins to melt at the surface () and at , about down.
Solution
Solution of Exercise 12.5.
At : . At : .
Exercise 12.6 ★★
On the figure of the model geotherm, read the temperature at 50, 150 and . In which layer, lithosphere or asthenosphere, is each depth? Between which two of these depths does the temperature rise most?
Solution
Solution of Exercise 12.6.
About at (lithosphere), about at and at (asthenosphere). The temperature rises most between 50 and , by more than , because most of that interval lies in the lithosphere; between 150 and it rises by only about .
Exercise 12.7 ★★
A mountain range stands above a lowland; take and . Compute its root and the extra thickness of its crust.
Solution
Solution of Exercise 12.7.
Root: . Extra thickness: , that is the of the range plus its root.
Exercise 12.8 ★★
A region has a crust thick. With the densities of Exercise 12.7, how high does it stand above a region whose crust is thick?
Solution
Solution of Exercise 12.8.
The crust is thicker by , and , so .
Exercise 12.9 ★★
In the reference model, the S speed is at , just above and just below. Compute, in per cent, the decrease between 80 and and the jump at . Why is a decrease of speed with depth surprising?
Solution
Solution of Exercise 12.9.
Decrease: . Jump: . With depth the rock is more and more squeezed, which makes seismic waves faster; a decrease means that something else wins: the rock is hot and close to melting, and weaker.
Exercise 12.10 ★★
In the model geotherm, the temperature is at the Moho, down, and at the base of the lithosphere, down. (1) Compute the mean gradient between the two. (2) Compare with the gradient at the surface, per kilometre, and explain the difference.
Solution
Solution of Exercise 12.10.
(1) per kilometre. (2) That is about half the gradient at the surface. Part of the heat is made inside the upper crust; that heat must also cross the top layers to escape, which makes the gradient steeper near the surface. Below the crust only the heat coming from deeper down crosses the rock, and the gradient is smaller.
Exercise 12.11 ★★
In the asthenosphere the temperature is taken as (in , in kilometres). Compute it at 200 and . By how much does it rise between the two? Compare with the rise through the first , from at the surface to at the base of the lithosphere.
Solution
Solution of Exercise 12.11.
At : ; at : . The rise is over . Through the lithosphere the temperature rises by over only : about thirty times more per kilometre.
Exercise 12.12 ★★★
Below the upper crust, the model geotherm is close to (in , in kilometres), where the gradient depends on the heat coming from deeper down. (1) For per kilometre, as computed for the east of the United States, find the depth at which it meets . (2) Do the same for per kilometre, as computed for the Basin and Range province of the west. (3) Compare with the measured thicknesses, from about in the west to more than in the middle of the continent.
Solution
Solution of Exercise 12.12.
(1) gives . (2) gives . (3) The hotter west has a much thinner lithosphere, as measured (about at the thinnest); the very thick lithosphere of the middle of the continent needs an even smaller gradient.
Exercise 12.13 ★★★
(1) Show that, in Airy’s model, a region whose crust is thicker than a reference region stands higher by . (2) What fraction of any extra thickness of crust appears as height? (3) Compare with the fraction of an iceberg that stands above the water.
Solution
Solution of Exercise 12.13.
(1) By the proposition, , so . (2) : about one sixth of any extra crust shows as height, five sixths as root. (3) For the iceberg, the fraction above the water is : the same rule, (density of the fluid density of the floating body)/density of the fluid.
Exercise 12.14 ★★★
At the dry mantle rock begins to melt at , and the model geotherm is at . (1) By how many degrees would water have to lower the melting temperature for the rock to start melting there? (2) Why would even a very small fraction of melt make the rock weak and slow down seismic waves?
Solution
Solution of Exercise 12.14.
(1) . (2) A little melt gathers in thin films between the grains of the rock. The grains are then no longer firmly locked together: the rock resists shear less, so S waves slow down, and it can deform and flow far more easily.
Exercise 12.15 ★★★
Only of the Earth’s surface rises above , while lies more than below sea level. (1) If all the land were planed flat and its rock dumped into the oceans, would the surface end up near sea level? Use isostasy to explain your answer. (2) What does the existence of two levels tell us about the crust?
Solution
Solution of Exercise 12.15.
(1) No. Planing the land would make the continental crust a little thinner, but it would still be thick and light, and would still float much higher than the thin, dense crust of the ocean floor; the oceans would still fill the basins between the continents. (2) There are two kinds of crust, of different thickness and density: a thick, light continental crust and a thin, dense oceanic crust.
12.7 Problem: Why Tibet Stands Five Kilometres High
Problem 12.1
Weekend problem — weighing a plateau
The Tibetan plateau is the largest high region on Earth. Between latitudes and North and longitudes and East, its mean elevation is ; the mean elevation of all the land outside Antarctica is . The continental crust is thick on average and has a mean density ; the mantle just below the Moho has the density .
Part I — The plateau and an average continent.
- How much higher than the average continent does the plateau stand?
- By what percentage is the crust less dense than the mantle beneath it?
- A block of crust floating freely on mantle rock would sink until what fraction of its thickness lay below the mantle’s surface? Compare with the iceberg ( in ).
- The mantle is solid. Over which spans of time does it behave as a solid, and over which can it behave like the water around an iceberg?
- Why must the compensation depth be chosen below the Moho of both columns?
Part II — Airy’s balance for two columns.
- Draw the two columns, the average continent and the plateau, from their surfaces down to a depth of below sea level, with the plateau’s crust thicker by .
- Write that the two columns weigh the same, and deduce in terms of the height difference and of the densities.
- Compute .
- Compute the root of the plateau below the Moho of the average continent.
- How deep below sea level is the Moho of the average continent, and how deep is that of the plateau?
Part III — The thickness of the crust.
- Compute the thickness of the crust under the plateau.
- Check the balance: compute, for each column, the mass of rock above a square metre down to below sea level, in tonnes.
- How thick would the crust be under a lowland at sea level?
- How many times thicker than the average continental crust is the crust under Tibet?
- If the mantle were a little lighter, , what thickness would the model give? Is the result very sensitive to the densities?
Part IV — Comparison with the seismic measurements.
- Seismic waves converted at the Moho place it about down beneath northern Tibet. Compare with question 11.
- Just north of the plateau, the Qaidam basin stands at a mean elevation of , and its Moho lies about down. What crust thickness does Airy’s model predict there?
- The Qaidam basin is filled with several kilometres of sediments, lighter than average crust. Does that make the real crust thinner or thicker than the model’s? Explain.
- What property of the asthenosphere makes such a balance possible?
- Conclude: how thick is the crust under Tibet, and why does the plateau stand five kilometres high?
Solution
Solution of Problem 12.1.
1. .
2. .
3. The fraction would lie below; the iceberg sinks a little deeper, , because ice is closer in density to water than crust is to mantle.
4. For the seconds of a seismic wave, or the time of an earthquake, the mantle is a solid; only over very long times does the asthenosphere flow and let the crust float.
5. Below the deepest Moho, both columns are made of the same mantle rock at the same depths, and they weigh the same there; all the differences lie above that depth and must be included.
6. The average continent: crust from above to below sea level, then mantle down to . The plateau: crust from above sea level down to a Moho deeper by the root, then mantle down to .
7. The plateau column has more crust, the continent column has mantle over the thickness instead: , so and .
8. .
9. ; the root is .
10. The average continent’s Moho lies below sea level; the plateau’s lies below sea level.
11. .
12. One kilometre of rock above a square metre has a mass of : tonnes of crust or tonnes of mantle. Continent: tonnes. Plateau: tonnes. The two are equal.
13. .
14. times.
15. , , and a crust of about . A change of about in the mantle’s density changes the thickness by about : the result depends noticeably on the densities, but stays close to .
16. The model gives about , the seismic waves about : they agree within a few per cent.
17. , , and a crust of about , some more than measured.
18. Thinner. A column whose upper part is lighter than average weighs less for the same thickness, so it floats higher: a lighter crust needs a smaller root to stand at a given height. The real crust can therefore be thinner than the model’s, as measured.
19. Over long times the asthenosphere flows: it moves aside under a heavy column and comes back under a light one, until the columns balance.
20. The crust under Tibet is about thick, much more than the of an average continent: the plateau stands five kilometres high because its thick, light crust floats on the denser mantle, with a root of more than .