书籍暂未推出简体中文版——当前显示英文版。
High School Earth and Space Sciences · 10–12 年级
6The Layered Ocean
On a summer day you swim out from a beach into water that is pleasantly warm. Then you let your legs hang down — and your feet find water that is suddenly cold, a couple of metres below the surface. The sea is not mixed from top to bottom: it is made of layers, warm and light above, cold and dense below. In the open ocean the same layering reaches down kilometres, and it decides where the sea is a desert and where it teems with life. This chapter looks at the ocean in depth: how it is measured, how its temperature and salinity change downwards, why the layers are stable, and where cold deep water comes back up to the surface.
You already know
Seawater contains dissolved salts: its salinity, about 35 grams of salt per kilogram of seawater on average, varies from sea to sea. Winds drive the surface currents and the great circular gyres; deep currents of cold, salty water move slowly along the ocean floor (Book 1, grade 8). Density is mass divided by volume (the physics books). The phytoplankton, microscopic algae, need light and mineral nutrients to grow by photosynthesis, and they feed the rest of the ocean’s food chains (the biology books).
6.1 Measuring the ocean
The ocean covers about million and is on average deep: some billion of water. Most of it lies far below the reach of light, and it can only be measured by sending instruments down.
From a ship, oceanographers lower on a cable a frame carrying sensors that measure the conductivity of the water (from which its salinity is computed), its temperature and the pressure (hence the depth), surrounded by a ring of bottles that are closed at chosen depths to bring water samples back on board. Since the year 2000 a fleet of robotic floats has added millions of profiles: each float drifts with the currents at a depth of , sinks every ten days or so to , then rises to the surface measuring temperature and salinity on the way, and sends its profile by satellite.
Figures as of 2026
The international Argo array counts close to 4000 active floats; its three millionth profile was collected in July 2024.
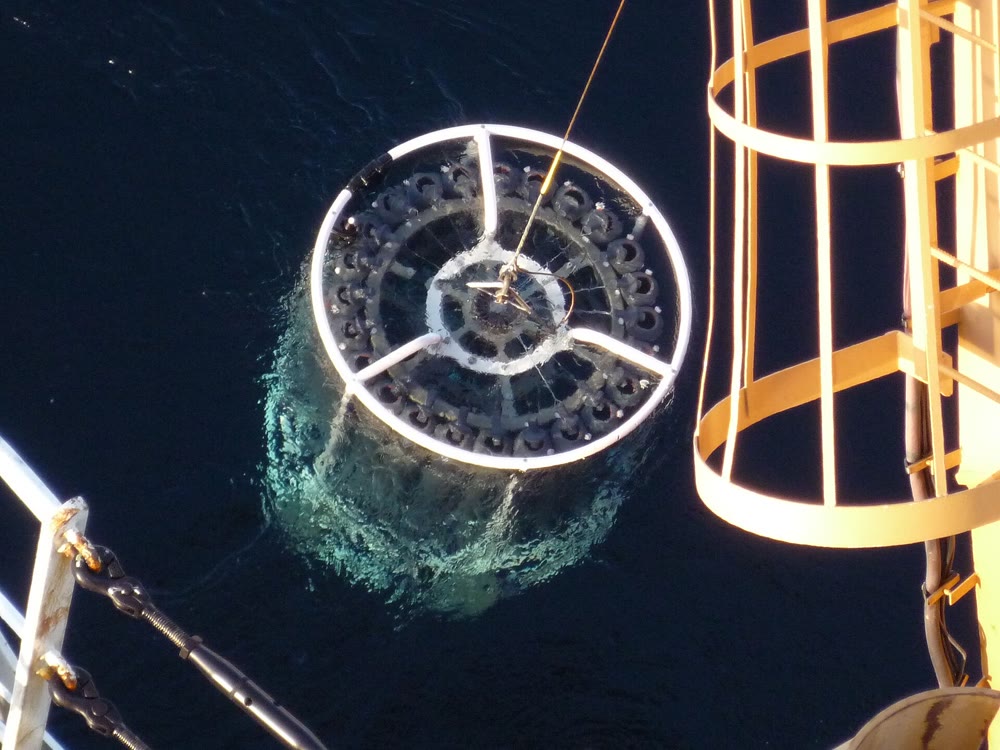
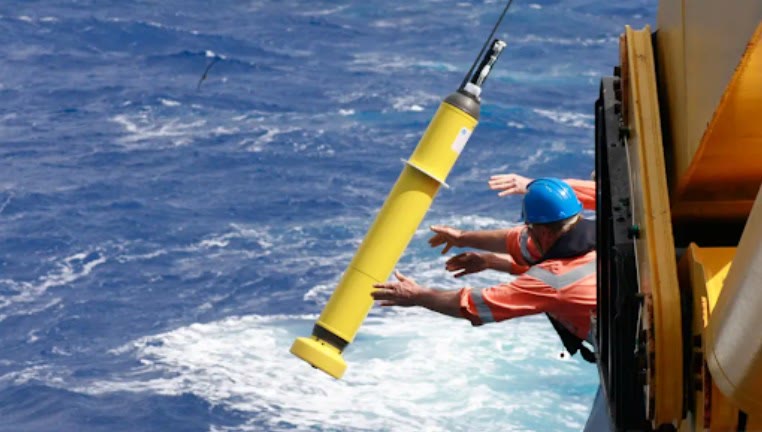
Averaged over decades of measurements, these profiles give a picture of the ocean in depth. The profiles of this chapter are such averages, from the World Ocean Atlas 2023 of the NOAA National Centers for Environmental Information.
6.2 Temperature with depth
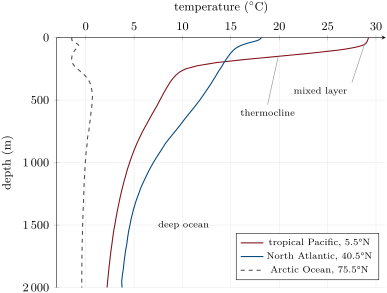
Sunlight heats the ocean from above, in its surface layer. The wind and the waves stir this warm water into a layer of almost uniform temperature. Below it, the temperature falls quickly over a few hundred metres; deeper still, it falls slowly to the cold water that fills the ocean basins.
Definition 6.1 (Mixed layer)
The mixed layer is the surface layer of the ocean, stirred by the wind and the waves, in which temperature and salinity hardly change with depth.
Definition 6.2 (Thermocline; halocline; pycnocline; deep ocean)
The thermocline is the layer below the mixed layer in which the temperature falls quickly with depth. The layer in which the salinity changes quickly with depth is a halocline; the layer in which the density increases quickly with depth is the pycnocline. Below them lies the deep ocean, cold and slowly changing.
In the tropical Pacific the mixed layer is at and some thick; between and the temperature drops by nearly nineteen degrees, and at it is down to . In the North Atlantic the surface is cooler and the fall more gradual. In the Arctic Ocean the whole column stays within two degrees of : there is no warm surface layer to speak of.
Method 6.3 (Reading an ocean profile)
- Find the axes: depth increases downwards, the measured quantity is read along the top.
- The mixed layer is the upper part where the curve is nearly vertical; its depth is where the curve starts to bend away (a common rule: where the temperature has fallen below its surface value).
- The thermocline is where the curve is closest to horizontal: the largest change for the smallest depth.
- Below, read the deep values and compare sites at the same depth.
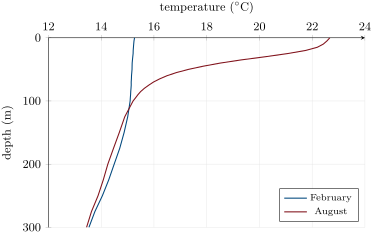
The mixed layer changes with the seasons. In winter the surface loses heat, storms stir the sea, and the mixed layer deepens; in summer the sun warms a thin surface layer that the gentler winds cannot mix downwards, and a seasonal thermocline forms near the surface — the cold water that the swimmer’s feet find.
6.3 Salinity and density
The density of seawater depends on its temperature and on its salinity. It is computed from an internationally agreed formula, the equation of state of seawater, fitted to laboratory measurements.
Proposition 6.4 (Density of seawater)
The density of seawater increases with its salinity and decreases as its temperature rises. At the pressure of the surface, seawater of salinity 35 has a density of at and at ; pure water at has a density of .
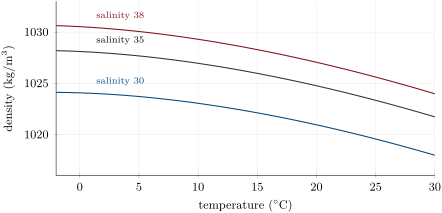
Two things show on the chart. One unit of salinity adds about . One degree of warming removes about at , at , but only near : in warm seas temperature controls the density, in cold seas salinity does.
Remark 6.5
The densities of this chapter are computed at the pressure of the surface. The pressure of the water above compresses seawater a little, by about per kilometre of depth; oceanographers compare water masses at the same pressure, so that only temperature and salinity count.
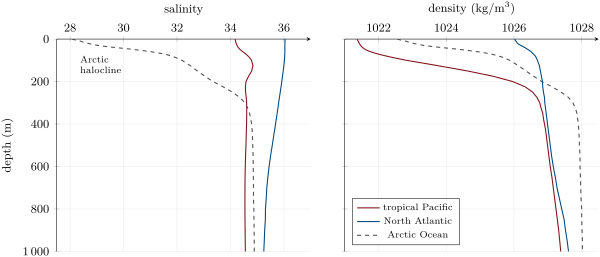
In the tropical Pacific the pycnocline coincides with the thermocline. In the Arctic Ocean the temperature hardly changes, but the salinity rises from 28 at the surface, freshened by rivers and melting ice, to 34.8 at : the halocline is the pycnocline. In each case the density increases downwards.
Definition 6.6 (Stratification)
The ocean is stratified when its density increases with depth: lighter water lies on denser water, in layers.
A stratified ocean is stable. A parcel of water pushed down into denser water is lighter than its surroundings and floats back up; a parcel pushed up sinks back. To mix the layers, the wind must work against this, and the stronger the pycnocline, the harder it is: the thermocline is a lid that separates the surface from the deep ocean. The deep ocean is filled with water that sank long ago from the cold polar seas, where surface water becomes dense enough to sink (Book 1, grade 8).
6.4 Upwelling
Definition 6.7 (Upwelling)
Upwelling is the rise of cold water from below the surface layer, to replace surface water that the wind pushes away. It occurs along some coasts and in the open ocean.
Along a coast, the wind blowing parallel to the shore drags the surface water; because of the Earth’s rotation the water does not simply follow the wind but is turned away from it, to the right in the Northern Hemisphere and to the left in the Southern Hemisphere (how this works is the subject of the university volumes). Off Peru the wind blows along the shore towards the equator, and the surface water is pushed out to sea; cold water rises near the coast to take its place. Upwelling also takes place along the equator, where the trade winds drive the surface water away from it on both sides.
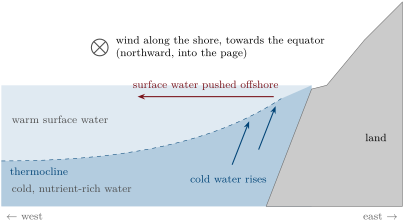
The water that rises is not only cold. Below the sunlit surface layer, the remains of dead plankton that sink and decay release the mineral nutrients that the phytoplankton need. Brought back into the light, these nutrients make the upwelling regions the most productive waters of the ocean, with the richest fishing grounds. Where the ocean is strongly stratified and nothing brings deep water up, the sunlit layer runs out of nutrients: the centres of the subtropical gyres are the deserts of the ocean.
6.5 Exercises
Exercise 6.1 ★
Define the mixed layer and the thermocline. What stirs the mixed layer?
Solution
Solution of Exercise 6.1.
The mixed layer is the surface layer of the ocean in which temperature and salinity hardly change with depth; the thermocline is the layer below it in which the temperature falls quickly with depth. The wind and the waves stir the mixed layer (helped in winter by the cooling of the surface).
Exercise 6.2 ★
Define upwelling. Why are the waters of upwelling regions rich in life?
Solution
Solution of Exercise 6.2.
Upwelling is the rise of cold water from below the surface layer, replacing surface water pushed away by the wind. The rising water brings mineral nutrients into the sunlit layer, where the phytoplankton use them to grow; the phytoplankton feed the rest of the food chain.
Exercise 6.3 ★
Using the temperature profiles of the three sites, give the temperature at the surface and at in the tropical Pacific and in the Arctic Ocean.
Solution
Solution of Exercise 6.3.
Tropical Pacific: about at the surface and at . Arctic Ocean: about at the surface and close to at .
Exercise 6.4 ★
Which is denser, seawater of salinity 35 at or at ? Seawater of salinity 35 or pure water, at the same temperature? Use the values of the chapter.
Solution
Solution of Exercise 6.4.
At ( against at ). Seawater: at pure water has a density of , seawater of salinity 35 about (read on the chart).
Exercise 6.5 ★
Explain how a profiling float measures a profile of the ocean, and why floats are useful where ships rarely go.
Solution
Solution of Exercise 6.5.
The float drifts at , sinks to , then rises to the surface measuring temperature, salinity (from the conductivity) and pressure on the way; at the surface it sends its profile by satellite and sinks again. Floats drift with the currents all over the ocean and work for years, in all seasons, far from the ship routes.
Exercise 6.6 ★★
The ocean covers million with a mean depth of . Compute its volume in cubic kilometres. What fraction of its depth does the top represent?
Solution
Solution of Exercise 6.6.
, about billion cubic kilometres. : under of the mean depth.
Exercise 6.7 ★★
In the North Atlantic profile of August, the temperature is at the surface, at , at and at . Using the rule of the method, estimate the depth of the mixed layer. What is the average rate of fall of temperature between and , in degrees per metre?
Solution
Solution of Exercise 6.7.
, reached at : the mixed layer is about deep. Between and : per metre.
Exercise 6.8 ★★
At the same North Atlantic site the surface is at in February and in August, while at it is at in both months. Explain why the deep water does not follow the seasons, and why the winter mixed layer is much deeper than the summer one.
Solution
Solution of Exercise 6.8.
The sun heats only the surface layer, and the seasonal heating and cooling are spread only through the mixed layer: below the thermocline the water is cut off from them. In winter the surface cools, becomes denser and sinks into the water below, and the storms stir the sea: the mixing goes deep. In summer the sun warms a light surface layer that floats on the colder water; the gentler winds cannot push it down, and the mixed layer stays thin.
Exercise 6.9 ★★
Near , one unit of salinity adds to the density and one degree of warming removes . How many degrees of warming cancel one unit of salinity? Answer the same question near , where one degree removes only . What do you conclude for the polar seas?
Solution
Solution of Exercise 6.9.
degrees near ; degrees near . In the cold polar seas small changes of salinity matter far more for the density than changes of temperature: there, salinity controls the layering.
Exercise 6.10 ★★
In the Arctic Ocean the water at the surface is at with a salinity of 28.1, and at at with a salinity of 33.3. Their densities are and . What makes the deeper water denser? Name the layer between them.
Solution
Solution of Exercise 6.10.
The temperature is the same: the deeper water is denser because it is saltier (33.3 against 28.1). The layer between them, where the salinity changes quickly with depth, is a halocline; here it is also the pycnocline.
Exercise 6.11 ★★
Explain why a stratified ocean is stable, using a parcel of surface water pushed down by a wave.
Solution
Solution of Exercise 6.11.
Pushed down, the parcel keeps its temperature and salinity, so its density. Surrounded by denser water, it is lighter than the water it displaces: the buoyancy pushes it back up to its own level. A parcel pushed up would be denser than its new surroundings and sink back. The layers are stable.
Exercise 6.12 ★★★
A litre of seawater of salinity 35 at is warmed to . Using the densities of the chapter, compute its mass, then its new volume. By how much has it expanded, in millilitres? A layer of ocean thick warms in the same proportion: how much does its thickness grow? (This is a large exaggeration of real ocean warming, used here only to show the effect.)
Solution
Solution of Exercise 6.12.
Mass: . New volume: , about : it has expanded by about , . The layer of would thicken by .
Exercise 6.13 ★★★
In the tropical Pacific the density is at and at ; in the North Atlantic in February the temperature hardly changes over the top . In which of the two would a storm find it easier to stir the water down to ? Explain.
Solution
Solution of Exercise 6.13.
In the North Atlantic in February. There the top has almost the same temperature, hence almost the same density: stirring it costs little. In the tropical Pacific the density rises by between and : a strong pycnocline, and the storm would have to push light water down into much denser water.
Exercise 6.14 ★★★
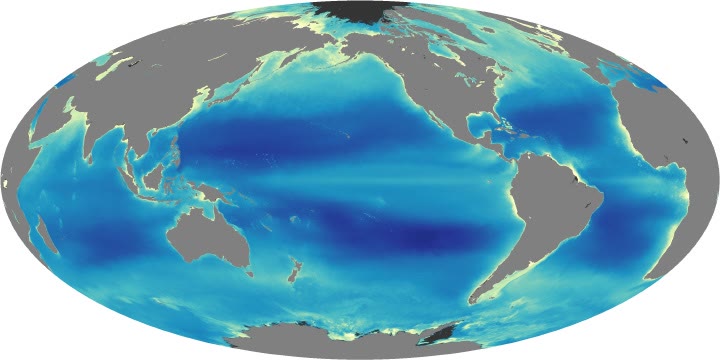
On the chlorophyll map, find two regions of high chlorophyll in the open ocean far from any coast, and one large region of very low chlorophyll. Using the chapter, explain each.
Solution
Solution of Exercise 6.14.
High chlorophyll far from coasts: the band along the equator in the Pacific (and in the Atlantic), where the trade winds drive an upwelling; and the high latitudes, such as the North Atlantic, where the winter mixed layer reaches deep and brings nutrients up. Very low chlorophyll: the centres of the subtropical gyres, strongly stratified, where nothing brings deep water up and the sunlit layer has run out of nutrients.
Exercise 6.15 ★★★
Suppose that a float sinks from to in six hours, then rises to the surface in ten hours. Compute its average vertical speed in each phase, in centimetres per second. If it measured every while rising, how many measurements does a profile contain, and what depth separates two of them on average?
Solution
Solution of Exercise 6.15.
Sinking: , about . Rising: , about . measurements, on average apart.
6.6 Problem: A Cast off Peru
Problem 6.1
Weekend problem — two profiles of the South Pacific
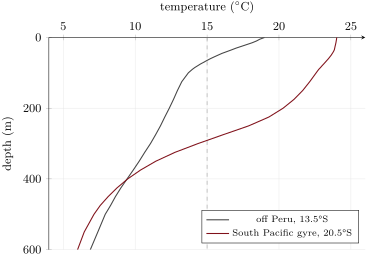
The table gives the average temperature and salinity, and the density computed at the pressure of the surface, at two places of the South Pacific: off Peru (, ) and in the middle of the subtropical gyre (, ).
| off Peru | gyre | |||||
| depth () | salinity | salinity | ||||
| 0 | 19.0 | 35.08 | 1025.08 | 24.0 | 36.41 | 1024.71 |
| 25 | 17.4 | 35.06 | 1025.47 | 23.9 | 36.39 | 1024.73 |
| 50 | 15.8 | 35.03 | 1025.83 | 23.6 | 36.38 | 1024.80 |
| 100 | 13.7 | 34.93 | 1026.20 | 22.6 | 36.27 | 1025.02 |
| 200 | 12.4 | 34.89 | 1026.44 | 20.3 | 35.80 | 1025.30 |
| 300 | 11.1 | 34.80 | 1026.62 | 14.4 | 34.76 | 1025.92 |
| 500 | 7.9 | 34.60 | 1026.97 | 7.1 | 34.39 | 1026.92 |
Part I — Reading the profiles.
- Which site is warmer at the surface, and by how much?
- Which site is farther from the equator? Is the difference of surface temperature what you would expect from the latitudes alone?
- Using the rule of the method, estimate the depth of the mixed layer in the gyre.
- Is there a mixed layer off Peru? Describe the top .
- Between which depths does the temperature fall fastest in the gyre? Give the rate, in degrees per hundred metres.
- At what depth, roughly, is the water at at each site?
Part II — Densities.
- Check that the density increases with depth at both sites. What does this tell you about their stability?
- In the gyre, the surface water is saltier than off Peru. Should this make it denser or lighter? Is it denser?
- Explain which of the two effects wins.
- Compute the increase in density from the surface to off Peru.
- Compute the same increase in the gyre.
Part III — Stratification compared.
- In the gyre, where is most of the density increase of the top found: above or below ?
- Off Peru, where is it found?
- At , compare the two sites. What does this suggest about the deep water below both?
- Explain in a few sentences how the thermocline off Peru has been lifted towards the surface.
- The phytoplankton live in the top few tens of metres. At which site is nutrient-rich water from below the thermocline within reach of the wind’s stirring? Explain.
Part IV — Why the Peruvian waters are productive.
- What would the surface water off Peru be like if the wind along the shore stopped blowing for months?
- Using the chlorophyll map, compare the two sites.
- Explain why the gyre is called a desert of the ocean although it is full of sunlight.
- Compute the ratio of the density increases from the surface to off Peru and in the gyre, and say what it shows.
Solution
Solution of Problem 6.1.
1. The gyre, by .
2. The gyre ( against ). Farther from the equator, it should be the cooler one: the latitudes alone cannot explain why it is warmer.
3. , reached between (23.6) and (22.6), at about .
4. No: the temperature falls steadily from the surface, by in the first and in the first ; the thermocline starts at the surface.
5. Between and : per hundred metres.
6. Off Peru, between and : about by interpolation (the full profile gives ). In the gyre, between and : about .
7. Yes, at every level of both columns: lighter water lies on denser water, and both columns are stable.
8. Saltier water should be denser; yet the gyre’s surface water is lighter: against .
9. The gyre’s water is about 1.3 units saltier, which adds about ; it is warmer, which removes about at these temperatures. The temperature wins.
10. .
11. .
12. From the surface to the density rises by , of which only above : most of it, , lies below , in the thermocline between and .
13. Off Peru the density rises by from the surface to , of which in the top : most of it is near the surface.
14. At the two sites are almost alike ( and , and ): the same cold water lies beneath both; the difference is how close it comes to the surface.
15. The wind blowing along the shore towards the equator pushes the surface water out to sea; water from below rises near the coast to take its place. The cold water of the thermocline is drawn up, so the thermocline slopes up towards the coast and reaches almost to the surface.
16. Off Peru: water at to , from below the thermocline, lies within the top , within reach of the wind’s stirring and of the light. In the gyre it lies below , under a warm, light layer that the wind cannot stir that deep.
17. The upwelling would stop: the surface water would warm in the sun, a warm light layer would form on top, and the supply of nutrients to the sunlit layer would dwindle.
18. The coast of Peru is light blue to yellow (much chlorophyll); the middle of the South Pacific gyre is among the darkest blue regions of the map (very little).
19. Phytoplankton need nutrients as well as light. In the gyre the strong stratification keeps the deep, nutrient-rich water far below the sunlit layer, and the nutrients of the surface layer have long been used up.
20. : the density increase over the top is about 2.3 times larger off Peru than in the gyre. The pycnocline, with the cold, nutrient-rich water beneath it, has been lifted into the top off Peru, while in the gyre it lies deeper, below .