书籍暂未推出简体中文版——当前显示英文版。
High School Earth and Space Sciences · 10–12 年级
27Reading Past Climates
At Dome C, high on the East Antarctic ice sheet, the air averages about over the year. A drill working there stopped at a depth of , about above the rock beneath the ice. The deepest ice it brought up holds tiny bubbles of air some years old: a sample of the atmosphere from long before the first farmers. This chapter reads the climate of the past in the ice, in the mud of lakes and of the ocean floor, and in the rocks, and asks what it says about today.
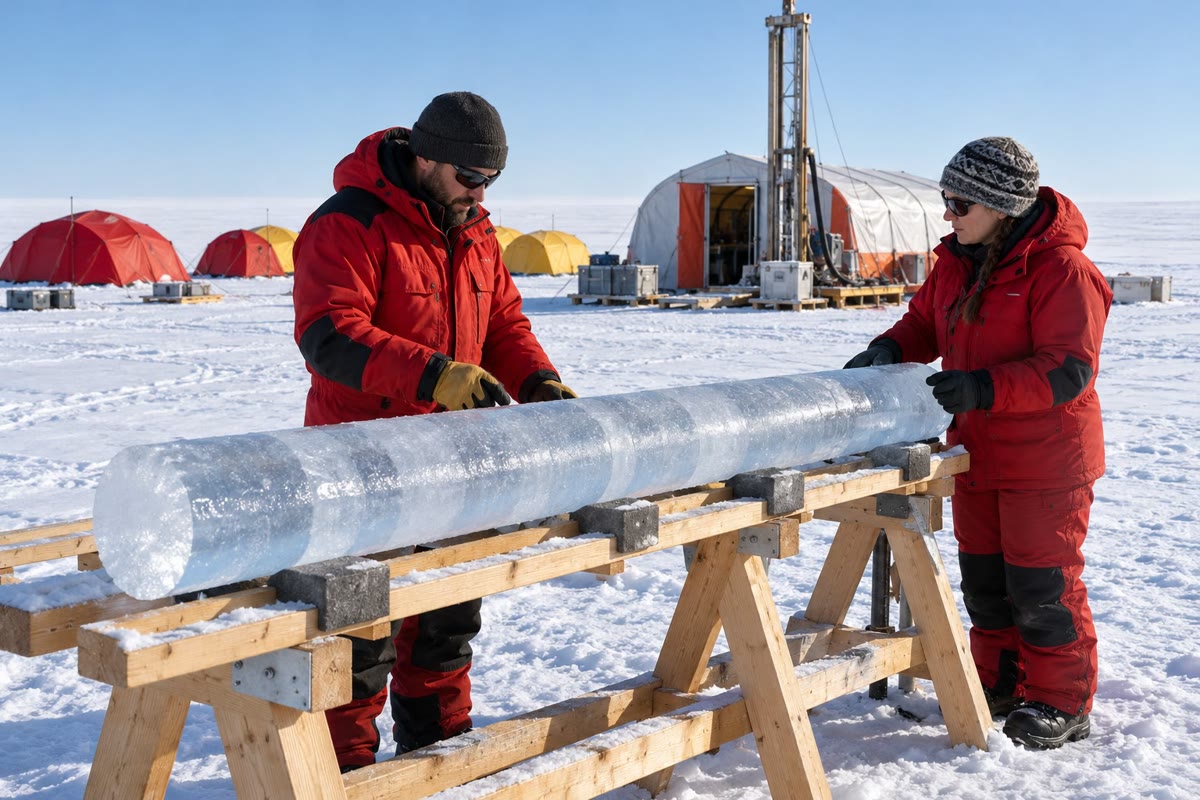
You already know
A glacier is a mass of ice that lasts from year to year and flows under its own weight; an ice sheet covers a large part of a continent; an ice age is a long cold time when ice sheets spread far beyond the poles (Book 1, grade 8). In the ice cores of Antarctica, the snow records the air temperature and the bubbles keep the air itself, and the two records rise and fall together (Book 1, grade 9). Atoms of one element may differ by their number of neutrons: these isotopes behave alike in chemistry but differ in mass (the physics books). Carbon dioxide is a greenhouse gas (the chemistry books). The Quaternary period began 2.58 million years ago (Book 1, grade 7).
27.1 Archives and proxies
Nobody measured the temperature of the air years ago. But the Earth kept records without meaning to: layers of ice and mud, shells and tree trunks, each of which changed with the climate in which it formed.
Definition 27.1 (Climate archive; proxy)
A climate archive is a natural material laid down in layers, one after another, that keeps a trace of the climate of the time it formed: polar ice, the sediments of lakes and of the ocean floor, the rings of trees, corals, cave deposits. A proxy is a quantity measured in an archive that stands in for a climate variable that was not measured: the share of heavy isotopes in old snow for the air temperature, the share of each kind of pollen in lake mud for the vegetation and so for the climate.
| archive | proxy | tells about |
|---|---|---|
| polar ice | heavy isotopes of the ice | air temperature over the ice |
| air in the bubbles | carbon dioxide, methane | |
| lake sediments, peat | pollen | vegetation, then climate |
| ocean sediments | oxygen isotopes of shells | ice volume, deep-water temperature |
| tree rings | ring width | growing conditions, year by year |
| corals, cave deposits | isotopes, growth bands | sea or air temperature, rain |
Every proxy needs two things before it can be read. It needs a clock: the age of each layer, from counting yearly layers where they can be seen, from radiometric dating (Chapter 25), or from matching the record with another one already dated. And it needs a calibration: the link between what is measured and the climate variable, found today, where both can be measured together.
Method 27.2 (Reading a proxy record)
- Find the archive and the proxy: what was measured, and in what?
- Find which way time runs on the axis, and in what unit; check whether the proxy axis is reversed.
- Translate the proxy: does a higher value mean warmer or colder, more ice or less?
- Note the spacing of the samples: a record whose points are years apart cannot show a change that lasted a century.
- Read the values at the dates asked, or the means over an interval, and compute changes and rates.
- Say what the record shows at its site, and only then whether it speaks for the whole Earth.
27.2 Ice cores
Definition 27.3 (Ice core)
An ice core is a cylinder of ice drilled out of an ice sheet or a glacier. Its depth gives the age of the ice, the deeper the older; the ice records the temperature of the air in which its snow fell, and its bubbles keep samples of the air of the time.
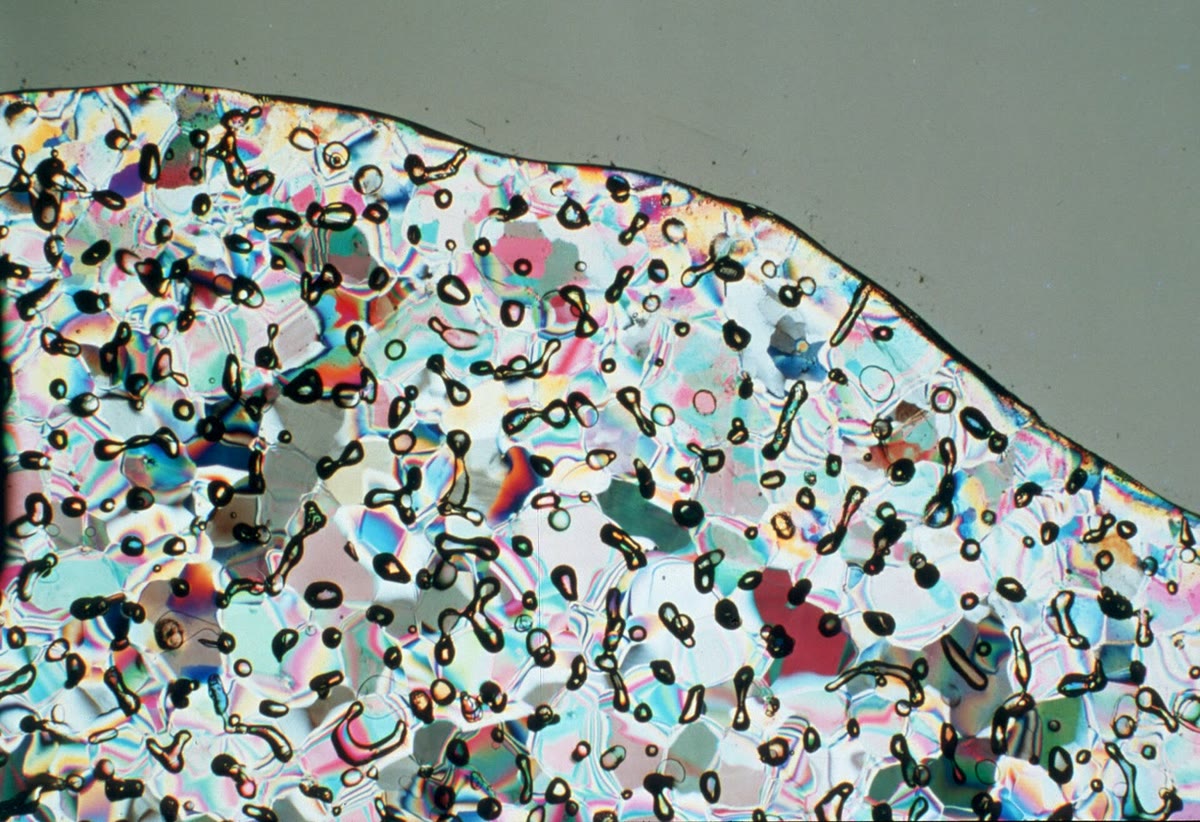
Fresh snow is mostly air. Buried under the snow of the following years, it is pressed into firn, a compacted snow whose pores still let air through. At a density of about 820 to , reached 50 to down, the pores close and the air is sealed in bubbles. The ice therefore keeps two different records. The air in the bubbles is a sample of the atmosphere, whose carbon dioxide and methane are measured in the laboratory. The ice itself holds the temperature: water molecules that contain a heavy isotope (deuterium or oxygen-18) condense more readily than the light ones, so the colder the air on the way to the pole, the poorer the snow becomes in heavy isotopes.
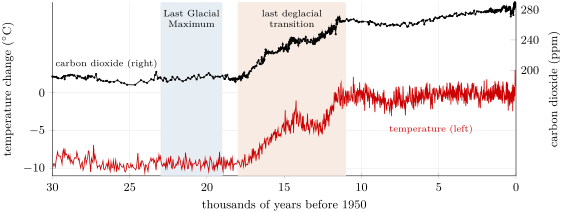
The deuterium of the Dome C core has been turned into a temperature over the ice, given as a change compared with the mean of the last thousand years. The carbon dioxide comes from the bubbles of several Antarctic cores, put together into one record. Both are drawn below on one time axis.
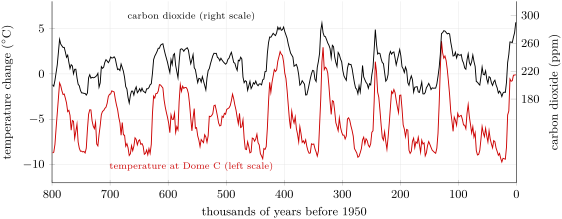
The two curves share one pattern: a slow, ragged slide into the cold over tens of thousands of years, then a fast climb back to warmth, then the slide again.
Definition 27.4 (Glacial period; interglacial; glacial cycle)
A glacial period is a cold interval within an ice age, during which the ice sheets grow far beyond their present size. An interglacial is a warm interval between two glacial periods, with ice sheets close to today’s or smaller; we live in one, which began about years ago. A glacial cycle is one glacial period with the interglacial that ends it.
Over the whole record, the temperature at Dome C ranges from , about years ago, to , about years ago; the carbon dioxide, from to . The figure, averaged over years, smooths these extremes a little. A count of the warm peaks gives eight or nine glacial cycles, and the strongest rhythm of the temperature record, computed from its data, has a period of about years.
Proposition 27.5 (Temperature and carbon dioxide vary together)
Over the last years, the Antarctic temperature and the carbon dioxide of the air varied together. Pairing each of the 1639 carbon dioxide measurements older than years with the Dome C temperature at the same age gives a correlation coefficient of , and the least-squares line
where is the temperature change at Dome C.
How it is computed. For each carbon dioxide sample, the temperature at its age is read in the Dome C record by interpolating between the two nearest temperature points. The correlation coefficient of the 1639 pairs, a number between and that measures how close the points lie to a straight line (the mathematics books), is computed with the least-squares line; both are computed in the figure script and checked by its test. ∎
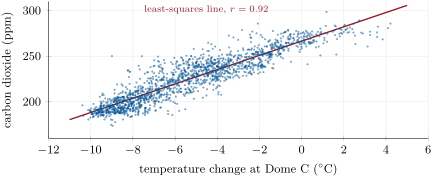
A correlation does not say which changed first, nor whether a third cause moved both: the coefficient would be the same if temperature drove carbon dioxide, if carbon dioxide drove temperature, or if each pushed the other. What sets the rhythm of about years is told in the section on the ocean below, and how carbon dioxide acts on temperature in Chapter 28.
27.2.1 The Last Glacial Maximum
Definition 27.6 (Last Glacial Maximum)
The Last Glacial Maximum is the time, about to years ago, when the ice sheets of the last glacial period were at their largest.
At the Last Glacial Maximum, ice sheets covered much of North America and of north-western Eurasia, and the climate was drier and dustier than today. The assessments estimate that the global surface temperature was to lower than in 1850–1900 (medium confidence), with the carbon dioxide at 188 to . The water locked in the ice sheets came from the ocean: global mean sea level stood 125 to below today’s.
A lower sea uncovers the shallow floor around the continents. The map below lowers the sea by , the middle of that range, over the floor of South-East Asia as it is today.
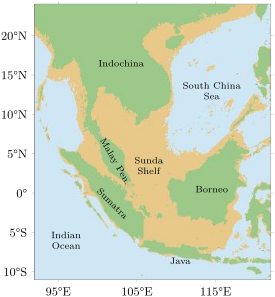
Borneo, Sumatra and Java become one land with the Malay Peninsula and Indochina: the Sunda Shelf, under a shallow sea today, was dry land. On the map, a fall of only about is enough to join Borneo to Asia, and Sumatra and Java join it sooner. On the map, the land above the sea grows from 4.11 to 7.16 million square kilometres, 1.74 times as much. Over the whole Earth, the same fall raises the share of the surface above the sea from to , about 23 million square kilometres of new land.
Example 27.7 (The last deglaciation)
The warming that followed the Last Glacial Maximum is called the last deglacial transition; the assessments place it between about and years ago. In the Dome C record, the mean temperature of the Last Glacial Maximum ( to years ago) is ; the mean of the following interval to years ago is . The air over Antarctica warmed by , while its carbon dioxide rose from to , by . Over the whole Earth, the warming was the assessed cooling of 5 to , about , spread over the years of the transition:
Sea level rose meanwhile from about to , about a year on average.
27.3 Pollen
Every spring, plants release clouds of pollen. Most of it is lost, but some falls on lakes and bogs, sinks, and is buried in the mud, where it keeps a record of the vegetation that grew around. And the grains of each kind of plant have their own shape and size.

Definition 27.8 (Pollen analysis)
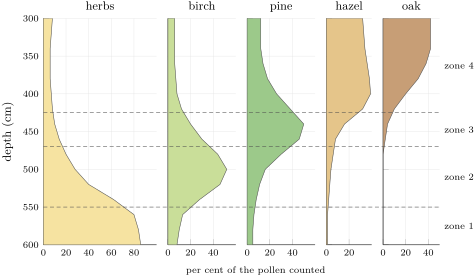
Pollen analysis is the reading of past vegetation from the pollen preserved in sediments: in each layer of a core, the grains are identified and counted, and the share of each kind of plant, in per cent of the grains counted, is plotted against depth in a pollen diagram.
Counting pollen in this way began with the Swedish geologist Lennart von Post, who presented the first modern pollen diagram, with numbers, in 1916; such a diagram shows depth down the page and one curve for each kind of plant. The vegetation, in its turn, speaks of the climate: grasses and other herbs with almost no trees mean an open, cold landscape, while oak and hazel need warm summers.
Method 27.9 (Reading a pollen diagram)
- Read the vertical axis: depth, the oldest layers at the bottom; turn depths into ages with the dates of the core.
- For each layer, find the plants with the largest shares.
- Divide the core into zones, each with its own set of dominant plants; place the limits where the curves change fastest.
- Name the vegetation of each zone (open herbs, birch woodland, pine forest, broadleaf forest) and the climate it needs.
- Read the zones from the bottom up as a history of the landscape.
In the diagram above, zone 1 is a landscape of herbs, with a few birches: the open, cold country left by the ice. In zone 2, birch spreads first, a hardy tree; pine follows in zone 3; and in zone 4 hazel and oak, which need warm summers, take over. Read from the bottom up, the core tells the end of the glacial period and the arrival of the warmth of the interglacial, as the forest moved back into the land.
27.4 Ocean sediments and the astronomical rhythm
On the floor of the open ocean, mud piles up slowly and without a break, layer upon layer, for millions of years. It is full of the shells of foraminifera: single-celled organisms whose shell, a fraction of a millimetre across, is often made of calcite. Some float near the surface; others live on the sea floor.
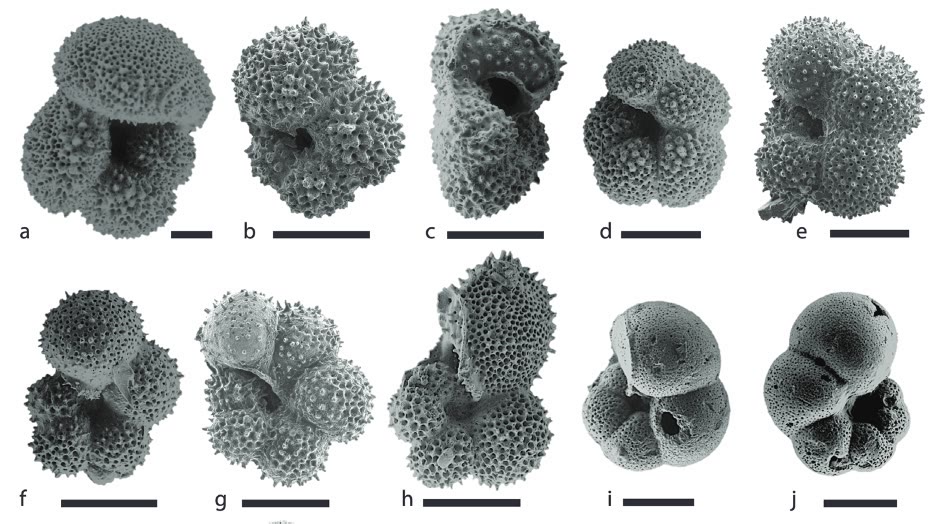
The oxygen of a shell comes from the sea water. Water made with the light isotope oxygen-16 evaporates more easily, and the snow that builds the ice sheets is therefore poor in oxygen-18. When the ice sheets grow, they store this light water, and the ocean left behind becomes richer in oxygen-18; so do the shells that grow in it, all the more as the water is colder. The share of oxygen-18 in the shells of the sea-floor foraminifera, written and given in parts per thousand, is thus a proxy for the volume of ice on land and for the temperature of the deep ocean: the higher it is, the more ice and the colder the water.
The record below, called LR04, stacks the measurements of 57 cores from all the oceans into one curve of 5.3 million years.
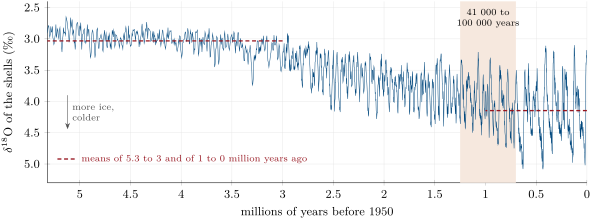
Read with the method above, the record says three things.
- The Earth has cooled and its ice has grown. The mean value rises from between 5.3 and 3 million years ago to over the last million years.
- The swings have grown. Glacial and interglacial times alternate all along the record, but they swing wider and wider: at the Last Glacial Maximum the value was , against today.
- The rhythm has changed. Between 2.6 and 1.3 million years ago, the strongest period of the record, computed from its data, is years; over the last years it is about years, the rhythm of the ice cores. The change took place between about 1.25 and 0.7 million years ago.
These periods are not chance. In 1976, James Hays, John Imbrie and Nicholas Shackleton found in the sediments of the southern oceans three rhythms, of , and about years, which are the periods of slow changes in the Earth’s orbit and axis: the precession of the axis, the tilt of the axis (about years) and the shape of the orbit (about years). These changes move the sunlight that each latitude receives in each season, and they set the pace of the glacial cycles. How they do so, and why the slow -year rhythm took over, is the subject of a university course.
Figures as of 2025
In January 2025, the Beyond EPICA project announced that a core drilled at Little Dome C, about from the Concordia station on Dome C, holds a continuous record back to about 1.2 million years in its upper . It covers the time when the glacial rhythm changed from to years, and the ice and its air are being analysed.
27.5 Climates of deep time
Further back than the ice cores, the climates of the past are read from sediments, fossil leaves and soils, and isotopes. The IPCC has picked a few reference periods, well studied, whose climates help to judge the changes of today and tomorrow. The chart below gives their global surface temperature, compared with 1850–1900.
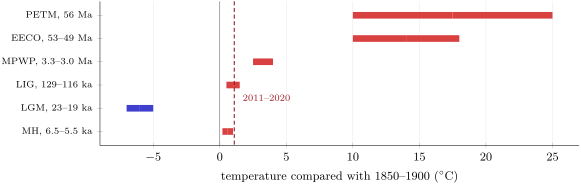
| period | temperature () | carbon dioxide (ppm) | sea level (m) |
|---|---|---|---|
| PETM, 56 Ma | to | about 900, rising to 2000 | — |
| EECO, 53–49 Ma | to | 1150 to 2500 | to |
| MPWP, 3.3–3.0 Ma | to | 360 to 420 | to |
| LIG, 129–116 ka | to | 266 to 282 | to |
| LGM, 23–19 ka | to | 188 to 194 | to |
| MH, 6.5–5.5 ka | to | 260 to 268 | to |
The Paleocene–Eocene Thermal Maximum was a sudden warming, when a large pulse of carbon reached the ocean and the air: the ocean became more acidic and poorer in oxygen, and many deep-sea species died out. In the Early Eocene Climatic Optimum, the carbon dioxide stayed above for millions of years, there was no polar ice, and forests close to tropical grew at south. The mid-Pliocene Warm Period is the last time the carbon dioxide was close to today’s: the Arctic was much warmer than now, and the sea stood higher. In the Last Interglacial, the Greenland and West Antarctic ice sheets were smaller and the sea higher than today, and hippopotamuses lived in Britain.
These archives put today in perspective, and the IPCC draws the comparison itself. In 2019 the carbon dioxide of the air was higher than at any time in at least two million years (high confidence), and the rises in carbon dioxide and methane since 1750 far exceed the natural changes between glacial and interglacial periods over at least years (very high confidence). The global surface temperature has risen faster since 1970 than in any other 50-year period over at least the last years (high confidence). The decade 2011–2020 was warmer than the warmest centuries of the present interglacial, about years ago, and close to the warmth of the Last Interglacial, about years ago (medium confidence).
The speed of the change can be compared too. From 1970 to 2025, the trend of the global temperature record is per decade, or about per thousand years if it were kept up; the warming out of the last glacial period averaged about per thousand years. The causes of today’s change, and what it may become, are the subject of Chapter 28.
27.6 Exercises
Exercise 27.1 ★
Give the term: (a) a quantity measured in an archive that stands in for an unmeasured climate variable; (b) a cylinder of ice drilled from an ice sheet; (c) a warm interval between two glacial periods; (d) the reading of past vegetation from fossil pollen; (e) the time, about to years ago, when the last ice sheets were largest.
Solution
Solution of Exercise 27.1.
(a) a proxy; (b) an ice core; (c) an interglacial; (d) pollen analysis; (e) the Last Glacial Maximum.
Exercise 27.2 ★
For each proxy, name its archive and what it tells about: (a) the air in bubbles; (b) the share of oak pollen; (c) the oxygen-18 of the shells of sea-floor foraminifera; (d) the width of tree rings.
Solution
Solution of Exercise 27.2.
(a) Polar ice: the carbon dioxide and methane of the air of the time. (b) Lake sediments or peat: the vegetation, here trees that need warm summers. (c) Ocean sediments: the volume of ice on land and the temperature of the deep ocean. (d) Trees: the growing conditions, year by year.
Exercise 27.3 ★
During the last deglacial transition, from about to years ago, sea level rose from about to . (a) Compute the mean rate of rise, in millimetres per year. (b) From 2006 to 2018, sea level rose by a year. Compare.
Solution
Solution of Exercise 27.3.
(a) in years: a year. (b) : the mean rise of the deglaciation was about 2.7 times faster than that of 2006–2018.
Exercise 27.4 ★
The global temperature rose by per decade from 1970 to 2025. Express this rate per century and per thousand years.
Solution
Solution of Exercise 27.4.
A century is ten decades: per century. A thousand years is a hundred decades: per thousand years.
Exercise 27.5 ★
Hays, Imbrie and Shackleton found three rhythms in ocean sediments: , and about years. (a) Match each with the precession of the axis, the tilt of the axis and the shape of the orbit. (b) How many -year cycles fit in years? How many -year cycles?
Solution
Solution of Exercise 27.5.
(a) years: the precession of the axis; years: the tilt of the axis; about years: the shape of the orbit. (b) cycles; cycles.
Exercise 27.6 ★★
The least-squares line of the chapter is (ppm, with in ). (a) Predict the carbon dioxide for the mean temperature of the Last Glacial Maximum at Dome C, , and compare with the measured . (b) Predict it for the warmest point, , and compare with the highest measured value, . (c) Use the line to estimate the Dome C temperature that would go with , the 2025 value at Mauna Loa. Why is this last use of the line not justified?
Solution
Solution of Exercise 27.6.
(a) : only above the measured . (b) , above the highest measured value: the warmest point lies below the line. (c) . The line only describes how the two quantities varied together, in natural cycles, within the range of the data ( to , 174 to ); it is not a law, and a value far outside that range cannot be read from it.
Exercise 27.7 ★★
Use the pollen diagram of the Varden Hills lake. (a) What is the dominant pollen at , and what landscape does it indicate? (b) The same question at . (c) Which tree spreads first after the cold, and which trees arrive last? (d) Why could the arrival of a tree lag behind the warming that allowed it?
Solution
Solution of Exercise 27.7.
(a) Herbs, : an open landscape with almost no trees, cold. (b) Oak () and hazel (): a broadleaf forest, with warm summers. (c) Birch spreads first, then pine; hazel and oak arrive last. (d) Trees spread only as fast as their seeds travel and their young trees grow, from the places where they survived the cold; a soil must also form. The forest can lag behind the climate.
Exercise 27.8 ★★
In the same core, the mud at is years old and that at years old, with a steady rate of deposition. (a) Compute this rate in millimetres per year. (b) Find the age of the limit between zones 2 and 3, at . (c) How many years does a slice thick represent?
Solution
Solution of Exercise 27.8.
(a) , that is , in years: a year. (b) years. (c) years.
Exercise 27.9 ★★
On the map of South-East Asia, the land above the sea grows from 4.11 to 7.16 million square kilometres when the sea is lowered by . (a) Compute the gain and its percentage. (b) On the map, a fall of about is enough to join Borneo to Asia. Was the island joined during the whole Last Glacial Maximum? Explain. (c) Why is the coastline of the map only approximate?
Solution
Solution of Exercise 27.9.
(a) million square kilometres, and more land. (b) Yes: at the Last Glacial Maximum the sea stood 125 to below today’s, far more than the that join Borneo to Asia on the map. (c) The map uses today’s sea floor, which has not stayed exactly the same since (sediments have been laid down on it, and the ground has moved a little); the grid is also coarse, one point every 0.1 degree, and the lowstand is only known to within about ten metres.
Exercise 27.10 ★★
In the LR04 record, the value at the Last Glacial Maximum is and today’s . (a) Which is the higher, and is that what you expect? Explain with the ice sheets. (b) Why is the vertical axis of the record drawn reversed?
Solution
Solution of Exercise 27.10.
(a) The value of the Last Glacial Maximum, , is the higher. This is expected: the large ice sheets of the time stored water poor in oxygen-18, which left the ocean, and the shells grown in it, richer in oxygen-18; the deep water was colder too. (b) So that cold, icy times plot low and warm times high, as on a temperature curve.
Exercise 27.11 ★★
A friend says: “The correlation of 0.92 between the Antarctic temperature and the carbon dioxide proves that carbon dioxide controlled the ice ages.” (a) What does a correlation show, and what does it not show? (b) Give two other explanations that would give the same correlation. (c) What kind of information about the two records would help to decide?
Solution
Solution of Exercise 27.11.
(a) A correlation shows that the two records rise and fall together, close to a straight line; it does not show which caused which, nor that either did. (b) A warmer climate could have released carbon dioxide into the air; or a third cause, such as the changes of the Earth’s orbit, could have moved both; or each could have pushed the other. (c) The timing of the changes, which came first, from a precise dating of the ice and of its air; and an understanding of how carbon dioxide acts on the Earth’s radiation (Chapter 28).
Exercise 27.12 ★★★
The strongest period of the LR04 record is years between 2.6 and 1.3 million years ago, and years over the last years. (a) How many cycles does each window hold? (b) Which change of the Earth’s orbit or axis matches each period? (c) Explain why a record with one sample every years can show these rhythms, but not a change that lasted a century.
Solution
Solution of Exercise 27.12.
(a) cycles between 2.6 and 1.3 million years ago; cycles over the last years. (b) years: the tilt of the axis; about years: the shape of the orbit. (c) A cycle of years is sampled about times, enough to draw it; a change lasting a century falls between two samples, or within one, and leaves almost no trace.
Exercise 27.13 ★★★
The rate of rise of carbon dioxide was 192 to per century in 1995–2014. During the Paleocene–Eocene Thermal Maximum it was 4 to per century, and during the last deglacial transition at most about per century. (a) How many times faster was the recent rise than the fastest rise of the last deglaciation? (b) Than the slowest and the fastest estimates of the PETM? (c) The PETM rise went from about 900 to about . How long would it have taken at per century, and at today’s rate?
Solution
Solution of Exercise 27.13.
(a) and : about 20 times faster. (b) Against per century: to times; against : to times. Today’s rise is about 5 to 50 times faster than the PETM’s. (c) The rise is : centuries, about years at the fastest PETM rate; centuries, under 600 years, at today’s rate.
Exercise 27.14 ★★★
The IPCC estimates that the global temperature rose by 1 to per thousand years in the fastest part of the last deglaciation, and that over Greenland it rose about ten times faster in the centuries of most rapid warming. (a) Give the Greenland rate in per thousand years and per decade. (b) Compare it with today’s global rate of per decade. (c) Why must a local rate not be compared directly with a global one?
Solution
Solution of Exercise 27.14.
(a) Ten times 1 to : 10 to per thousand years, that is 0.10 to per decade. (b) Today’s global rate, per decade, is 1.3 to 2 times the fastest warming over Greenland. (c) A single place can change much more than the average over the globe, where the changes of different regions partly cancel: a global rate is compared with a global rate.
Exercise 27.15 ★★★
Sea level was about years ago; assume that it then rose at a steady per thousand years, the mean rate of the main deglaciation. (a) When did it pass , the level that joins Borneo to Asia on the map? (b) After that time, could a person walk from Borneo to the Malay Peninsula? (c) How long would the sea take to rise the last , if it had kept going at the same speed?
Solution
Solution of Exercise 27.15.
(a) at per thousand years takes thousand years, about years: about years ago. (b) No: the sea had to stay at least below today’s to join Borneo to Asia; once it passed the land bridge drowned, and Borneo was an island again. (c) thousand years, about years; in fact the rise slowed down after about years ago, so it took longer.
Problem 27.1
Weekend problem — 800 000 years of Antarctic ice
The ice of Dome C and the air in its bubbles give the following values. The temperature is the change over the ice compared with the last thousand years.
| temperature change () | carbon dioxide (ppm) | |
|---|---|---|
| coldest value, about years ago | — | |
| warmest value, about years ago | — | |
| lowest and highest carbon dioxide | — | 174 and 299 |
| mean, to years ago | 190 | |
| mean, to years ago | 264 |
The strongest period of the temperature record is about years, and the 1639 pairs of values give a correlation coefficient of 0.92.
Part I — Reading the two records.
- Which part of the ice records the temperature, and which records the carbon dioxide?
- Compute the full range of the temperature change at Dome C.
- Compute the full range of the carbon dioxide.
- What does a correlation coefficient of 0.92 tell about the two records?
- In the time-axis figure of the chapter, today is on the right. Why must you check which way time runs before reading such a figure?
Part II — Glacial and interglacial values.
- Define a glacial period and an interglacial.
- In which of the two do we live, and since when?
- How many cycles of years fit in years?
- Which change of the Earth’s orbit has a period close to years?
- Before about 1.25 million years ago, what was the main rhythm of the glacial cycles?
Part III — The last deglaciation.
- By how much did the temperature over Dome C rise between the Last Glacial Maximum and to years ago?
- By how much did the carbon dioxide rise over the same interval?
- The global temperature of the Last Glacial Maximum was 5 to below that of 1850–1900. Take the middle of this range. Is the Antarctic change larger or smaller?
- The last deglacial transition lasted from to years ago. How long is that?
- Compute the mean rate of global warming over the transition, in per thousand years.
- Express this rate in per decade.
Part IV — Today’s rate compared.
- From 1970 to 2025 the global temperature rose by per decade. Express this rate per thousand years.
- How many times faster is today’s warming than the mean warming of the last deglaciation?
- In the fastest part of the deglaciation, the global temperature rose by 1 to per thousand years. How many times faster is today’s rate than these?
- Conclude: how many times faster than the warming out of the last ice age is today’s global warming?
Solution
Solution of Problem 27.1.
1. The ice itself, through its heavy isotopes, records the temperature; the air in its bubbles records the carbon dioxide.
2. .
3. .
4. The points lie close to a straight line: the two records rose and fell together. It does not tell which caused which.
5. Records of the past are drawn with the oldest times on either side; read the wrong way, a warming would be taken for a cooling.
6. A glacial period is a cold interval within an ice age, when the ice sheets grow far beyond their present size; an interglacial is a warm interval between two glacial periods, with ice sheets close to today’s or smaller.
7. In an interglacial, which began about years ago.
8. : about eight cycles.
9. The shape of the orbit.
10. A rhythm of years, the period of the tilt of the axis.
11. .
12. .
13. ; the Antarctic change, , is larger, about 1.5 times the global one.
14. years.
15. per thousand years.
16. A thousand years is a hundred decades: per decade.
17. per thousand years.
18. times.
19. and : 13 to 20 times.
20. Today’s global warming is about twenty times faster than the warming out of the last ice age: 23 times its mean rate, 13 to 20 times its fastest.