书籍暂未推出简体中文版——当前显示英文版。
University Earth and Space Sciences — Year 1 · 本科一年级
15Hotspots and Intraplate Volcanism
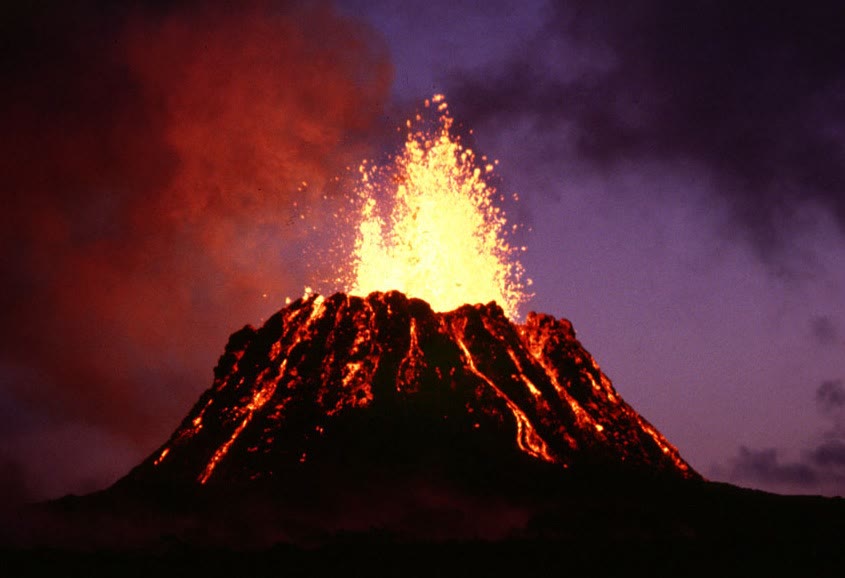
From January 1983, and for decades after, Kilauea, on the island of Hawaii, erupted almost without a pause from a vent on its east rift zone, Pu‘u ‘O‘o, pouring out about of lava a year. Kilauea stands in the middle of the Pacific plate, thousands of kilometres from any ridge or trench. To the north-west the islands of Hawaii are older and older, then they sink below the sea and the chain goes on as a line of drowned volcanoes for thousands of kilometres more. Plate tectonics explains volcanoes at plate boundaries; this chapter is about the ones it does not explain directly, the hotspots, and about what they tell us in return: how the plates move over the deep mantle, how much heat and rock rise from below, and how a few enormous outpourings of lava, the large igneous provinces, were made.
You already know
A hotspot feeds volcanoes from deep in the mantle while the plate moves above it, and the plate carries away a hotspot track whose volcanoes are older with distance (Book 1, grade 7; Book 2, grade 11). A plate turning with the Euler vector moves at , at the speed , perpendicular to the great circle that joins it to the pole (Chapter 12); relief is held up by isostasy (Chapter 11); warm rock is lighter by the fraction (Chapter 13).
15.1 Hotspots and mantle plumes
Definition 15.1 (Hotspot)
A hotspot is a region of volcanism whose position does not depend on the plate boundaries, active over tens of millions of years, and thought to be fed by mantle that is hotter than the mantle around it.
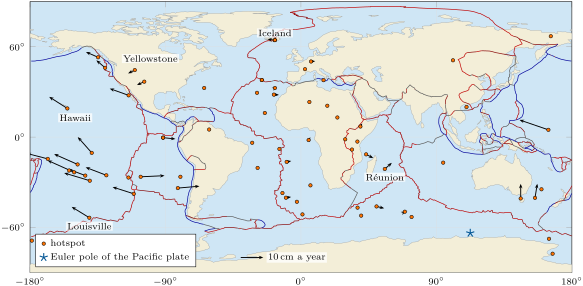
How many hotspots there are depends on what one counts. The table of hotspots used in this chapter lists 68 of them, but its authors leave out several features they judge not to record the motion of a plate, and they rate some of those they keep only as probable. Some hotspots, among them Hawaii, Iceland and Réunion, have long, regular tracks and a large output, as a deep source would; others are small and short-lived. Most hotspot volcanoes erupt basalt; where a hotspot lies beneath a continent, the hot basalt melts the crust, and the great eruptions turn to rhyolite, as at Yellowstone.
Definition 15.2 (Mantle plume)
A mantle plume is a column of hot, buoyant mantle rock that rises from a thermal boundary layer deep in the mantle. A new plume has a large, bulbous head on a long, narrow tail, or conduit; once the head has spread beneath the lithosphere, the tail goes on feeding melt to the surface for tens of millions of years.
The shape comes from the laboratory. In tank experiments of the 1970s, a layer of light fluid less viscous than the fluid above it rose as a round pocket fed by a pipe behind it: a mushroom. The head of a mantle plume reaching the base of the lithosphere spreads out and flattens; the pressure falls, and the hot rock melts in large amounts. Flood basalts fit the picture: their volcanism lasts some ten million years, but most of their volume is erupted in about a million years or less, and they often go with the breaking apart of a continent (Section 15.4).
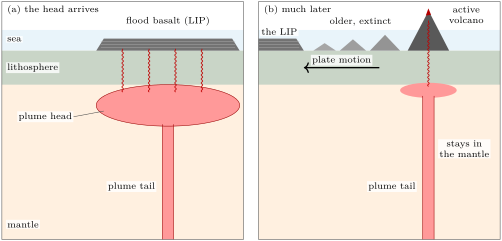
What is the evidence for plumes? First, the age-progressive chains themselves, which a narrow source fixed beneath a moving plate explains at once (Section 15.2). Second, the lavas of some hotspots carry unusually high ratios of the light to the heavy isotope of helium, read as the signature of a deep reservoir that has kept some of the gas the Earth was made with. Third, the sources are hot: the lavas of ocean islands and plateaus point to mantle 200 to hotter than the mantle beneath the ridges, whose potential temperature lies between 1280 and . Fourth, seismic images of the mantle: beneath Hawaii, a network of seismometers on the sea floor and on the islands imaged a hot column reaching down into the lower mantle, and a model of the whole mantle built in 2015 from complete seismic waveforms shows broad, roughly vertical columns beneath many of the major hotspots, rising from the core–mantle boundary to about below the surface; beneath Hawaii, Iceland and Samoa they are rooted in patches of very low wave speed at the base of the mantle. How such images are made belongs to the Year 3 volume.
None of this is a proof, and the debate is alive. In the plate hypothesis, defended by Gillian Foulger and James Natland among others, hotspot volcanism is not especially hot and needs no deep plume: it is a by-product of plate tectonics, fed from shallow sources where the lithosphere is stretched or cracked. Their opponents hold that the evidence for at least some deep plumes is strong, though the seismic images are not yet sharp enough to settle it; and the hotspots, as the next section shows, are not quite fixed.
15.2 Hotspot tracks and the motion of the plates
Definition 15.3 (Hotspot track; age progression)
A hotspot track is the line of volcanoes, seamounts and volcanic ridges that a plate carries away from a hotspot as it moves over it. Its age progression is the regular increase of the ages of its volcanoes with the distance from the active one. The direction of a track at the hotspot is the azimuth, measured from north, towards which its young part runs away from the hotspot.
If the hotspots stay fixed in the deep mantle, a track records the motion of the plate over the deep mantle: its direction is that of the plate’s velocity at the hotspot, and its age progression gives the speed. Book 2, grade 11, read the speed of the Pacific plate from the ages of the Hawaiian volcanoes. The directions alone already say more: they give the Euler pole.
Proposition 15.4 (The Euler pole from two tracks)
Let a rigid plate move over two fixed hotspots at the positions and , and let and be the horizontal unit vectors along their tracks. If and are not parallel, the Euler vector of the plate relative to the hotspots is parallel to , and its pole is the unit vector
with the sign for which .
Proof. At each hotspot the plate moves with (Theorem 12.4), and the track points along it: with . A cross product is perpendicular to its factors, so for : is perpendicular to two vectors that are not parallel, hence parallel to their cross product. Of the two unit vectors along it, the pole is the one about which the rotation is anticlockwise, that is, the one for which points the way the plate moves at the first hotspot, along . ∎
To use the proposition one needs, at a point of latitude and longitude , the unit vectors pointing east and north,
in the axes of Chapter 12 ( towards N E, towards N E, towards the north pole). A track of azimuth runs along . With the Hawaiian track, azimuth , and the Louisville track, azimuth , the proposition puts the pole of the Pacific plate at S, E (the weekend problem does the computation).
Two tracks determine the pole but cannot test it. Many tracks over-determine it, and the misfit says whether the hotspots behave as a fixed frame. W. Jason Morgan, who proposed the deep plumes, and Jason Phipps Morgan compiled in 2007 a table of 68 hotspots, with, where they could be measured, the direction of the track and the speed of the plate over the hotspot, each with its uncertainty and a weight for its reliability; a hotspot under two plates, as Iceland is, has a line for each. Fifteen weighted tracks lie on the Pacific plate, thirteen of them with a speed.
Method 15.5 (Fitting an Euler pole and a rate to hotspot tracks)
Given, for hotspots on one plate, the positions, the track directions with weights , and for some of them the speeds :
- For a trial pole , compute at each hotspot the direction of , the azimuth of the motion it predicts (Proposition 12.5).
- Form the misfit , each difference brought between and .
- Search for the pole that minimises : on a grid of the whole sphere, then on a finer grid around the best point.
With the pole found, compute for each hotspot with a speed its angular distance to the pole and . The speeds should be : the least-squares rate is
since vanishes there.
- Judge the fit: if the hotspots were fixed and the uncertainties honest, would be close to the number of directions less two (the two coordinates of the pole fitted).
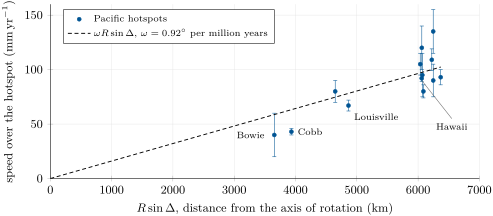
For the fifteen Pacific tracks the method gives the pole S, E, about from the two-track pole, and from the thirteen speeds the rate . At Hawaii, from the pole, the fit predicts a motion towards at ; Morgan and Morgan list and . The misfit is 39 where fixed hotspots with honest uncertainties would give about 13, and the speeds scatter about the line by (root mean square): the Pacific hotspots form a reference frame good to a few degrees and a few centimetres a year, not better.
The best-known test of the fixed frame is the bend of the Hawaiian–Emperor chain. The Hawaiian limb runs north-west; the Emperor seamounts run almost north, to Meiji Guyot, more than 81 million years old, which is about to go down at the junction of the Kuril–Kamchatka and Aleutian trenches. Was the bend a change in the motion of the plate? The magnetisation of the Emperor lavas, measured on cores drilled from the seamounts, records the latitude at which each one cooled (the method belongs to the Year 3 volume): they formed farther north than Hawaii is today, and between 81 and 47 million years ago the hotspot itself moved south at more than a year. Much of the Emperor chain records the hotspot, not the plate. Yet the plate changed too: new ages place the start of the bend near Kimmei Seamount, about 50 million years ago, when the spreading ridges of the Pacific were realigned. The plume may even be older than the chain: the head that first fed it is thought to have made a plateau about 100 million years ago, which went down a trench 20 to 30 million years ago and now lies about deep beneath Siberia, west of the Sea of Okhotsk.
Hotspot tracks also cross continents. As the North American plate moved south-west over the Yellowstone hotspot, a chain of great calderas formed, older and older towards the south-west along the Snake River Plain. At its far end, on the border of Nevada and Oregon, the McDermitt caldera, some across, collapsed 16.4 million years ago in an eruption of about . At Yellowstone itself, the first of three caldera-forming eruptions, 2.1 million years ago, released some of magma and left a caldera more than across; the last, 640 000 years ago, made the present Yellowstone Caldera, by 80. Since 10 million years ago the onset of the caldera eruptions has moved north-east at a year, and Morgan and Morgan give the plate a speed of over the hotspot, towards ; the older calderas, as Exercise 15.8 shows, moved faster.
15.3 Swells, buoyancy and the supply of magma
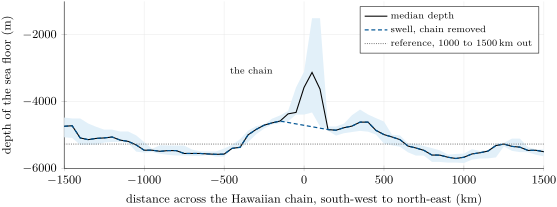
Hawaii does not stand on ordinary ocean floor. In 1953 Robert Dietz and William Menard described the broad rise of the sea floor on which the islands sit, the Hawaiian swell. The swell is not compensated by thick crust: it is held up from below by the hot, light rock of the plume as it spreads beneath the plate, a dynamic support. Over the swell the heat flow at the surface is at most 5 to higher than around it, and perhaps not higher at all.
Its shape can be read from the global grid of depths. Take sections across the track, perpendicular to its direction, every from the hotspot to downstream; at each distance from the axis of the chain, the median of the depths on these sections gives a profile that keeps the swell and smooths away the single volcanoes (the figure after the next proposition). Far from the chain, 1000 to on either side, the floor lies at . Close to it, the islands and seamounts stand up to higher; replace them by a straight line across the of the chain, and what remains is the swell: about high at most, a few hundred kilometres wide on each side, with a cross-section of above the far floor.
The swell measures the plume. It is carried away with the plate and remade over the hotspot, so the plume must supply buoyancy as fast as the plate takes it away.
Proposition 15.6 (Buoyancy flux of a plume)
Let a plate move at the speed over a hotspot, and let the swell around the track have the cross-section above the floor far from it, the swell being in isostatic equilibrium (Definition 11.3) and supported by light rock carried along with the plate. Then the plume delivers mass deficit, its buoyancy flux, at the rate
where is the density of the mantle and that of sea water.
Proof. Consider a column through the swell, where the floor is raised by , and a column far from it, both down to a compensation depth. Between the two floors the far column holds water and the swell column rock: the swell column has the extra mass per unit area there. Equal masses above the compensation depth (Proposition 11.4) require a mass deficit of the same size lower down in the swell column, in the light plume rock. Across the track, the deficit per unit length of track is . In a time the plate carries a length of swell downstream, with its deficit, and the swell over the hotspot keeps its shape: the plume must supply the deficit . ∎
A buoyancy flux is a flow of missing mass: it counts how fast the plume brings light rock up. What makes the rock light is heat, so the buoyancy flux is also a heat flux.
Proposition 15.7 (Heat carried by a plume)
If the rock of a plume is hotter than the mantle around it, with the coefficient of thermal expansion and the specific heat capacity , its buoyancy flux and the excess heat it carries, , satisfy
whatever .
Proof. Let the plume carry the mass of hot rock per unit time. Each unit volume of it is lighter than the mantle by , which is, to first order, a mass deficit per unit mass: . Each unit mass carries the excess heat : . Dividing, and cancel. ∎
For Hawaii, with , and ,
the plume brings up about three tonnes of missing mass every second. Rocks store 2 to per cubic metre and per kelvin; with the mantle, of density , has ; with ,
of the that leave the whole Earth. The strongest plume on Earth is a small item in the planet’s heat budget (Chapter 10); most of the heat leaves through the ocean floor made at the ridges.
The magma tells the same story. Since 81 million years ago the hotspot has built the Hawaiian–Emperor chain, about two million cubic kilometres of basalt once the sinking of the plate beneath its load is counted, an average of a year; but about a quarter of it was erupted in the last six million years, and Kilauea alone is supplied today with about of magma a year. Mauna Loa, the largest volcano of the islands, holds some , and Mauna Kea, its neighbour, rises above the sea. Yet the ridges make about of ocean crust a year, two hundred times the present supply of Kilauea.
History — A fixed frame for the plates
In 1963 John Tuzo Wilson explained the Hawaiian Islands, older and older along a line, by a source of lava held in the slow core of a mantle convection cell, while the faster upper part of the cell carried the sea floor over it. In 1971 and 1972 W. Jason Morgan made that source a plume, about across, rising from the lowest part of the mantle and so nearly fixed while the plates move above it; tank experiments soon showed what such a plume looks like. The hotspots became a frame in which the plates could be measured against the mantle, not only against one another. Half a century later the frame is known to drift, the Hawaiian hotspot among others, but slowly enough that the Pacific tracks still give the motion of the plate over the mantle to a few degrees and a few centimetres a year, as the fit of this chapter showed.
15.4 Large igneous provinces
Definition 15.8 (Large igneous province)
A large igneous province (LIP) is an accumulation of igneous rock, mostly basalt, that is not made by ordinary spreading at a ridge, covers more than , holds more than , and was emplaced within at most about 50 million years, most of it in pulses of 1 to 5 million years that carry more than three quarters of its volume. On land LIPs are mostly flood basalts; in the oceans, oceanic plateaus.
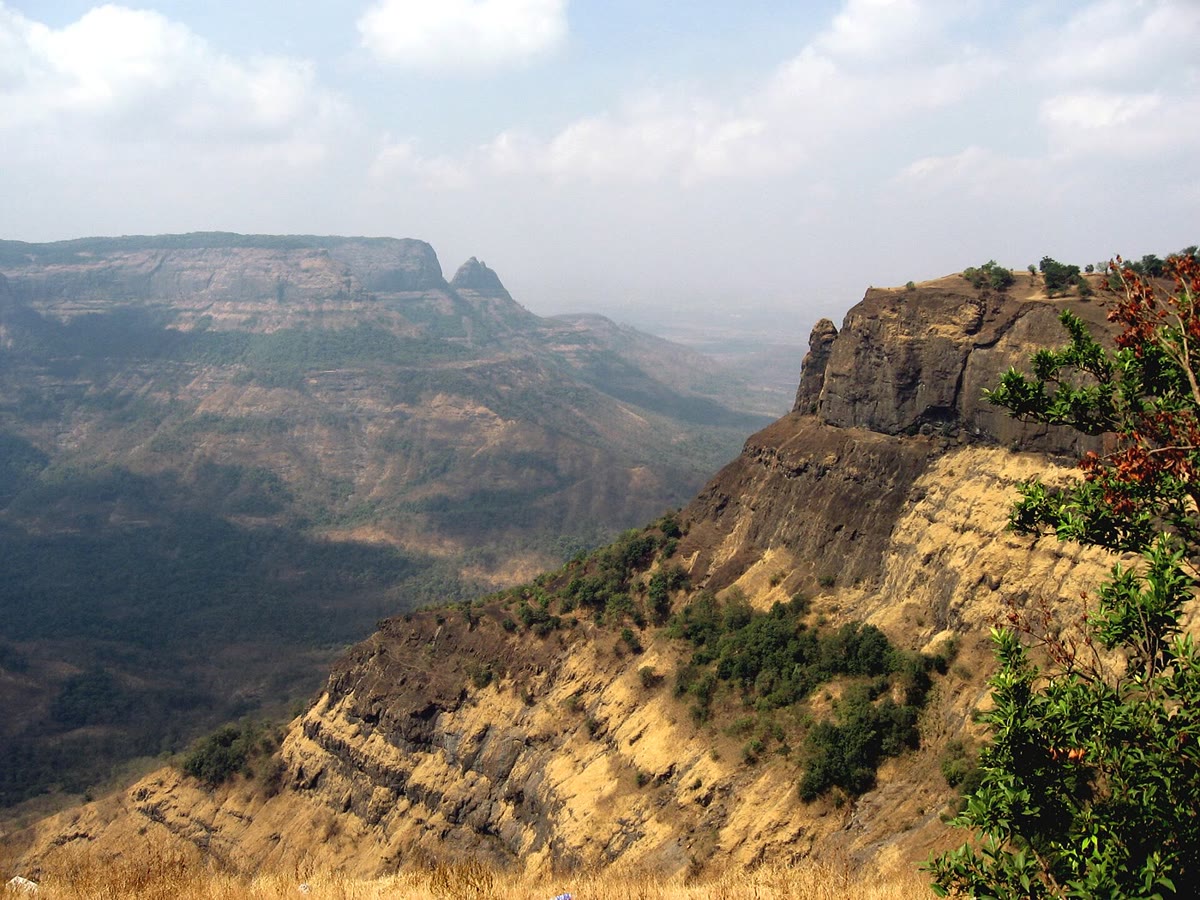
A typical LIP covers about a million square kilometres and holds about a million cubic kilometres of lava, most of it erupted in about a million years or less. Their lavas are piled in nearly flat flows, which erosion cuts into steps, the traps of their names. The table lists the main ones of the last 260 million years.
| province | age (Ma) | area () | first volume () |
|---|---|---|---|
| Columbia River | 16 | 0.2 | 0.2 |
| Ethiopia–Yemen | 30 | 0.7 | 1.2 |
| North Atlantic | 61 and 56 | 1.2 | more than 2 |
| Deccan | 65.5 | 0.5 (once 1.8) | 2 to 4 |
| Ontong Java | 122 and 90 | 2 | 44 (whole crust) |
| Paraná–Etendeka | 133 | 1.5 (once over 2) | more than 2.3 |
| Karoo–Ferrar | 183 | 3.1 | more than 2.5 |
| Central Atlantic (CAMP) | 201 | once up to 7 | more than 2 |
| Siberian Traps | 250 | 0.4 (once over 4) | more than 3 |
| Emeishan | 259 | 0.5 (once 2 to 5) | more than 1 |
The plume model sketched in Section 15.1 explains both the size and the haste: a plume head hundreds of kilometres across reaches the base of the lithosphere, decompresses and melts, and floods the surface; then the tail goes on building an ordinary hotspot track. Several provinces are thought to stand at the old end of a living track: the Deccan Traps and the Réunion hotspot, Paraná–Etendeka and Tristan da Cunha, joined by the Walvis Ridge, and the Columbia River basalts and Yellowstone.
The Deccan Traps of west-central India are a pile of lava flows some thick, of which at least were erupted close to 65.5 million years ago, in much less than a million years; today they cover about , perhaps before erosion. The Ontong Java Plateau, in the south-western Pacific, is the largest of all oceanic plateaus: it covers some , and its crust, about thick, holds some of igneous rock. The Manihiki and Hikurangi plateaus, now far apart from it across younger ocean floor, may have formed with it as a single plateau. The Central Atlantic Magmatic Province, erupted about 201 million years ago as the Atlantic began to open, is scattered today, as lavas, dykes and sills, over four continents: eastern North America, north-eastern South America, West Africa and south-western Europe; it may once have covered up to .
Several provinces coincide in time with the great mass extinctions that biology describes: the Siberian Traps with the largest of all, at the end of the Permian; the Central Atlantic province with the end of the Triassic; the Karoo–Ferrar with an extinction in the Early Jurassic; the Emeishan with one in the Middle Permian; and the Deccan Traps with the end of the Cretaceous. The four largest extinctions of the last 260 million years each fall, as closely as the dates can tell, on one of these provinces, and a causal link is thought the most likely. The proposed mechanisms are atmospheric: sulfate aerosols that cool the climate for a short time, carbon dioxide that warms it for much longer, and oceans starved of oxygen. For the end of the Cretaceous, the Deccan eruptions began before the impact at Chicxulub and went on after it; a review of the records of the boundary concluded in 2010 that the impact triggered the extinction.
Not all volcanism far from plate boundaries needs a plume. Small volcanic fields grow where a plate is stretched or cracked, and the chains without a clean age progression may be fed from the upper mantle; this is the plate hypothesis at work. What the oceanic islands become after the hotspot has left them, as they sink, wear down and grow reefs, belongs to the Year 2 volume.
15.5 Exercises
Exercise 15.1 ★
(a) Mauna Kea rises above sea level, and the sea floor far from the Hawaiian chain lies deep. How high does the volcano stand above that floor? Why is its true height from its base greater still? (b) Mauna Loa holds about . How long would it take to build at Kilauea’s present supply, a year, and at the mean rate of the whole chain, a year? (c) The Pu‘u ‘O‘o eruption poured out about a year from 1983 to 2002. What volume is that, and what fraction of Mauna Loa?
Solution
Solution of Exercise 15.1.
(a) , nearly . The volcano is heavier than the water it replaces: the plate bends down beneath its load, so its base lies deeper than the floor far away, and its true height is greater. (b) years at Kilauea’s supply; years at the mean rate of the chain. (c) , about of Mauna Loa: three thousandths of one per cent.
Exercise 15.2 ★
A plate turns over the hotspots at . Take . (a) Express in radians per million years. (b) Compute the speed, in , of hotspots , , and from the pole. (c) Why is the speed of Hawaii, at , less than at ?
Solution
Solution of Exercise 15.2.
(a) . (b) In radians per million years times kilometres, is in kilometres per million years, that is millimetres a year: , so , which gives at , at , at and at . (c) The speed is proportional to the distance from the axis, largest on the great circle from the pole; beyond it the point comes closer to the axis again, on the side of the opposite pole.
Exercise 15.3 ★
(a) Compute the mean thickness of the Deccan Traps as they are today, over , and of the Central Atlantic province, over . (b) Compare with the thickness of the Deccan section, . (c) Why does the mean thickness of the Central Atlantic province say little about the thickness of its lava piles?
Solution
Solution of Exercise 15.3.
(a) Deccan: . Central Atlantic: , about . (b) The mean for the Deccan is close to its section: the province is a thick, continuous plateau. (c) The Central Atlantic area is that of the whole region, on four continents, over which its remnants are found: lavas, dykes and sills now separated by an ocean and much eroded. The rock is concentrated in some places and absent from most of the area, so the mean says nothing of a single pile.
Exercise 15.4 ★
Plume rock hotter than the mantle around it has and . (a) By how much is it lighter, in ? (b) What thickness of such rock, spread beneath the plate, would hold up isostatically a swell high under the sea ()?
Solution
Solution of Exercise 15.4.
(a) . (b) The swell column has the extra mass , which the light layer must balance: , about of hot rock.
Exercise 15.5 ★★
Two hotspots lie on the equator, A at E and B at E, and both tracks run due west (azimuth ). (a) Compute the track vectors and . (b) Compute . (c) Apply the sign rule of Proposition 15.4: where is the Euler pole? Explain the result without computation. (d) If A moves at , what is in degrees per million years?
Solution
Solution of Exercise 15.5.
(a) At A (, ), and ; with and , . At B (), , and . (b) . (c) With and , , and : the pole is , the South Pole. A westward motion along the equator is clockwise seen from above the North Pole, so anticlockwise seen from above the South Pole. (d) At from the pole, .
Exercise 15.6 ★★
Three hotspots of one plate lie at the distances , 5000 and from the axis of rotation and move at 30, 48 and . (a) Fit by least squares and give in radians and in degrees per million years. (b) Compute the residuals. (c) Why must the line pass through the origin?
Solution
Solution of Exercise 15.6.
(a) and , so , or . (b) The predictions are 28.8, 48.0 and ; the residuals , and . (c) For a rigid rotation the speed is proportional to the distance from the axis, and a point on the axis does not move: there is no intercept to fit.
Exercise 15.7 ★★
A swell of cross-section surrounds a hotspot track on a plate moving at . Take , and . (a) Compute its buoyancy flux and its heat flux. (b) Compare with Hawaii, . (c) Two hotspots have the same swell; one lies under a plate moving twice as fast. Which plume is stronger?
Solution
Solution of Exercise 15.7.
(a) , so and . (b) A third of the Hawaiian flux. (c) grows with : the plume under the faster plate must remake the same swell twice as fast, and its flux is twice as large.
Exercise 15.8 ★★
Along the Yellowstone track, the caldera eruptions began in the McDermitt volcanic field 16.1 million years ago and in the Picabo field, some to the north-east, 10.3 million years ago; since then they have moved at a year towards N E. (a) At what mean speed did the volcanism migrate from McDermitt to Picabo? (b) Compare both speeds with that of the plate over the hotspot, towards . (c) Is the direction of the young track the one expected? (d) The older part of the track lies in a region that has been stretched as the volcanism passed. How can this explain the difference?
Solution
Solution of Exercise 15.8.
(a) , that is . (b) The young track, , agrees with the of the plate within the uncertainties; the old part went more than twice as fast, , almost seven standard uncertainties of the plate speed. (c) Yes: N E is the azimuth , opposite to within a degree. The volcanism moves over the plate the opposite way to the plate over the hotspot. (d) The stretching moved the older calderas apart, lengthening the distances between them and so the apparent speed; the plate itself did not go faster.
Exercise 15.9 ★★
The Hawaiian plume carries about of excess heat. (a) If all of it left through the by of sea floor nearest the hotspot, by how much would the heat flow there be raised? (b) Compare with the observed excess, at most 5 to . (c) How long does heat take to diffuse through a plate thick ()? How long does the plate take to cross at ? Conclude.
Solution
Solution of Exercise 15.9.
(a) , . (b) Nine to eighteen times the observed excess, which may even be nil. (c) , about ; the plate crosses in . Heat from below has had time to cross only a small part of the plate while it is over the swell: most of the plume’s heat stays in the mantle beneath the plate and is carried away with it, and the surface sees little of it.
Exercise 15.10 ★★★
The Deccan Traps hold about of lava. Suppose it came from a spherical plume head of which one tenth melted. (a) What was the volume and the radius of the head? (b) Flattened beneath the lithosphere into a disc thick, what diameter would the head have? Compare its area with the area the Traps may once have covered, . (c) If the lava was erupted in one million years, compare its rate with the present supply of Kilauea, a year. (d) Why must a plume head be large, while the tail that follows is narrow?
Solution
Solution of Exercise 15.10.
(a) Ten times the melt, , of radius . (b) , a disc across: eighteen times smaller in area than the Traps. The head was larger or melted less, or it spread wider and thinner, or the lavas flowed far beyond it. (c) a year, ten times the present supply of Kilauea. (d) A new plume must gather enough hot, light rock to push its way up through the viscous mantle, and a large volume rises far faster than a small one; the tail that follows flows up the hot, weak path the head has opened, and a narrow conduit suffices.
Exercise 15.11 ★★★
Between 81 and 47 million years ago the Hawaiian hotspot moved south at more than . (a) Taking , how far did it move? (b) Suppose the plate moved meanwhile at towards over the deep mantle. With east and north, compute the velocity of the plate relative to the drifting hotspot, its speed and its azimuth. (c) By what percentage, and by how many degrees, would a track built then misrepresent the motion of the plate over the deep mantle?
Solution
Solution of Exercise 15.11.
(a) . (b) The plate moves at and the hotspot at : relative to the hotspot the plate moves at , a speed of towards . (c) The track would give a speed too high and a direction too far east: a drifting hotspot records the plate’s motion relative to itself, not to the deep mantle.
Exercise 15.12 ★★★
(a) A flood basalt of cools from about to the temperature of the surface. With a heat capacity of , how much heat does it give out (ignore the latent heat of crystallisation)? (b) Spread over one million years, what power is that? Compare with the Hawaiian plume, , and with the of the whole Earth. (c) A plume head also heats the base of the lithosphere without melting all of it. Is the power of (b) an upper or a lower bound for the heat brought by the head?
Solution
Solution of Exercise 15.12.
(a) . (b) Over , : about the heat carried by the Hawaiian plume today (1.3 times), and of the of the Earth. (c) A lower bound: the head also brings up the excess heat of the nine tenths of its rock that do not melt, and warms the base of the lithosphere, and the latent heat was left out.
15.6 Problem: The Pacific plate’s speedometer
Problem 15.1
Weekend problem — the Euler pole of the Pacific plate from two hotspot tracks, its rate from a third measurement, a test on other hotspots, and the Hawaiian plume’s buoyancy and supply
Morgan and Morgan list the Hawaiian hotspot at N, W, with a track towards and a speed of , and the Louisville hotspot at S, W, with a track towards and a speed of . Use the axes and the vectors , , of Section 15.2, with . Give components to four decimals.
Part I — The pole from two tracks.
- Compute , and at Hawaii, then the track vector .
- Do the same at Louisville: , , and .
- Check that is a unit vector perpendicular to .
- Compute and its length. What angle do the two track vectors make?
- Normalise the cross product and apply the sign rule of Proposition 15.4.
- Give the latitude and longitude of the Euler pole of the Pacific plate relative to the hotspots.
Part II — The rate.
- Compute the angular distances and from the pole to the two hotspots.
- Compute . Explain why it equals , and what its sign says about the motion at Louisville.
- From the speed at Louisville, compute in radians and in degrees per million years.
- How long does the Pacific plate take to make a full turn about this pole?
- The least-squares pole of the fifteen Pacific tracks lies at S, E, with . Compute the angle between the two poles and compare the two rates.
Part III — A test on three more hotspots. Morgan and Morgan give the Society hotspot ( S, W) , Pitcairn ( S, W) and Cobb ( N, W) .
- Compute the angular distance from the pole of question 6 to each of the three hotspots.
- Predict the three speeds with the rate of question 9.
- Which predictions agree with the measured speeds within their uncertainties, and which do not?
- Two tracks of different directions always give a pole. Why are two tracks that are nearly parallel a poor choice?
Part IV — The plume and the speedometer. The Hawaiian swell has the cross-section . Take , and .
- Convert to and compute the buoyancy flux of the Hawaiian plume.
- Compute the excess heat it carries, and compare with the that leave the Earth.
- The ridges make about of crust a year along some . What length of ridge makes as much crust as Kilauea is supplied with, a year?
- At that rate, how long would Mauna Loa, about , take to grow?
- The hotspot built about of the chain in 81 million years. Compute its mean output and compare with Kilauea’s supply today.
- With the pole and the rate of Parts I and II, compute the speed that the Louisville track predicts for the Pacific plate over the Hawaiian hotspot.
- Compare with the measured : by how much, and by how many standard uncertainties, do they differ?
- From the ages of the Hawaiian volcanoes, Book 2 found a year, and the authors of the ages, fitting the whole chain, a year. Compare these averages over tens of millions of years with the two hotspot speeds.
- To one decimal, in centimetres a year, what speed does the Louisville track give the Pacific plate over the Hawaiian hotspot?
Solution
Solution of Problem 15.1.
1. At Hawaii (, ), with and :
2. At Louisville (, ), with and :
3. and , to the rounding.
4. , of length . The angle between the tracks is (their dot product, , is positive, so the angle is acute).
5. . Then : the pole is .
6. and : the pole lies at S, E, in the Southern Ocean south of Australia.
7. , so ; , so .
8. The vector is perpendicular to and to , as is (by construction of , and because a track is horizontal); both lie along the same line, and its length is . So , and the computation gives : the plate moves at Louisville along , the way the track runs. The sign rule, applied at Hawaii, could have given the wrong sense at Louisville; it did not, so both directions are reproduced exactly, and .
9. , that is .
10. .
11. The cosine rule between S, E and S, E gives . The two-track rate, , is below the fitted to thirteen speeds.
12. Society , Pitcairn , Cobb .
13. , times : Society , Pitcairn , Cobb .
14. Pitcairn agrees: less than measured, within its . Society is too slow, 2.6 uncertainties, and Cobb too fast, more than six: neither agrees.
15. The pole is perpendicular to both track vectors. If they are nearly parallel, their cross product is short, and an error of a few degrees in either direction turns it through a large angle: the pole is poorly determined.
16. and .
17. , of .
18. The ridges make a year per kilometre; of ridge.
19. years.
20. a year: Kilauea alone is supplied today with four times the mean output of the whole hotspot, which is near its strongest.
21. .
22. , 2.2 standard uncertainties of the measured speed: the two hotspots do not quite agree on the motion of one rigid plate over a fixed frame.
23. The ages give and a year, averaged over the whole chain; Morgan and Morgan’s a year lies close to the first, and the Louisville prediction, a year, close to the second. All four lie within a year of one another: tracks, ages and directions tell the same story to within about .
24. To one decimal, the Louisville track gives the Pacific plate over the Hawaiian hotspot the speed .