University Biology — Year 1 · Bachelor Year 1
26Ecosystems and Trophic Structure
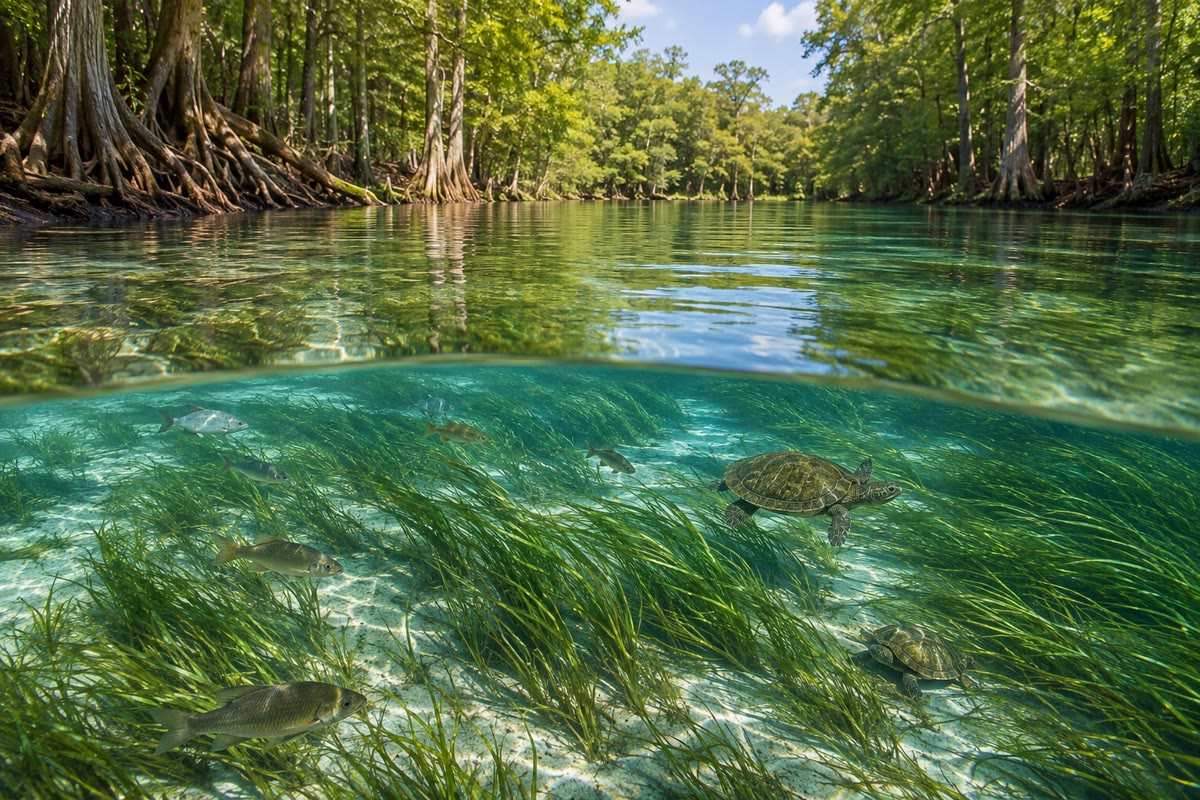
A spring in a limestone plain pours out water so clear that every plant, fish and turtle in it can be counted from a boat. Sunlight falls on the eelgrass at million kilocalories per square metre a year; the grass stores one percent of it; the snails and turtles that eat the grass get a sixth of that; the fish that eat the snails a tenth again; and the one heron at the top lives on a hundred-thousandth of what fell on the water. Every ecosystem is built this way: a stream of energy that enters once, passes from eaters to eaten, and leaves as heat, while the matter it moves is recycled. This chapter defines the ecosystem and its parts, the niche each species occupies, the trophic levels and food webs through which energy flows, the productivity that sets the size of the whole, and the ways of counting how many kinds of things live in it.
26.1 Ecosystem and niche
Definition 26.1 (Ecosystem, biotope, community)
An ecosystem is the set of organisms living in a defined place together with the physical environment they occupy and exchange with: the community (or biocoenosis) — all the populations of all the species — and the biotope — the soil, water, air, light and climate. Its boundaries are chosen for the question: a rotting log, a pond, a forest, an ocean basin, the whole biosphere. An ecosystem is an open system (Chapter 1): energy flows through it, matter cycles within it and across its borders, and its structure is the pattern of who eats whom.
Definition 26.2 (Habitat, niche)
A species’ habitat is where it lives; its niche is how it lives: the full set of conditions it tolerates and resources it uses — temperature, moisture, light, food, time of activity, nesting sites — each of them a dimension along which the species occupies a range. The fundamental niche is the range it could occupy alone; the realised niche the part it actually occupies in the presence of competitors and predators (Chapter 27). Two species with the same niche cannot coexist in one place for long; the niches of coexisting species differ, and the community is a set of niches fitted together.
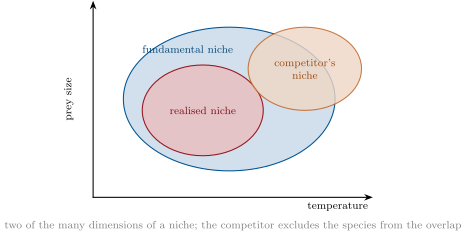
Example 26.3 (Five warblers in one spruce)
Five species of small insect-eating warbler nest in the same spruce forests and eat the same insects; watched closely, each forages in a different part of the tree — the treetop, the outer new needles, the middle branches, the trunk and lower branches, the ground beneath — and at different heights and times. Their habitat is one; their niches are five, and the forest holds five species where the food alone would suggest one.
26.2 Trophic structure
Definition 26.4 (Producers, consumers, decomposers)
The organisms of an ecosystem are grouped by what they eat into trophic levels. Producers (autotrophs: plants, algae, cyanobacteria, chemosynthetic bacteria) make organic matter from inorganic; they are the first level. Consumers eat it: primary consumers (herbivores) eat producers, secondary consumers (carnivores) eat herbivores, tertiary consumers eat carnivores; omnivores eat at several levels. Decomposers (bacteria, fungi) and detritivores (earthworms, woodlice, dung beetles) live on dead matter and wastes from every level, and return its minerals to the soil and water for the producers to take up again — the link that closes the cycle of matter.
Definition 26.5 (Food chain, food web)
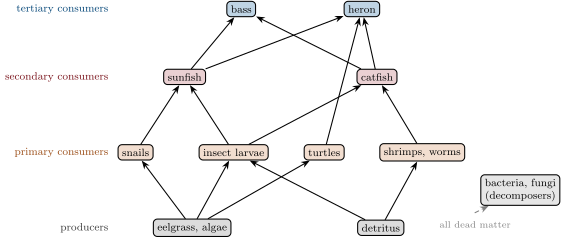
A food chain is a sequence of organisms each eating the one before: grass, grasshopper, frog, snake, hawk. In a real community each species eats several and is eaten by several, and the chains interlock into a food web, whose arrows point from the eaten to the eater — in the direction of the energy. Chains are short: rarely more than four or five links, for a reason the next section gives.
26.3 The flow of energy
Definition 26.6 (Productivity)
The gross primary productivity (GPP) of an ecosystem is the rate at which its producers fix energy by photosynthesis, per unit area and time (, or grams of carbon or dry matter); the net primary productivity (NPP) is what remains after the producers’ own respiration — the organic matter actually made available to the rest of the system. Secondary productivity is the rate at which consumers build their own biomass from what they eat. Biomass is the standing stock, the mass present at a moment; productivity is a flow, biomass a store, and the ratio of the two is the turnover time.
Theorem 26.7 (The ten-percent rule)
Of the energy entering one trophic level as food, only about a tenth — between and — reaches the next level as its food. The rest is not eaten, is not assimilated (leaves as faeces), or is respired by the level itself. The energy available therefore falls tenfold per level, which is why food chains rarely exceed four or five links, and why the biomass and numbers of top predators are small.
Partial proof. The energy assimilated by a level is what it eats minus what it excretes; of that, respiration takes what the level spends on living (Chapter 1), and only the remainder — its growth and reproduction — is available to be eaten. Each of the three fractions (eaten, assimilated, converted to biomass) is well below one: for a herbivore on a meadow about of the plant growth is eaten, of that assimilated, and of that turned into flesh, giving ; for a carnivore, which eats and assimilates more of its prey, about . The rule is an observed regularity, not a law; its size is what the measurements give. ∎
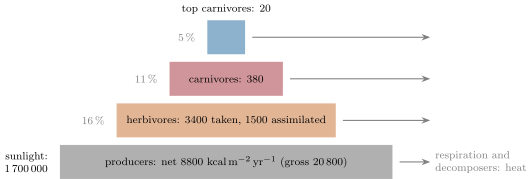
Evidence. Lindeman (1942) measured, in a small lake, the energy fixed by the plankton and the energy held and respired at each level above it, and found each level passing on about a tenth. Odum (1957) drew the full budget of a Florida spring: of per square metre per year of sunlight, the producers fixed (gross), respired and left net; the herbivores took and passed to the carnivores; the carnivores passed to the top carnivores. The efficiencies were , , and — the ten-percent rule within a factor of two at each step. ∎
Proposition 26.8 (Pyramids)
Stacking the trophic levels gives a pyramid. A pyramid of energy (flow per level) is always upright: each level can only pass on less than it received. A pyramid of biomass (standing stock) is usually upright but can be inverted: in the open sea the phytoplankton, eaten as fast as it grows, weighs less at any moment than the zooplankton living on it, because it turns over in days while the animals last months. A pyramid of numbers can be any shape: one oak feeds thousands of caterpillars. Energy is the honest measure.
Method 26.9 (Drawing up an energy budget)
- Measure GPP: by gas exchange (oxygen released or taken up by a plot or a bottle in light and dark: light minus dark gives gross, light alone gives net), or by harvest (biomass gained per year plus what was eaten and shed).
- Measure, for each consumer level, the intake (what it eats), the assimilation (intake minus faeces), the respiration (its oxygen consumption) and the production (growth plus offspring assimilation minus respiration).
- Trophic efficiency between levels production of the upper level production of the lower. Check that respiration plus production plus decomposition of each level sums to its assimilation.
- Convert to common units (, or grams of carbon at about ) and draw the pyramid; the sum of all respiration should approach the GPP over a year in a steady ecosystem.
Example 26.10 (Why the top is thin)
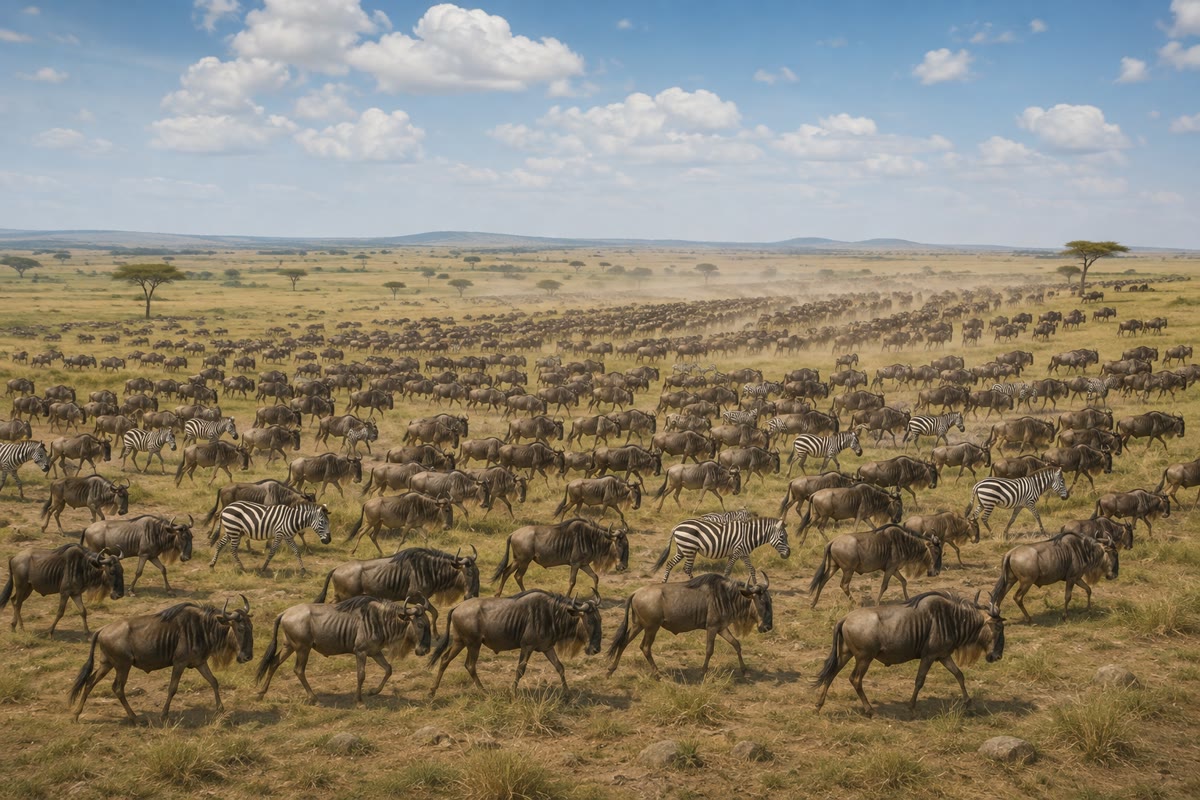
A square kilometre of savanna makes some of grass a year; the grazers turn it into of antelope and buffalo; the lions into of lion — one or two animals. To feed a tiger, a forest must be large enough that its tenth of a tenth of a tenth of the sunlight is a whole deer every week: a hundred square kilometres a tiger, which is why large carnivores are rare, roam far, and vanish first when a habitat shrinks.
Proposition 26.11 (Productivity of the biomes)
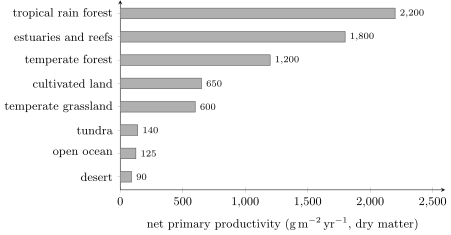
Net primary productivity per unit area is set by light, temperature, water and nutrients: tropical rain forest g of dry matter per square metre per year; temperate forest and cultivated land ; grassland ; tundra and desert below ; the open ocean about (light plentiful, nutrients scarce), upwelling coasts and reefs . The ocean, two thirds of the planet, contributes about half of global production; the forests, a tenth of the land, contribute a third of the land’s. Where water and nutrients are ample, productivity tracks light and warmth; where they are not, it tracks them.
26.4 Counting diversity
Definition 26.12 (Species richness, diversity index)
The species richness of a community is the number of species in it. Richness alone ignores abundance: a wood with a hundred oaks and one of each of nine other trees is less diverse than one with ten of each. The Shannon index
where is the fraction of individuals belonging to species , rises with both richness and evenness; it is when all species are equally abundant and near zero when one dominates. The evenness is . Diversity generally rises from the poles to the tropics, with area, with time since the last disturbance, and with the productivity of the site up to a point.
Method 26.13 (Sampling a community)
- Sample with a method suited to the organisms (quadrats, nets, traps, transects) and record the number of individuals of each species.
- Plot the number of species found against the number of samples (or individuals): the curve rises steeply, then flattens; where it flattens, the richness is nearly complete. Compare communities only at equal sampling effort.
- Compute and the evenness; compare with the rank–abundance plot (species ranked by abundance, on a log scale), whose slope shows dominance.
- Interpret: low evenness points to a dominant species or a stress; a fall of over time points to a change in the biotope.
Example 26.14 (Two woods)
Wood A: 100 oaks and one each of nine other trees; , evenness . Wood B: ten each of the same ten species; , evenness 1. Same richness, five times the diversity.
26.5 Exercises
Exercise 26.1 ★
Define ecosystem, community and biotope, with the example of a pond.
Solution
Solution of Exercise 26.1.
The pond ecosystem is the community — all its populations: algae, pondweed, snails, insect larvae, frogs, fish, bacteria — together with the biotope: the water, its temperature, light, dissolved gases and minerals, the mud.
Exercise 26.2 ★
Distinguish habitat from niche, and fundamental from realised niche.
Exercise 26.3 ★
From the spring’s energy pyramid, compute the efficiency from sunlight to gross production, and the fraction of the net production that the herbivores took.
Solution
Solution of Exercise 26.3.
; herbivores took of net production.
Exercise 26.4 ★
Name the four trophic groups and say which one closes the cycle of matter.
Solution
Solution of Exercise 26.4.
Producers, consumers (primary, secondary, tertiary), decomposers, detritivores; the decomposers, which return minerals from dead matter to the producers.
Exercise 26.5 ★★
A meadow’s NPP is (). Rabbits eat of it, assimilate of what they eat, and turn of what they assimilate into rabbit. Compute the rabbit production per hectare and the trophic efficiency NPP-to-rabbit.
Solution
Solution of Exercise 26.5.
NPP ; eaten ; assimilated ; rabbit , i.e. per hectare ( of rabbit at ). Efficiency .
Exercise 26.6 ★★
Explain why a pyramid of biomass can be inverted in the sea but a pyramid of energy never is.
Solution
Solution of Exercise 26.6.
Biomass is a stock: phytoplankton that is eaten as fast as it grows need never accumulate, so the standing crop of producers can be less than that of the longer-lived animals feeding on it. Energy is a flow: every level receives all it will ever have from the one below and must lose part of it as heat, so the flow can only shrink upward.
Exercise 26.7 ★★
Compute the Shannon index and evenness for a sample of 50 A, 30 B, 15 C and 5 D. Compare with four species at 25 each.
Solution
Solution of Exercise 26.7.
: ; evenness . Four at 25 each: , evenness 1.
Exercise 26.8 ★★
In a light-and-dark bottle experiment, the oxygen in the light bottle rises by in a day and in the dark bottle falls by . Compute the gross and net productivity of the water in milligrams of oxygen per litre per day, and in grams of carbon ( of of C).
Solution
Solution of Exercise 26.8.
Net of per litre per day; respiration ; gross . In carbon: gross , net of C per litre per day.
Exercise 26.9 ★★
Why are there no food chains of ten links, and why do islands and deserts have shorter chains than forests?
Solution
Solution of Exercise 26.9.
Each link keeps a tenth: ten links would leave a billionth of the primary production, too little to feed a single animal over any area. Where production is low (desert) or the area small (island), the tenth-of-a-tenth runs out after fewer links; a forest’s high production supports one or two more.
Exercise 26.10 ★★★
A human can eat grain directly or feed it to cattle. With a trophic efficiency of for cattle, compute the land needed to feed one person on beef versus on grain if the field yields of grain per hectare and a person needs a year. What does this say about the human trophic level and the planet’s carrying capacity?
Solution
Solution of Exercise 26.10.
Grain: needs a sixth of a hectare. Beef: of beef energy needs of grain, hectares — ten times the land. Eating at the second level costs a level’s worth of energy; a planet feeds ten times more people on grain than on grain-fed meat, and the human trophic level, averaged over diets, is a large term in the carrying capacity.
Exercise 26.11 ★★★
The open ocean has a low NPP per square metre but half the world’s production. Reconcile the two, and explain why the ocean’s fisheries are concentrated in a few percent of its area.
Solution
Solution of Exercise 26.11.
Per square metre the ocean is a desert, but it covers two thirds of the planet, so a low rate times an enormous area gives half the total. Its production is limited by nutrients, which sink out of the lit surface; where currents bring them back up (coastal upwellings, shelves), production is ten times higher, and there, on a few percent of the sea, the fish and the fisheries concentrate.
Exercise 26.12 ★★★
“An ecosystem is a machine for turning sunlight into heat, with life as the by-product.” Discuss in a paragraph: energy flow versus matter cycling, what the decomposers do, and what the sentence leaves out.
Solution
Solution of Exercise 26.12.
Energy enters as light, passes through a few levels of organisms, and leaves entirely as heat: in that sense the ecosystem does turn sunlight into heat, and the decomposers, respiring everything the consumers did not, are where most of it goes. But the matter is not consumed: carbon, nitrogen and phosphorus cycle, returned by the same decomposers to the producers, so the system persists; and the organisms are not a by-product but the structure through which the flow is organised — the niches, webs and pyramids are what the energy builds on its way through. The sentence has the thermodynamics and misses the biology.
26.6 Problem: The Budget of a Spring
Problem 26.1
Weekend problem — Odum’s spring drawn up level by level: sunlight to grass, grass to snail, snail to fish, fish to heron, with the respiration and the decomposers, ending on the trophic efficiencies at each level
A spring receives of sunlight per square metre per year. Its producers fix (gross) and respire . Herbivores eat of plant matter, of which they assimilate , respire and turn the rest into growth and offspring. Carnivores eat , respire and produce the rest; top carnivores eat , respire and produce . Everything not eaten or respired goes to the decomposers, who respire it. Take and per gram of dry biomass.
Part I — The producers.
- Compute the net primary productivity.
- Compute the efficiency of photosynthesis: gross production over sunlight. Compare with the of Chapter 14 and list three losses that separate them.
- What fraction of the gross production do the producers respire?
- How much of the net production is eaten by herbivores, and how much goes directly to the decomposers?
- Express the NPP in grams of dry matter per square metre per year and place the spring among the biomes of the chapter.
- How much of the sunlight, per square metre and year, leaves the spring as heat without ever having passed through a living organism?
Part II — The consumers.
- Compute the herbivores’ production and their assimilation efficiency (assimilated/eaten).
- Compute the herbivores’ production efficiency (production/assimilated).
- Compute the trophic efficiency from producers to herbivores: herbivore production over net primary production.
- Compute the carnivores’ production and the trophic efficiency herbivores-to-carnivores.
- Compute the trophic efficiency carnivores-to-top carnivores.
- How much energy per square metre per year reaches the top carnivore’s own tissues? What fraction of the sunlight is that?
- Why does the assimilation efficiency rise from herbivores to carnivores?
Part III — The decomposers and the balance.
- List every flow to the decomposers (uneaten net production, herbivore faeces and uneaten herbivore production, and so on) and sum them.
- Compute the total respiration of the ecosystem: producers, herbivores, carnivores, top carnivores and decomposers.
- Compare it with the gross production. What does the comparison mean for the spring’s biomass over a year?
- What fraction of the gross production is respired by decomposers?
- Draw the pyramid of energy with the four levels’ production and label the efficiencies.
Part IV — Stocks, turnover and change. The standing biomass is of producers, of herbivores, of carnivores and of top carnivores.
- Convert each biomass to kilocalories and draw the pyramid of biomass. Is it upright?
- Compute the turnover time (biomass/production) of each level. Which turns over fastest, and why?
- A heron of lives on the spring’s top-carnivore production. How many square metres does it need?
- The spring is enriched with fertiliser and its gross production doubles, but the herbivores cannot eat faster. What happens to the extra production, to the decomposers’ respiration, and to the oxygen of the water at night?
- A new fish is introduced that eats the herbivores’ eggs and halves their production. Predict the carnivores’ production and the herons’ numbers, and the fate of the eelgrass.
- Explain why removing the top carnivores would change the eelgrass far more than removing the same energy’s worth of herbivores.
- State the result: the trophic efficiencies at each of the three transfers, the efficiency of sunlight to gross production, and the fraction of the sun’s energy that reaches the top carnivores.
Solution
Solution of Problem 26.1.
1. per square metre per year. 2. . Losses: light not absorbed (half the spectrum, reflection, water), leaves saturated at full sun or shaded, photorespiration, and the plants’ own respiration (already counted between gross and net). 3. . 4. Eaten ; directly to decomposers . 5. : like a temperate forest or a rich grassland. 6. , of it: reflected, transmitted, or absorbed by water and rock and re-radiated as heat. 7. Production ; assimilation efficiency . 8. . 9. ( if reckoned on what was eaten, ). 10. Carnivore production ; efficiency (they ate of the produced). 11. . 12. ; , a few millionths. 13. Meat is digestible and close in composition to the eater; plant matter is fibrous and largely indigestible, so a herbivore loses more of its intake as faeces. 14. Uneaten net production ; herbivore faeces ; herbivore production not eaten ; carnivore faeces (assimilation not given; take eaten minus respired minus production , all assimilated) and uneaten carnivore production ; top-carnivore production : total . 15. . 16. Equal to the gross production: the spring is in a steady state, storing no biomass from year to year. 17. (most of the rest is the producers’ own respiration). 18. Producers , herbivores , carnivores , top carnivores ; efficiencies , , . 19. , , , : upright, each level a tenth or less of the one below. 20. Producers years; herbivores year; carnivores years; top carnivores years. The plants turn over fastest: short-lived tissue, grazed continuously; the top carnivores are long-lived animals whose stock is renewed slowly. 21. A heron of is about dry, , and needs about that in production each year to replace itself and its young: of spring — in practice far more, since it also respires: at a day, a year of intake, i.e. of the level below it (carnivore production ), which is what a heron’s territory looks like. 22. The extra net production is not eaten and goes to the decomposers, whose respiration doubles; at night, with no photosynthesis, their oxygen demand can empty the water of oxygen and kill the fish — eutrophication. 23. Herbivore production falls to : carnivores get half their food, their production falls toward , the top carnivores’ toward 3, and there are fewer herons; the eelgrass, grazed less, thickens and more of it goes uneaten to the decomposers. 24. The top carnivores’ energy is tiny, but their effect is on the carnivores’ numbers, which control the herbivores, which control the grass: removing them lets the carnivores rise, the herbivores fall and the grass grow — a cascade through the web (Chapter 27); removing a few kilocalories of herbivores changes nothing but a few kilocalories. 25. Producers to herbivores (of NPP; of what was eaten), herbivores to carnivores , carnivores to top carnivores ; sunlight to gross production ; a few millionths of the sunlight ends in the top carnivores.