University Earth and Space Sciences — Year 2 · स्नातक वर्ष 2
16Sedimentary Basins Compared
Off the coast of the eastern United States, beneath the continental shelf, the Baltimore Canyon Trough holds at least of sedimentary rock. A borehole drilled into such a pile reads its history backwards: each unit it crosses was once the sea floor, at a depth that fossils and sediments record, and has since been buried and squeezed. The depth of every dated surface is a point on a curve of sinking. Yet most of the sinking was caused by the weight of the sediment itself. To learn what made the basin, that weight has to be taken off, layer by layer. This chapter shows how, and what the result says about the lithosphere.
You already know
From the Year 1 volume: sedimentary basin, subsidence and tectonic subsidence, accommodation, eustasy; compaction, decompaction and Athy’s law, the solid thickness of a layer; the sediment load, which amplifies subsidence by ; Airy isostasy; the lithosphere and its geotherm; continental rifts and passive margins. From the physics volumes: the heat equation and its Fourier solutions. From Chapter 13: the foreland basin, flysch and molasse.
16.1 Basins and what makes them sink
The Year 1 volume told basins apart by where they lie. Here they are told apart by what drives their subsidence.
Definition 16.1 (Intracratonic, rift and passive-margin basins)
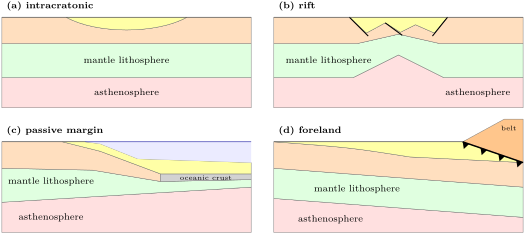
An intracratonic basin is a broad, round or oval basin in the interior of a continent, far from plate boundaries, that subsides slowly over very long times without major faulting. A rift basin is a basin bounded by normal faults in a continental lithosphere being stretched; its subsidence follows the stretching and then the cooling of the lithosphere. A passive-margin basin is the wedge of sediment, thickening oceanwards, that accumulates on a continental margin after break-up, over the thinned crust of the old rift.
The foreland basin of Chapter 13 completes the list, and the basins that open along strike-slip faults are left to the Year 3 volume. Three mechanisms make the floor of a basin sink:
- mechanical thinning: when the crust is stretched and thinned by faults, light crust is replaced by denser mantle and the surface goes down to restore isostasy;
- thermal contraction: a lithosphere that has been heated, by stretching or from below, cools afterwards, grows denser and sinks, slowly, over tens of millions of years;
- loading: the weight of a thrust belt, or of the sediment itself, bends the lithosphere down; that flexure belongs to the Year 3 volume, and the local, Airy form of the sediment load is enough here.
Rift basins combine the first two, passive margins inherit the second from their rift stage, foreland basins are made by the third. Intracratonic basins are the least understood.
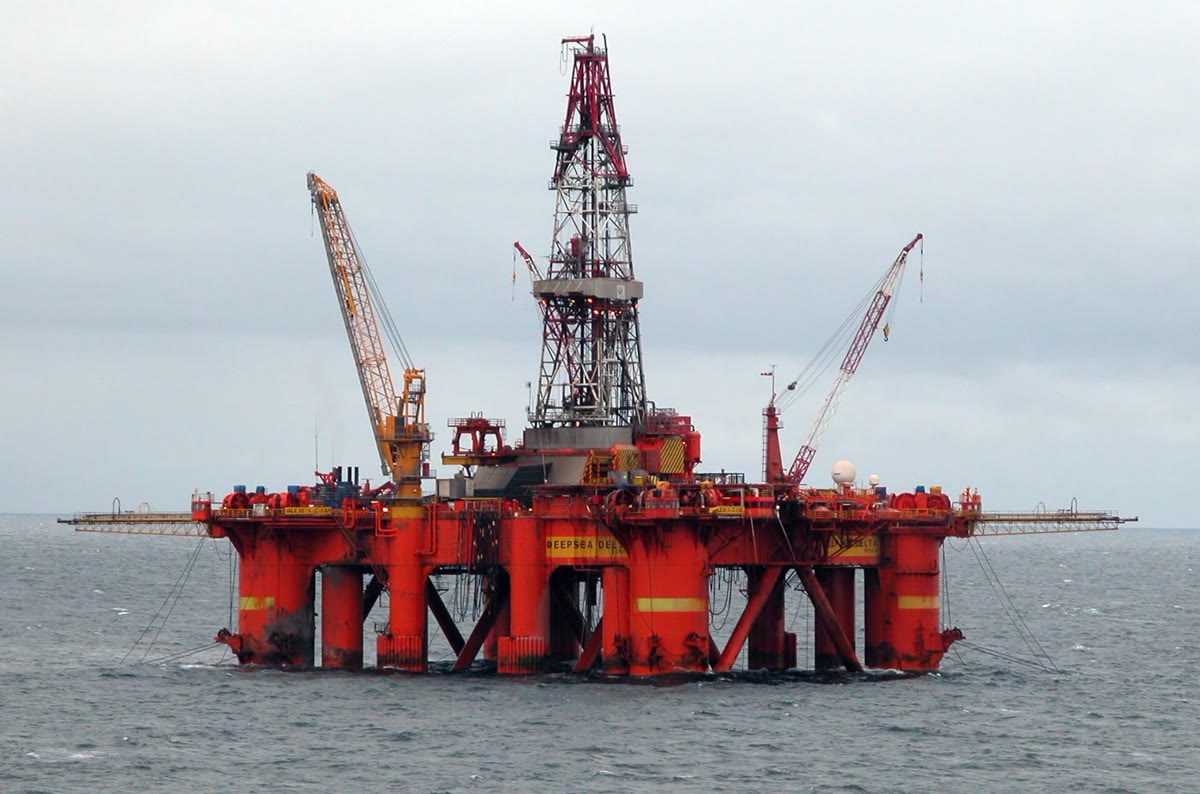
The rift basins of the North Sea are the classic case of the first two mechanisms. Grabens formed there from the Triassic, and the last major stretching lasted from the Middle Jurassic to the mid-Cretaceous; the faults then fell quiet, and the middle of the basin went on sinking as a broad saucer, filled by chalks, sandstones and, through most of the Tertiary, shales and mudstones. Loaded by water alone, its basement would have sunk a further 1100 to in the middle and 600 to on the flanks after the faulting had stopped.
The passive margin of the eastern United States shows the same sinking on a larger scale. Seismic profiles across the shelf show more than of Mesozoic and younger rock in the Baltimore Canyon Trough and in the Georges Bank basin, in units that thicken oceanwards. Its Jurassic depocentres follow the structures of the rift and the zones of its later thermal subsidence.
The Michigan basin is the type of the intracratonic basins. Ovate, some hundreds of thousands of square kilometres in area, it holds more than of Phanerozoic sediment laid down in distinct episodes over some 500 million years, with little faulting. Its episodes of faster subsidence coincide with those of other basins in the interiors of North America and other continents, which suggests a cause larger than one basin. Backstripping more than 57 000 well logs shows a long-lived, nearly circular pattern of subsidence, which the authors suggest mantle downwelling could explain, interrupted at the times of two orogenies on the distant margin of the continent. Why intracratonic basins sink is still debated.
16.2 Subsidence curves
A well, or a measured section, gives for each unit its present depth, its rock type and its age, read from fossils or from correlation. With the depth of water in which each unit was laid down, read from its fossils and sedimentary structures, it gives the history of the basin.
Definition 16.2 (Subsidence curve)
A subsidence curve of a basin at a site is the graph of the depth of a reference surface, usually the basement or the base of the oldest unit, below sea level, against time. The total subsidence curve uses the sediment thickness as it was at each time, plus the water depth; the tectonic subsidence curve replaces the sediment by water and removes its isostatic effect.
A unit is never as thick in the past as it is today. Buried, it lost porosity; its grains have not changed, but its water has been squeezed out. The Year 1 volume wrote the porosity at depth as Athy’s law, , and found the solid thickness of a layer between and ,
which stays the same when the layer moves. To decompact a unit to a shallower position, with its top now at , one looks for the base that holds the same solid thickness. The equation has no closed solution, but the fixed-point iteration
starting from converges in a few steps. The mass per unit area of the layer is that of its grains plus that of its pore water,
with the density of the grains; dividing the mass of a column by its thickness gives its mean density .
For the lithologies used in this chapter, sand, shale, chalk and shaly sand, the table below gives the constants of Sclater and Christie (1980), as bundled in an open-source program. Sand keeps its porosity deepest, chalk loses it fastest.
| lithology | grain density () | surface porosity | decay length () |
|---|---|---|---|
| sand | 2650 | 0.49 | 3704 |
| shale | 2700 | 0.63 | 1960 |
| chalk | 2710 | 0.70 | 1408 |
| shaly sand | 2680 | 0.56 | 2564 |
16.3 Backstripping
A total subsidence curve mixes two causes: whatever made the basin, and the weight of what filled it. Separating them is the purpose of the next procedure, the central tool of basin analysis.
Definition 16.3 (Backstripping)
Backstripping is the reconstruction of the tectonic subsidence of a basin through time: the units of a well are removed one by one, from the youngest, the remaining ones are decompacted at each step, and the isostatic effect of the sediment and water load is removed to give the depth at which the basement would have stood under water alone.
The last step is an isostatic balance. The Year 1 volume made it for a basin filled to sea level; the general case adds the depth of water and the level of the sea.
Proposition 16.4 (Airy backstripping)
Let a basin hold, at some time, a sediment column of thickness and mean density , under a water depth , while the sea stood above its present level. In local isostasy over a mantle of density , with water of density , the tectonic subsidence at that time, measured from present sea level, is
Proof. Compare two columns over the same lithosphere, down to a depth of compensation below both. In the first, water of depth lies over the sediment of thickness ; in the second, water alone fills a basin of depth below the same sea surface. Their masses are equal:
with the common depth of the compensation level below the sea surface. Hence , which is the first two terms. If the sea stood higher than today, that extra water is no part of the basin’s own subsidence: removing it, the water-loaded basement rises by , and its depth below today’s sea level is smaller again by ; together, . ∎
With and , a column of sediment of mean density counts for of its thickness in tectonic subsidence: more than half of the thickness of a basin’s fill is made room for by its own weight. A sea higher than today lowers the result by . The water depth and the past sea level are the weakest data: fossils give a range of water depths, often hundreds of metres wide on the slope, and the tectonic subsidence inherits that range.
Method 16.5 (Backstripping a well)
- List the units from the base, with the present depths of their tops and bases, their lithology constants , the ages of their tops, and the water depth at each of those ages.
- Compute the solid thickness of each unit from its present depths.
- For the age of the top of unit , remove all the younger units. Put the top of unit at depth zero and decompact it; put each older unit, in turn, under the one above it and decompact it.
- Add up the thicknesses to give , and the masses to give the mean density .
- Apply Proposition 16.4 to obtain ; the total subsidence is .
- Repeat for each age, from the oldest to the present; plot and against age.
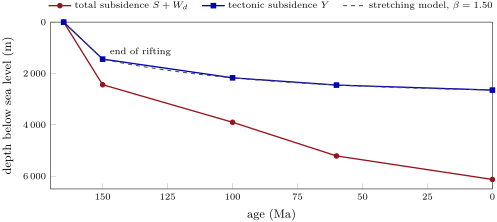
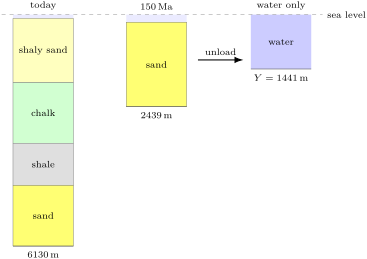
The figure below shows the result for an invented well in a rift basin. Four units were cored: a syn-rift sand laid down while faults were active, between 165 and ; then a shale, a chalk and a shaly sand. Today, no decompaction is needed: the basement lies at and the column has a mean density of , so that under of water. At , the sand alone, decompacted at the surface, was thick, with a mean density of : under of water, . The total subsidence is more than twice the tectonic one, and the tectonic curve shows a fast first stage, then a slowing sinking: the shape of a rift.
16.4 The stretching model
Why does a rift basin sink first fast and then slowly? In 1978 D. McKenzie proposed a model so simple that its parameters can be fitted to a single well.
Definition 16.6 (Stretching model; stretching factor; syn-rift and post-rift subsidence)
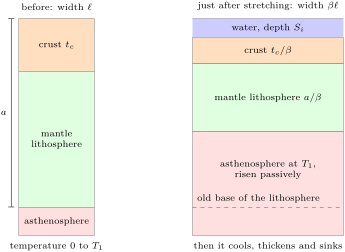
The stretching model of a basin represents rifting as an instantaneous, uniform stretching of the whole lithosphere by pure shear: crust and mantle lithosphere are thinned by the same factor, and hot asthenosphere rises passively to fill the space, after which the lithosphere cools. The stretching factor is the ratio of the width of the stretched region after stretching to its width before, equal to the ratio of the initial to the final thickness of the crust. The subsidence produced during stretching is the syn-rift subsidence; that produced afterwards by the cooling of the lithosphere is the post-rift subsidence, or thermal subsidence.
Stretching in nature takes a finite time, millions of years. Later versions of the model let it last, but as long as it is not too slow the simple instantaneous version gives the subsidence roughly but correctly, since after the stretching the cooling proceeds in much the same way.
Proposition 16.7 (Subsidence in the stretching model)
Let a lithosphere of thickness , with a crust of thickness , have a linear geotherm from at the surface to the temperature of the asthenosphere at its base; let crust and mantle have densities and , with the thermal expansion coefficient. If it is stretched instantaneously by and the basin filled with water of density :
the syn-rift subsidence is
the post-rift subsidence, a time after stretching, is, to the first term of a series,
where is the thermal diffusivity and is the thermal time constant of the lithosphere.
Proof. (1) Compare the column before stretching with the column just after, down to the old base of the lithosphere, at depth below the surface before stretching. Before, the crust of thickness and the mantle lithosphere are at temperatures ; after, both are thinner by and their temperatures run from to over , so that a point at depth below the base of the water has ; beneath, the asthenosphere at has density ; above, water fills the depth . The mass of a layer of density in which grows linearly from to is . Before, the column holds
after, it holds the water, the thinned crust and mantle lithosphere, and the asthenosphere that fills the rest of the depth :
Isostasy makes the two equal. Collecting the terms in on one side and the factor on the other, and expanding, gives the formula; the algebra is Exercise 16.11.
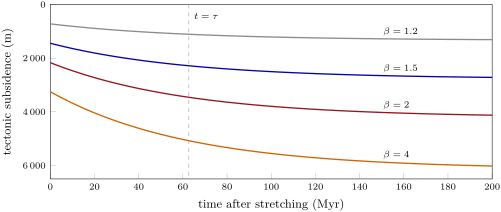
(2) After stretching, the plate cools by conduction between a surface held at and a base held at , towards the linear profile it started from. The excess temperature solves the heat equation with zero values at top and base, and so is a sum of terms ; each cools with its own time, . The heat lost makes the column contract by , and the extra water that fills the space sinks it further by the factor . Only odd terms contribute; keeping the first one, whose coefficient is computed from the initial profile, gives the expression. The others cool nine or more times faster, and after about ten million years they shift the subsidence by a nearly constant amount, less than for from 1.2 to 4 with the values below. ∎
The parameters of McKenzie’s paper are , , , , (at ), ; with sea water at they give and . With a crust of , the syn-rift subsidence is .
Three features of the model carry to real basins.
- The syn-rift step grows with , and so does the post-rift subsidence; but their ratio changes little, so that both parts point to the same if the model holds.
- The time scale of the post-rift subsidence does not depend on : it is set by the thickness of the lithosphere alone. After , of the thermal subsidence is done; after , about . A rift that stopped two hundred million years ago hardly sinks any more.
- The syn-rift term is a competition between the light crust thinned, which makes the surface sink, and the hot asthenosphere risen, which buoys it up. With a thin crust the second wins and stretching raises the surface (Exercise 16.10).
To fit a well, the tectonic subsidence at the end of rifting gives , hence for a crust; the post-rift curve is then predicted and compared with the rest of the backstripped points. In the invented well, gives , and the curve passes within a few metres of the later points (figure in Section 16.3). Real basins are rarely so obliging. In the central North Sea, stretching of 50 to in the middle, from 1.5 to 2, reproduces the amplitude and rate of the post-rift subsidence. On the margin of the eastern United States, only one segment, the Long Island Platform, has an early post-rift fill as thick as uniform stretching predicts; in the Georges Bank Basin and the Baltimore Canyon Trough the fill is 1.5 to 3 times thicker, and other causes must be at work.
16.5 Basins compared
The table below gathers the four families. The curves differ in shape and in time scale, and a subsidence curve is often the first clue to the nature of a basin buried under younger rocks.
| basin | example | thickness and duration | shape of the tectonic subsidence curve |
|---|---|---|---|
| rift | central North Sea | grabens from the Triassic; last stretching Middle Jurassic to mid-Cretaceous; 1.1 to of water-loaded post-rift sinking | a fast syn-rift step, then an exponential slowing with of tens of Myr |
| passive margin | Baltimore Canyon Trough | more than since the Jurassic | as a rift, with a large post-rift part; the fill thickens oceanwards |
| foreland | North Alpine Molasse | more than at the thrust front, late Eocene to late Miocene | deepest against the belt and migrating with it; its inner part finally overridden by the thrusts |
| intracratonic | Michigan | more than in episodes over some 500 Myr | slow, with episodes of faster sinking shared by distant basins |
A foreland basin sinks under a load that moves towards it: the basin migrates with the belt, the Alpine one by at least over the European craton, and its inner part is finally overridden and carried by the thrusts, as the Subalpine Molasse was in Chapter 13. A rift slows down as it cools, whatever its stretching. An intracratonic basin sinks slowly and long, in pulses; neither stretching nor a load explains it well, which is why it remains a research question.
In the lab — Subsidence analysis
Basin analysts do the work of the method box with programs. One open-source program, for instance, reads a drill site as a list of units with their ages, depths and lithologies, and a table of lithologies with their grain density, surface porosity and decay length. Its backstripping module decompacts the units and returns the tectonic subsidence at each age; since a palaeo water depth is known only as a range, the user gives a minimum and a maximum and the program returns the two subsidences and their mean. A second module works the other way: from a model of tectonic subsidence it predicts the water depths of the past, which can be checked against the fossils. Analysts then fit stretching factors, test sea-level curves, and map the subsidence of a whole basin from hundreds or thousands of wells.
Exercises
Data for the exercises, unless stated otherwise: , , ; stretching model with , , , , , ; a crust gives ; lithology constants in the table of Section 16.2.
Exercise 16.1 ★
Name the family of each basin and the main cause of its subsidence: (a) the Michigan basin; (b) the central North Sea; (c) the Baltimore Canyon Trough; (d) the North Alpine Molasse; (e) the Indo-Gangetic plain in front of the Himalaya.
Solution
Solution of Exercise 16.1.
(a) Intracratonic: slow subsidence in pulses over hundreds of millions of years, without major faulting; its cause is debated. (b) Rift: mechanical thinning of the crust during stretching, then thermal contraction as the lithosphere cools. (c) Passive margin: the thermal subsidence inherited from the rift stage, amplified by the load of a thick sediment wedge. (d) and (e) Foreland: the lithosphere bent down by the load of the thrust belt, the Alps and the Himalaya.
Exercise 16.2 ★
A basin holds of sediment of mean density . (a) Find its tectonic subsidence if the sediment reaches sea level. (b) And if of water lie on top? (c) What fraction of the thickness of the fill is due to the load of the fill itself?
Solution
Solution of Exercise 16.2.
(a) . (b) . (c) Without its load, the basement would lie at : of the thickness is made room for by the load.
Exercise 16.3 ★
Seismic refraction shows that a crust has been thinned to in a rift. (a) What is ? (b) How thick is the lithosphere just after stretching? (c) What is the syn-rift subsidence under water?
Solution
Solution of Exercise 16.3.
(a) . (b) . (c) .
Exercise 16.4 ★
(a) Check that (). (b) Some programs use : what is then? (c) What would it be for a lithosphere thick, with ? (d) What fraction of the post-rift subsidence is done after , and after ?
Solution
Solution of Exercise 16.4.
(a) , that is . (b) . (c) . (d) ; .
Exercise 16.5 ★★
A shale unit lies today between and . (a) Find its porosity at the top and at the base. (b) Find its solid thickness. (c) Find its mass per unit area and its mean density, the pores being full of water.
Solution
Solution of Exercise 16.5.
(a) ; . (b) . (c) ; .
Exercise 16.6 ★★
The shale of Exercise 16.5 is brought back to the surface. (a) Iterate the decompaction formula from until it changes by less than . (b) What is its mean density at the surface? (c) By how much was it thicker?
Solution
Solution of Exercise 16.6.
(a) : 1077, 1226, 1278, 1296, 1301, 1303, 1304; the layer is thick. (b) . (c) By , or : the water that compaction has squeezed out.
Exercise 16.7 ★★
In the central North Sea, the water-loaded basement sank 1100 to after the stretching that ended in the mid-Cretaceous, about ago. (a) What post-rift subsidence does the model give after for and ? (b) Do those values bracket the observation? (c) For which does the model give ? Use for and for and interpolate.
Solution
Solution of Exercise 16.7.
(a) . For : ; for : . (b) Yes: 1100 to lies between. (c) , so , within the 50 to of stretching inferred for the basin.
Exercise 16.8 ★★
The syn-rift basin of a stretching model is filled not with water but with sediment of density . (a) In the formula for , what changes? (b) Compute the sediment-loaded for with a crust, given that the numerator of the formula is and that . (c) Compare with the water-loaded value.
Solution
Solution of Exercise 16.8.
(a) The density of the fill replaces in the denominator. (b) The numerator is ; . (c) Under water, : the sediment-filled basin is 2.44 times deeper.
Exercise 16.9 ★★
A backstripped well gives at , assuming today’s sea level. (a) If the sea then stood higher, what is ? (b) If the fossils give a water depth between 100 and instead of , what range of follows? (c) Which of the two uncertainties is the larger?
Solution
Solution of Exercise 16.9.
(a) . (b) changes metre for metre with : from 1971 to . (c) The water depth, , against for the sea level.
Exercise 16.10 ★★★
(a) Show from Proposition 16.7 that stretching makes the surface rise instead of sink when . (b) Neglecting the small term , find the critical crustal thickness. (c) Refine it with one iteration. (d) Where on Earth would you look for rifts that rise as they open?
Solution
Solution of Exercise 16.10.
(a) has the sign of the bracket in its numerator, since the denominator, , is positive; it is negative, an uplift, when the bracket is. (b) gives . (c) . (d) Where the crust is thinner than about before stretching: in oceanic lithosphere, or in a continental crust already thinned by an earlier rifting.
Exercise 16.11 ★★★
(a) Write the isostatic balance of the proof of Proposition 16.7, part (1), and derive the formula for . (b) Show that the exact final post-rift subsidence, when the plate has returned to its linear geotherm, is . (c) Compute it for and compare it with the final value of the first-term formula.
Solution
Solution of Exercise 16.11.
(a) Before stretching, the column holds the lithosphere of mass ; after, . Equating them, , and expanding , : the formula. (b) The final profile is ; the initial one exceeds it by above and by below. The integrals are and , whose sum is . The contraction times this, loaded by water, gives the expression. (c) , against : the first term overstates the final subsidence by , .
Exercise 16.12 ★★★
A passive margin was stretched by and has been cooling for ; the basin has stayed full of sediment of mean density up to sea level. (a) Find the water-loaded post-rift subsidence. (b) How thick is the post-rift sediment? (c) In the Baltimore Canyon Trough the early post-rift fill is 1.5 to 3 times thicker than uniform stretching predicts: what thickness would that mean here? (d) Suggest causes.
Solution
Solution of Exercise 16.12.
(a) . (b) . (c) 6.9 to . (d) The model leaves out several things that could deepen the basin: a mantle lithosphere stretched more than the crust, a regional (flexural) response to the load of the sediment, a transient uplift of the margin during rifting followed by sinking, or a supply of sediment so large that the basin was overfilled and loaded beyond sea level on the shelf.
Problem 16.1
Weekend problem — Backstripping a well
In the invented Kestrel Basin, a well cored four units. From the base: a sand laid down during rifting, from 165 to , today between and ; a shale, 150 to , between and ; a chalk, 100 to , between and ; a shaly sand, to today, between and below the sea floor. Fossils give the water depth at the top of each unit when it was laid down: at , at , at ; today it is . Use the lithology table of the chapter, and for both sea and pore water, sea level as today, and the stretching model of the chapter with a crust. Depths are rounded to the metre.
Part I — Compaction.
- Find the porosity of the sand at its top and at its base today.
- Find the solid thickness of the sand.
- The solid thicknesses of the shale, chalk and shaly sand are , and . Check one of them.
- Find the mass per unit area of each unit today, then the mean density of the whole column.
- At the sand lay at the sea floor. Decompact it: iterate from until the change is less than .
- Find the mean density of the decompacted sand.
Part II — Backstripping.
- Find the tectonic subsidence at .
- Find the tectonic subsidence today. Why is no decompaction needed?
- A program gives at and at . Compute the mean rate of tectonic subsidence in each of the three intervals since .
- Find the total subsidence today and compare it with the tectonic subsidence.
- What fraction of the depth of the basement today is due to the load of the sediment?
- If the sea at had stood higher than today, what would have been then?
Part III — Fitting the stretching model. Rifting is taken as instantaneous and ending at .
- Which point of the curve gives the syn-rift subsidence?
- Find the stretching factor , to two decimals.
- How thick were the crust and the lithosphere just after stretching?
- With rounded, compute and the final post-rift subsidence.
- Predict at 100, 60 and .
- Compare with the backstripped values.
- The fit is close because the well is invented. Give three reasons why a real well would not fit so well.
Part IV — The next 50 million years.
- How much more tectonic subsidence will occur in the next ?
- If the water depth stays at , how much sediment of density can accumulate in that time?
- What fraction of its final post-rift subsidence has the basin already done?
- When was half of it done?
- To sum up: what stretching factor does the well record?
Solution
Solution of Problem 16.1.
1. at the top; at the base. 2. . 3. Shale: . 4. Shaly sand: ; chalk: ; shale: ; sand: . Total , . 5. : 1993, 2171, 2221, 2235, 2238, 2239, 2239: . 6. . 7. . 8. . The units are measured at their present depths: they are already as compacted as they are today. 9. per million years from 150 to ; from 100 to ; since: the sinking slows down. 10. , 2.31 times the tectonic subsidence. 11. . 12. . 13. The point at the end of rifting, : , if no thermal subsidence took place during the of rifting. 14. . 15. of crust and of lithosphere. 16. ; . 17. . At , : , ; at : , ; today: , . 18. The model is deeper at each point: 2173 against 2171, 2455 against 2453, 2650 against 2648. 19. Palaeo water depths known only to within a hundred metres or more; past sea levels different from today’s; a rifting that lasted , during which part of the heat was already lost; flexure rather than local isostasy; a mantle stretched more or less than the crust; a crust not thick before rifting. 20. . 21. . 22. . 23. after the end of rifting: at . 24. : the crust was stretched to one and a half times its width.