বইগুলো এখনো বাংলা ভাষায় পাওয়া যায় না — ইংরেজি সংস্করণ দেখানো হচ্ছে।
University Earth and Space Sciences — Year 2 · স্নাতক দ্বিতীয় বর্ষ
31Field and Lab Methods II
Every number in this book’s petrology chapters began as a rock in a bag, a thin section under a microscope and a powder in an instrument. A mineral composition plotted on a phase diagram, the silica content that names a lava, the strontium isotope ratio that traces a mantle source: each came out of a chain of operations that started at an outcrop, and each carries the errors of every link. This chapter follows that chain for the rocks of the Varden Hills basement: reading textures in thin section, counting minerals, analysing the whole rock, then single minerals, then isotopes, and asking at each step how good the number is.
You already know
From the Year 1 volume: field station, field notebook, oriented sample, thin section, polarising microscope, plane-polarised light, crossed polars; optical identification of the rock-forming minerals; recalculation of a mineral formula from an oxide analysis on a fixed number of oxygens, and of ferric iron by charge balance; foliation and schistosity; isochron, initial ratio and the least-squares line. From the chemistry books: mass spectrometry, inductively coupled plasma; calibration curve, limit of detection, limit of quantification, precision, trueness, bias, repeatability, standard deviation of the mean. From the physics books: characteristic X-rays and Moseley’s law; Bragg’s law; surface tension; propagation of uncertainties. From the mathematics books: binomial distribution, its mean and variance. From Chapter 9: modal composition, QAPF diagram. From Chapter 4: radiogenic isotope tracer, isotope reference standard.
31.1 Petrography: textures as a history
The Year 1 volume used the polarising microscope to identify minerals. A petrographer also reads how the grains are arranged, because the arrangement records the order in which they grew. Two textures are the commonest witnesses of crystallisation from a melt and of recrystallisation in the solid state.
Definition 31.1 (Ophitic texture, granoblastic texture)
An igneous rock has an ophitic texture when large pyroxene crystals enclose small, randomly oriented laths of plagioclase; the texture is typical of dolerite, gabbro and basalt. A metamorphic rock has a granoblastic texture when it is an aggregate of broadly equidimensional crystals of about the same size, in many cases anhedral, whose straight boundaries meet in threes at angles near .
In an ophitic rock the enclosed laths are whole and euhedral, and the pyroxene fills the space between them: the plagioclase grew first, the pyroxene around it. The angles of a granoblastic texture are those of grains that have had time to adjust their boundaries; petrographic teaching material reads such triple junctions as a sign of chemical and textural equilibrium. The angle follows from a balance of forces, the grain boundaries pulling on their common line like soap films (surface tension, from the physics books).
Proposition 31.2 (Angles at a triple junction)
Let three grain boundaries meet along a line, with tensions (energies per unit area) , , , and let be the angle between the two boundaries other than boundary . At equilibrium,
and three equal tensions meet at three angles of .
Proof. In a plane perpendicular to the junction, each boundary pulls the junction along its own trace with the force per unit length. At equilibrium the three forces add to zero, so placed head to tail they close a triangle. The angle of the triangle opposite the side is , whose sine is , and the sine rule in the triangle gives (31.1). If the three tensions are equal, the triangle is equilateral, each exterior angle is , that is . ∎
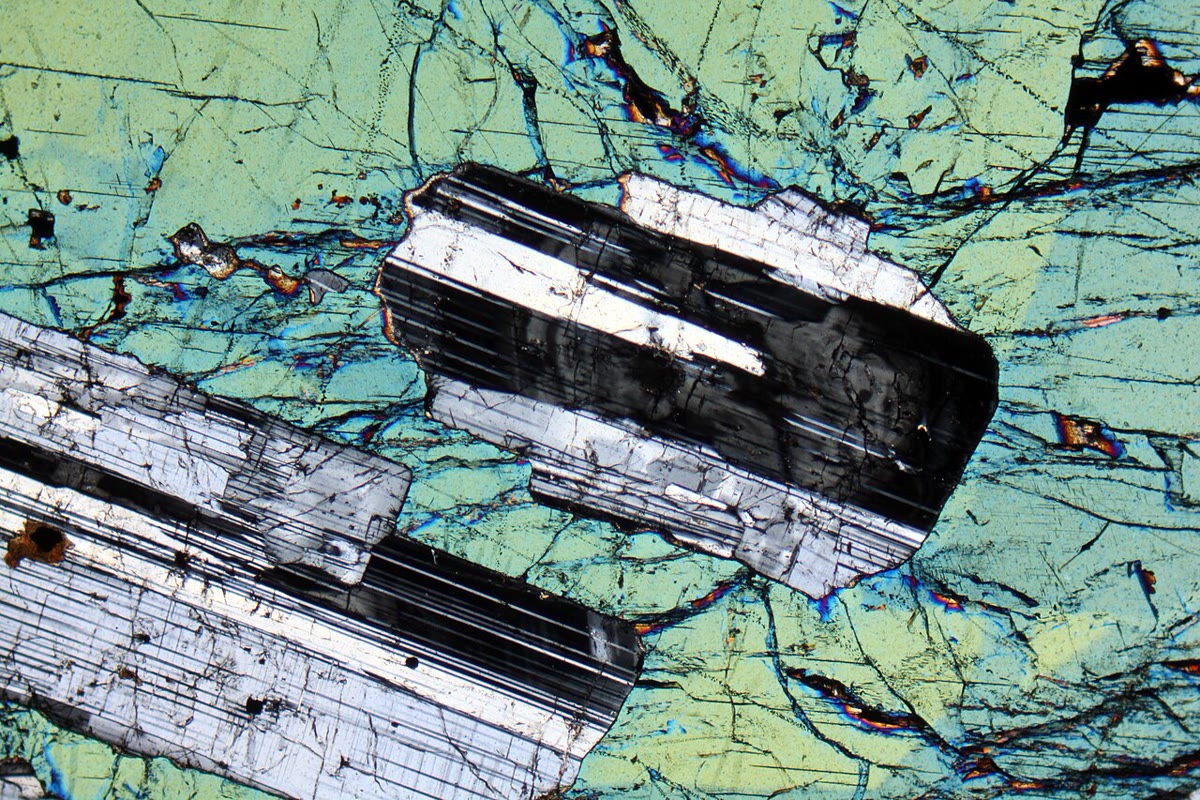
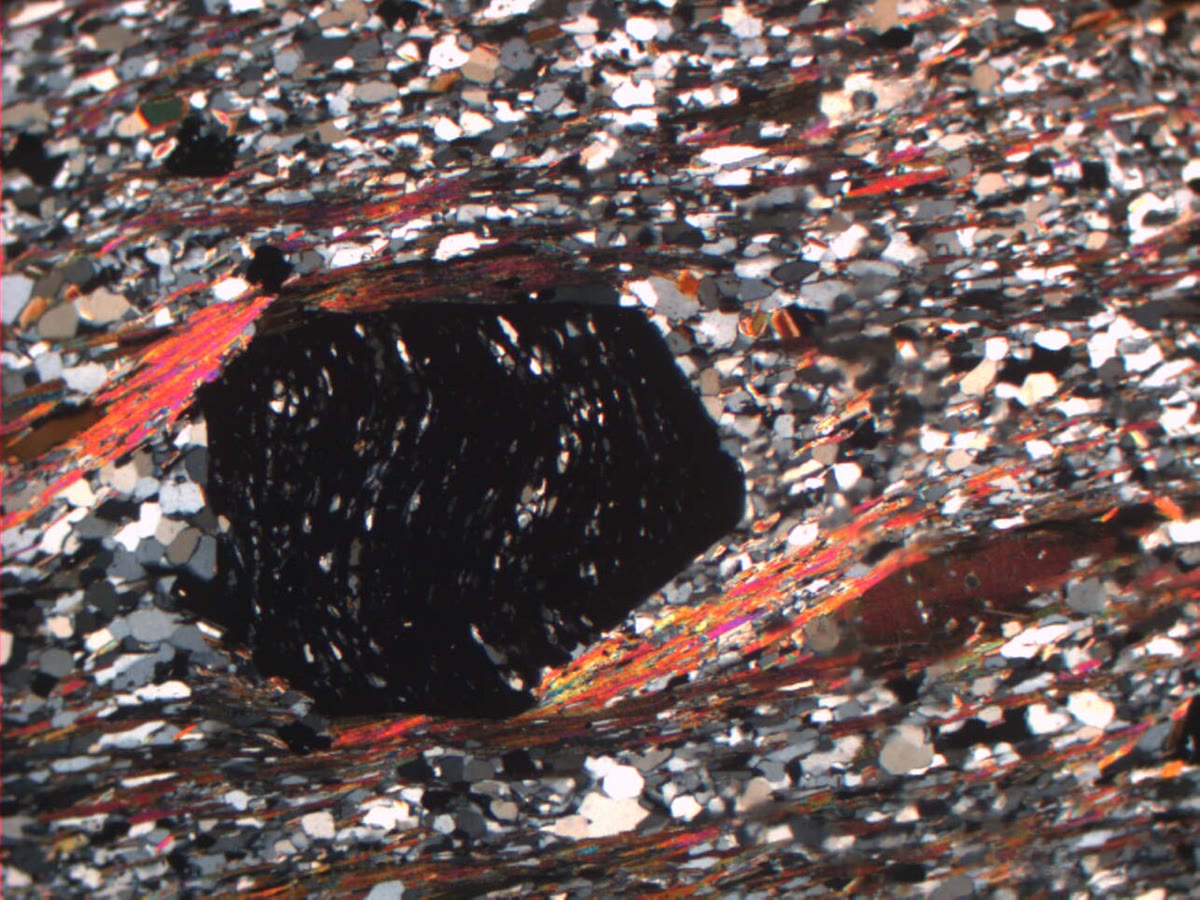
Metamorphic minerals do not all grow at the same pace. Some species overgrow the others into very large crystals, which engulf the small grains around them as they grow.
Definition 31.3 (Porphyroblast, poikiloblast, inclusion trail, corona)
A porphyroblast is a large crystal that grew during metamorphism within a finer-grained groundmass; garnet, staurolite, cordierite and chloritoid form them, from millimetres to several centimetres across. A poikiloblast is a porphyroblast that contains many inclusions of other minerals. An inclusion trail is a line of aligned inclusions inside a porphyroblast, which preserves the fabric of the groundmass at the time the crystal overgrew it. A corona is a rim of one or more new minerals completely surrounding a mineral that was breaking down, because it had ceased to be stable with its neighbours: a reaction texture, frozen before the reaction was complete.
Comparing the inclusion trail (, the internal fabric) with the foliation outside the crystal (, the external fabric) dates the growth of a porphyroblast relative to the deformation that made the foliation. The criteria below, drawn in the figure, are those of standard teaching notes.
Method 31.4 (Timing a porphyroblast from its inclusion trails)
Find a section cut perpendicular to the foliation, then compare and .
- Random inclusions, deflected around the crystal: it grew before the foliation formed (pre-tectonic).
- Straight cut off at the rim, discontinuous with a deflected : it grew over an older foliation, between two deformations (inter-tectonic).
- Curved , continuous with : it grew while the foliation formed, rotating or being overgrown as it grew (syn-tectonic; the spiral of a snowball garnet).
- Straight continuous with an undeflected : it grew after the foliation (post-tectonic).

Petrography is also quantitative. The proportions of the minerals of a coarse-grained igneous rock name it on the QAPF diagram (Chapter 9), and they are measured under the microscope.
Definition 31.5 (Modal analysis, point counting)
A modal analysis is the measurement of the modal composition of a rock. In point counting, a thin section is moved under the cross-wires of the microscope in equal steps along a regular grid, and the mineral under the cross-wires is recorded at each point; the proportion of the points that fall on a mineral estimates its proportion in the rock.
Proposition 31.6 (What point counting measures, and how well)
(a) In a rock without preferred orientation, the area fraction of a mineral in a section placed at random has, on average, the value of its volume fraction. (b) If points fall independently on a mineral of area fraction , the counted proportion has mean and standard deviation
points are needed to reach a standard deviation .
Proof. (a) Cut a block of rock of height into parallel sections of area . The volume of the mineral is , where is its area in the section at height ; dividing by the volume , the volume fraction is the mean of the area fraction over all heights, which is the expected value for a height drawn at random. (b) Each point falls on the mineral with probability , independently of the others, so the number of hits follows the binomial distribution of parameters and , of mean and variance . Dividing by gives the mean and the variance of . ∎
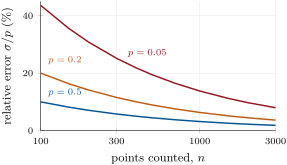
The proof of (b) supposes independent points, which a grid step larger than the grains approaches. For a mineral making of a rock, 500 points give , two percentage points; reaching one percentage point needs points, four times as many, because falls only as . The relative error, , is worst for the rare minerals (figure below, left). The counted proportions are then recalculated to name the rock: a mode with quartz, 30 alkali feldspar, 20 plagioclase and 40 mafic minerals gives Q, A and P of 16.7, 50.0 and 33.3 once the three felsic components are brought to a sum of 100. On the QAP triangle a rock with Q between 20 and 60 is a granite when its ratio P/(A+P) lies between 10 and : a syenogranite below 35, a monzogranite above; from 65 to 90 it is a granodiorite, above 90 a tonalite. The colour index is the proportion of dark minerals, that is the mafic and related minerals other than muscovite, apatite and primary carbonate; a rock is leucocratic below 35, mesocratic from 35 to 65, melanocratic from 65 to 90.
31.2 Whole-rock analysis
A whole-rock analysis needs a sample that represents the rock: a teaching sheet of the SERC geochemistry collection advises collecting a sample several times larger than the largest grain, which is crushed in stages and ground to a fine powder. The workhorse for the major elements is X-ray fluorescence. An X-ray beam, typically from a tube with a rhodium target, ejects inner electrons from the atoms of the sample, and each element then emits X-rays at its own characteristic energies (Moseley’s law, from the physics books).
Definition 31.7 (X-ray fluorescence analysis, fused bead, loss on ignition)
X-ray fluorescence analysis measures the concentrations of the elements of a solid from the intensities of the characteristic X-rays it emits under an X-ray beam, by comparison with standards of known composition. A fused bead is a glass disc made by melting a weighed rock powder with a weighed flux, such as lithium tetraborate, and casting the melt; it is homogeneous whatever the grains of the powder were. The loss on ignition is the fraction of its mass that a powder loses when heated at a fixed high temperature, mostly water and carbon dioxide driven off.
The intensity of a line is proportional to the abundance of its element only when the samples and the standards are alike, since the other elements absorb and enhance the radiation: these matrix effects, and those of grain size, are why the powder is melted into a glass, and why a mathematical correction is still applied. XRF measures the ten major elements and, above about , trace elements such as Rb, Sr, Zr and Ba, with detection limits of a few parts per million. It is weak for the light elements (atomic number below 11) and sees neither isotopes nor the oxidation state of iron.
In the lab — A batch of fused beads
In a procedure published by the US Geological Survey, of rock powder is heated in a platinum–gold crucible at for 40 minutes, and the loss of mass is reported as the loss on ignition. Lithium tetraborate is added, enough to leave after fusion; seven crucibles at a time are held in a furnace at and rocked for 35 minutes, then poured into moulds. In the spectrometer, an end-window rhodium tube irradiates each bead, and the intensities of the ten major elements are compared with those of standards. An analysis whose oxides add up to less than 97 or more than is repeated; one analyst completes about 250 samples a month.
The standards are themselves rocks, analysed so often that their composition is known better than any single analysis can measure it.
Definition 31.8 (Geochemical reference material)
A geochemical reference material is a natural rock, mineral or sediment, ground and homogenised in a large batch, for which one or more concentrations have well-established or certified values, used to calibrate instruments and to test the accuracy of a method.
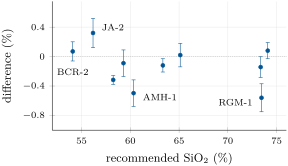
The USGS basalt BHVO-2, collected in 1995 from a lava that overflowed from the Halemaumau crater of Kilauea in 1919, has a recommended of and of strontium. A laboratory checks its own trueness by running such materials as unknowns, at the low, middle and high ends of its range: in the figure above, the USGS method recovers silica within of the recommended value for all ten rocks, from 54 to . Its blanks fix its limits: the limit of detection is taken as three standard deviations of independently prepared blanks, the lower reporting limit as five, and ten are often suggested for the limit of quantification.
Method 31.9 (Calibrating and checking a whole-rock analysis)
- Calibrate. Measure the intensity of each element in beads of several reference materials, and fit the least-squares line of the recommended concentration against the intensity.
- Measure. Convert the intensity of each unknown into a concentration with the line.
- Check. Run a reference material as an unknown in every batch and compare it with its recommended value; add the oxides and the loss on ignition, which should come close to .
- Report. Give the analysis as measured with its loss on ignition; for the classification diagrams, recalculate the oxides to a sum of 100 without the volatiles.
31.3 Mineral analysis: the electron microprobe
XRF gives the composition of the whole rock. The zoning of a garnet porphyroblast, the reactions recorded by a corona or the mineral pairs of a geothermometer need the composition of a single grain, and of points within it.
Definition 31.10 (Electron microprobe, wavelength-dispersive spectrometry)
An electron microprobe is an instrument that focuses a beam of electrons on a spot of a polished section and measures the characteristic X-rays emitted there, giving a quantitative analysis of a volume a few micrometres across. In wavelength-dispersive spectrometry, the X-rays fall on an analytical crystal that reflects to a detector only the wavelength satisfying Bragg’s law at its angle; crystal and detector move together on a circle (the Rowland circle) to select each element’s line in turn.
Spots can be as small as 1 to , and detection reaches a few tens of ppm by weight, for elements from boron (atomic number 5) upward. The counts are compared with those of standards and corrected for the effects of atomic number, absorption and fluorescence (a ZAF correction). A probe with four or five crystal spectrometers measures 10 to 12 elements in one analysis. It cannot detect hydrogen, helium or lithium, so the water of micas and amphiboles is missing from their totals; it cannot tell ferrous from ferric iron; and it reports oxides, from which the mineral formula is recalculated as in the Year 1 volume.
In the lab — A day on the microprobe
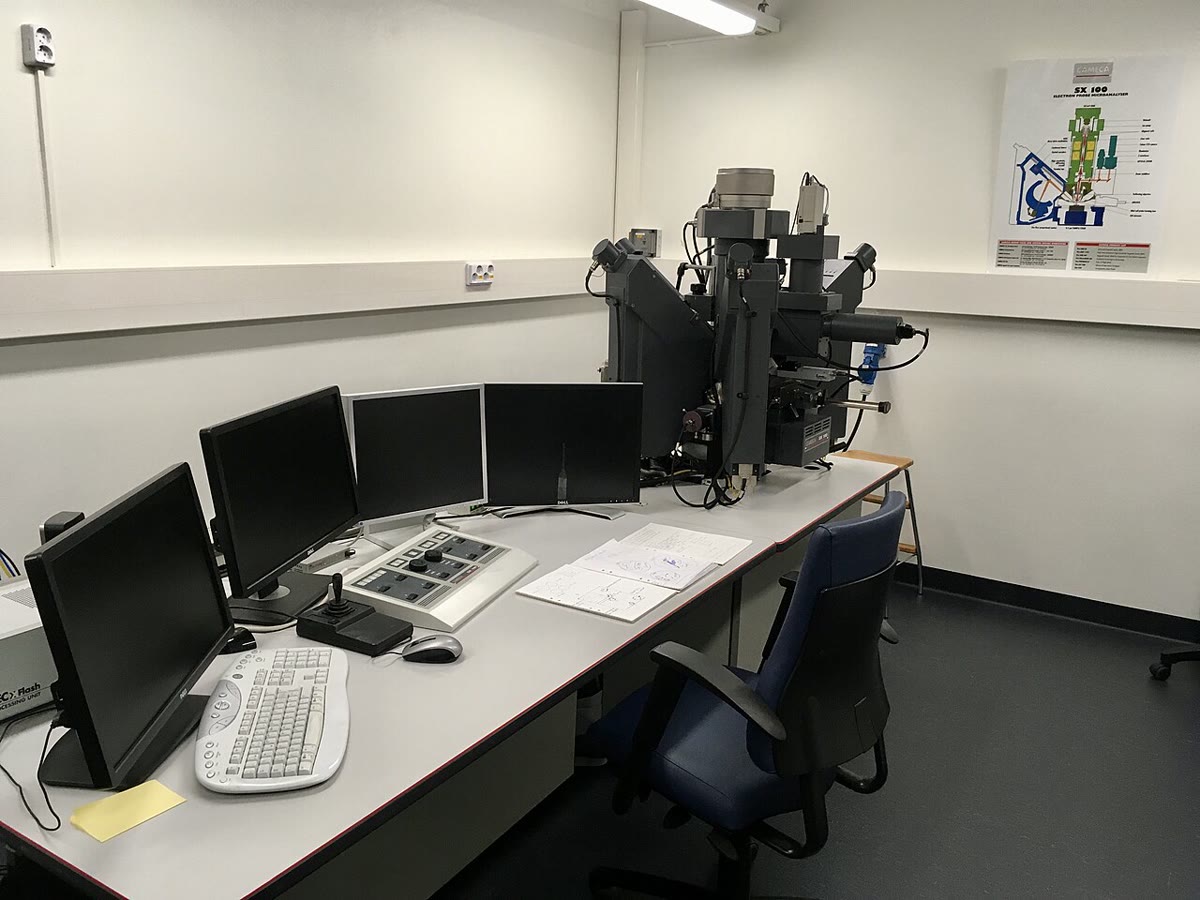
Thin sections for the microprobe are usually rectangles of , ground to and left without a cover glass, then polished flat. Most silicates are electrical insulators, so the section is coated with a thin conducting film, most commonly carbon, to carry away the charge of the beam. The analyst marks the grains to measure on photographs taken under the polarising microscope, loads the standards with the sections, and lets the instrument run through a list of points: a traverse from core to rim across a garnet, say.
31.4 Isotope analysis
Radiogenic isotope tracers and ages (Chapter 4) rest on ratios measured to 0.01–, on elements separated from the rock by dissolution and ion-exchange chromatography in a clean laboratory, with filtered air (typically Class 100 to 1000) so that dust adds nothing to the small amounts analysed.
Definition 31.11 (Thermal ionisation mass spectrometry, multi-collector ICP-MS, mass bias)
In thermal ionisation mass spectrometry (TIMS), a purified element is loaded on a thin metal ribbon and ionised by heating it under vacuum; the ions are accelerated across a potential of up to , separated by mass in a magnetic sector and collected. In multi-collector ICP-MS the ions come from an inductively coupled plasma, which ionises elements that are hard to ionise thermally, and several collectors measure the beams of different masses at the same time. The mass bias of a measurement is the departure of a measured isotope ratio from the true ratio of the sample caused by the instrument, which transmits or ionises one mass more readily than another.
Both instruments reach this precision. TIMS ionises generally less than of the atoms, and its mass bias changes continually during a run. The bias is corrected by fixing the ratio of two isotopes that no decay changes, which requires an element with at least three isotopes, two of them stable and not radiogenic. For strontium, is fixed at 0.1194, and one common form of the correction is the exponential law.
Proposition 31.12 (Exponential law of mass bias)
Suppose that every measured ratio of two isotopes of masses and is related to the true ratio by , with one exponent for the whole run. Then the measured ratio of a reference pair, whose true value is known, gives
for the reference pair , and every other ratio is corrected with the same .
Proof. Applied to the reference pair, the law reads ; taking logarithms, , which is (31.3). The exponent is common to all the ratios of the run by hypothesis, so it corrects each of them. ∎
For strontium the reference pair is with , and the corrected is the measured ratio times . The CIAAW abundances, of strontium-86 and of strontium-88, give the same value. Every session also runs an isotope reference standard: one laboratory measured on the reference material NBS 987 in seven runs.
Ratios alone do not give a concentration. For that, a known amount of a spike, a solution of the element artificially enriched in one isotope, is mixed with the dissolved sample before the chemistry, and the ratio is measured in the mixture. The TIMS laboratories use it for both concentrations and parent-to-daughter ratios.
Proposition 31.13 (Isotope dilution)
Let a sample contain moles of a reference isotope and a spike moles of it, and let , and be the ratios of a second isotope to in the sample, the spike and the mixture. Then
A relative error on gives the relative error , with the error magnification
which is smallest when .
Proof. Isotope is conserved on mixing: , so , which is (31.4). Its logarithmic derivative is , with as in (31.5). Up to the positive constant , , whose derivative vanishes at , a maximum of . ∎
Isotope dilution needs neither a calibration line nor a complete recovery of the element through the chemistry: once spike and sample are mixed, losses take both alike. A published strontium spike, for instance, contains strontium-84, with and , at of strontium per gram of solution. Its 86/88 ratio shows why the mass bias of a spiked mixture cannot be corrected by fixing at its natural value: the spike has moved that ratio.
31.5 A mapping campaign on the Varden inlier
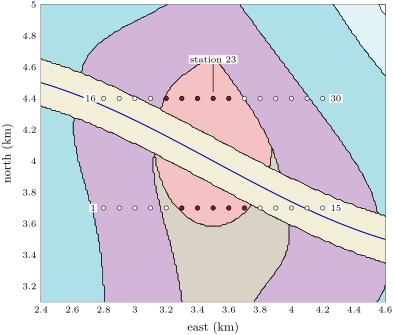
In the core of the Varden anticline, erosion has cut through the sandstone cover and exposed the basement: schist intruded by a granite. A campaign that is to supply the laboratory begins in the field. Two traverses are walked west to east across the inlier, with a station every ; at each the unit is recorded, and fresh samples are taken where the rock is unweathered, numbered with the station, and, where fabrics are to be measured, oriented. The figure shows what the stations meet: of the 30, ten are on granite, ten on the sandstone cover, one on the schist, one on limestone and eight on the alluvium of the valley floor, where no rock crops out.
In the field — Sampling for the laboratory

In the evening the party transfers the stations to the map, checks that every sample number in the notebooks matches a bag, and decides which samples go to which laboratory. One sample of each unit goes to the thin-section laboratory; the freshest granite and schist go for crushing and whole-rock analysis; a few granite samples are set aside for isotopes. The station number follows each sample through every step, from the bag to the thin section, the powder, the bead and the line of a data table, so that any odd result can be traced back to its outcrop.
31.6 The quality of a number
Each step of the chain adds its own error, and the methods of this chapter show the two kinds that the chemistry books distinguish. Point counting and isotope ratios have mostly random errors, which shrink as the counts grow, like ; calibration has systematic ones, which repetition does not reduce and which only a reference material reveals. The figure of the silica analyses shows both: the bars are the precision of the method, and a dot that misses zero by many times its bar divided by the square root of the number of analyses is a bias. The same element measured by two methods, strontium by XRF and by isotope dilution, is a further check, since the two share no calibration. Results are reported with their uncertainty, rounded to it, and with the reference materials run alongside them; a number without them cannot be compared with any other.
Exercises
Data for the exercises, unless stated otherwise: atomic masses H 1.008, O 15.999, Mg 24.305, Al 26.982, Si 28.085, K 39.098, Sr 87.62; isotope masses 85.909261, 86.908878, 87.905612; natural strontium , of ; the spike of the text, , of , atomic weight 83.9242, . Round to three significant figures unless stated otherwise.
Exercise 31.1 ★
(a) Name the texture or the crystal: (i) a dolerite in which plagioclase laths are wholly enclosed in large augite crystals; (ii) a marble of equal-sized calcite grains whose straight boundaries meet in threes; (iii) a staurolite crystal long crowded with quartz inclusions in a mica schist; (iv) a garnet surrounded by a continuous rim of plagioclase and pyroxene. (b) Three grain boundaries meet at , and . Find the ratio of the tension of the boundary facing the angle to that of the others.
Solution
Solution of Exercise 31.1.
(a) (i) Ophitic texture; (ii) granoblastic texture; (iii) a poikiloblast, a porphyroblast full of inclusions; (iv) a corona, a reaction rim around a garnet that was breaking down. (b) By (31.1), : that boundary pulls harder than the two others.
Exercise 31.2 ★
A coarse-grained rock contains quartz, 15 alkali feldspar, 40 plagioclase, 12 biotite and 8 hornblende. (a) Recalculate Q, A and P. (b) Find P/(A+P) and name the rock. (c) Find its colour index and qualify it.
Solution
Solution of Exercise 31.2.
(a) : Q , A , P . (b) P/(A+P) , between 65 and 90 with Q between 20 and 60: a granodiorite. (c) , below 35: leucocratic.
Exercise 31.3 ★
A count of 800 points finds a mineral at . (a) Find the standard deviation of this proportion, and its relative value. (b) What would it be with 3200 points?
Solution
Solution of Exercise 31.3.
(a) , that is percentage points, a relative error of . (b) Four times the points halve it: .
Exercise 31.4 ★
A powder of weighs after ignition, and the residue is fused with of flux. (a) Find the loss on ignition. (b) Find the mass fraction of the sample in the bead. (c) The glass contains . Find the silica of the ignited powder and of the original powder.
Solution
Solution of Exercise 31.4.
(a) The loss is , and . (b) . (c) Ignited powder: ; original powder: .
Exercise 31.5 ★★
(a) How many points are needed to measure an accessory mineral making of a rock with a relative standard error of ? (b) And a mineral making , with the same relative error? (c) Comment on the effort a rare mineral demands.
Solution
Solution of Exercise 31.5.
(a) and points. (b) and , so 234 points. (c) For a fixed relative error, grows as : the accessory mineral demands 21 times more points, more than a section usually provides.
Exercise 31.6 ★★
In the USGS results of the figure, the rhyolite RGM-1 gave with a standard deviation of 0.19 in 20 analyses (recommended 73.45), and the basalt BCR-2 gave 54.17 with 0.13 in 20 analyses (recommended 54.1). (a) Find the recovery of each, in per cent. (b) Find the standard deviation of each mean, and express each difference from the recommended value in units of it. (c) Which result shows a bias? Is the method less precise for RGM-1?
Solution
Solution of Exercise 31.6.
(a) RGM-1: ; BCR-2: . (b) RGM-1: , and ; BCR-2: , and . (c) RGM-1 is biased: its mean misses the recommended value by 13 times its own standard deviation, far more than chance allows (if the recommended value is right). BCR-2 is at the limit of what chance gives. RGM-1 is not less precise: its relative standard deviation, , is close to that of BCR-2, . The problem is trueness, not precision.
Exercise 31.7 ★★
A microprobe analysis of a pure phlogopite, , is to be checked. (a) Find the molar mass of the formula and the mass fraction of it contains. (b) Find the mass fractions of , , and , and the total an exact analysis would give. (c) Why is a total of about for a mica not a bad analysis?
Solution
Solution of Exercise 31.7.
(a) ; the two OH make one (), . (b) ; ; ; ; total . (c) The microprobe does not detect hydrogen: a mica analysis lacks its water, about , and should total near 96.
Exercise 31.8 ★★
A TIMS run on a strontium standard gives and . (a) Find the exponent of the exponential law. (b) Correct the ratio, to five decimals. (c) Was the light or the heavy isotope favoured in the run?
Solution
Solution of Exercise 31.8.
(a) . (b) . (c) The measured 86/88 is below the true ratio: the heavy isotope was favoured, and the measured 87/86 too high.
Exercise 31.9 ★★
To check its isotope dilution, a laboratory spikes of the reference basalt BHVO-2 with of the spike of the text, and measures in the mixture. (a) Find the moles of in the spike aliquot. (b) Find the moles of in the sample, and its strontium concentration in ppm. (c) Compare with the recommended .
Solution
Solution of Exercise 31.9.
(a) . (b) By (31.4), of ; strontium: in , (393.9). (c) A recovery of : the method is accurate within the rounding of the ratio.
Exercise 31.10 ★★★
For the strontium spike of the text (, ): (a) find the mixture ratio that minimises the error magnification, and its value there; (b) evaluate at , 0.5, 1.664 and 100; (c) explain why a mixture close to either end-member is to be avoided, and how much freedom the analyst has in practice.
Solution
Solution of Exercise 31.10.
(a) , where . (b) at 0.1, 1.13 at 0.5, 1.038 at 1.664 and 1.16 at 100. (c) Near the mixture hardly differs from the sample, near from the spike, and the difference that carries the information is lost in the error of : diverges at both ends. Between them the minimum is very flat ( from about 0.4 to 100), so the analyst only needs the right order of magnitude of the spike, which a rough concentration, from XRF for instance, provides.
Exercise 31.11 ★★★
A granite count finds 400 feldspar points, of them plagioclase. (a) Treating the plagioclase among the feldspar points as a binomial count, find the standard deviation of P/(A+P). (b) How far is the result from the granodiorite boundary, in standard deviations? (c) How many feldspar points would place it two standard deviations from the boundary?
Solution
Solution of Exercise 31.11.
(a) : . (b) standard deviations: the rock may well be a granodiorite. (c) needs , so 1048 feldspar points.
Exercise 31.12 ★★★
A mineral occupies a fraction of a rock. (a) Show that the probability that independent points all miss it is . (b) How many points give at least a chance of hitting at least once a mineral making of the rock? (c) The same for zircon at , and conclude on how an accessory mineral should be looked for.
Solution
Solution of Exercise 31.12.
(a) Each point misses with probability , independently: . (b) gives : 299 points. (c) : a grid count is the wrong tool; a rare accessory mineral is searched for by scanning the whole section.
Weekend problem
Problem 31.1
Weekend problem — From outcrop to analysis
Sample VH-23 of the Varden granite was taken at station 23 of the campaign. A thin section was point-counted on a regular grid of 1200 points: quartz 372, alkali feldspar 348, plagioclase 324, biotite 108, muscovite 36, opaque oxides 12. A powder of weighed after ignition at and was fused with of flux. Beads of three reference materials gave these intensities (thousands of counts per second, kcps): BCR-2, recommended , 21.66; AGV-2, 59.3, 23.70; RGM-1, 73.45, 29.37; the granite bead gave 28.63. The other oxides of the granite sum to . For the isotopes, of powder was dissolved and mixed with of the spike of the text; the sample is taken to have the natural strontium abundances of the exercises. Use the data of the exercises.
Part I — The mode.
- Find the modal proportion of each mineral.
- Find the standard deviation of the quartz proportion, and the relative standard deviation of the muscovite proportion.
- Find and the colour index , and qualify the rock.
- Recalculate Q, A and P to a sum of 100.
- Find P/(A+P) and name the rock on the QAPF diagram.
- With the binomial standard deviation of P/(A+P) over the 672 feldspar points, is the name secure?
- How many points would bring the standard deviation of the quartz proportion to one percentage point?
Part II — Silica by X-ray fluorescence.
- Find the loss on ignition.
- Find the mass fraction of the sample in the bead, and the silica of the glass if the ignited powder holds .
- Fit the least-squares line through the three reference materials; give to four decimals and to two.
- Find the of the granite, to two decimals.
- Find the residuals of the three reference materials. Is the line adequate?
- Add the oxides and the loss on ignition. Would the USGS procedure repeat this analysis?
- Recalculate the silica to a sum of 100 without the volatiles.
Part III — Mass bias.
- From the CIAAW abundances, find the natural and compare with the value used to normalise.
- An unspiked aliquot gives . Find to four decimals.
- It gives . Correct it, to five decimals.
- Find the bias per mass unit, in per cent.
- Why can this correction not be made on the spiked mixture of Part IV?
Part IV — Isotope dilution.
- Check that the spike holds strontium-84 and strontium-86.
- Find the moles of strontium and of in the spike aliquot, to four significant figures.
- Check the values and of the exercises.
- The corrected ratio of the mixture is . Find the moles of of the sample.
- Find the error magnification. With known to and the spike concentration to , find the relative uncertainty of the result.
- Find the strontium concentration of the Varden granite, in ppm.
Solution
Solution of Problem 31.1.
Part I. 1. Quartz , alkali feldspar 29.0, plagioclase 27.0, biotite 9.0, muscovite 3.0, opaque oxides 1.0. 2. ; muscovite: . 3. ; without the muscovite: leucocratic. 4. points: Q , A , P . 5. , with Q between 20 and 60: a granite, and between 35 and 65 a monzogranite. 6. : the boundaries at 35 and 65 lie 6.9 and 8.7 standard deviations away. The name is secure. 7. points.
Part II. 8. . 9. , and in the glass: the fusion dilutes the sample elevenfold. 10. , , , : per kcps, . 11. . 12. BCR-2 , AGV-2 , RGM-1 : all smaller than the standard deviations of the method (0.1 to 0.2), so the line is adequate over this range. 13. , between 97 and 101: not repeated. 14. .
Part III. 15. : the normalising value is the natural ratio. 16. . 17. . 18. The measured 86/88 is from the true value over two mass units: about per mass unit, in favour of the heavy isotopes. 19. The spike’s is 0.7661: the mixture’s 86/88 is no longer the natural 0.1194, and fixing it at 0.1194 would treat the spike as an instrumental bias.
Part IV. 20. Sum of the ratios to 88: ; and . 21. of strontium, and of . 22. and . 23. . 24. ; the ratio adds , the spike ; in quadrature , dominated by the calibration of the spike. 25. Strontium: , that is in . The Varden granite contains of strontium, .
এই অধ্যায়ে সংজ্ঞায়িত পরিভাষা-শব্দ
- Electron microprobe, wavelength-dispersive spectrometry
- Geochemical reference material
- Modal analysis, point counting
- Ophitic texture, granoblastic texture
- Porphyroblast, poikiloblast, inclusion trail, corona
- Thermal ionisation mass spectrometry, multi-collector ICP-MS, mass bias
- X-ray fluorescence analysis, fused bead, loss on ignition