বইগুলো এখনো বাংলা ভাষায় পাওয়া যায় না — ইংরেজি সংস্করণ দেখানো হচ্ছে।
University Earth and Space Sciences — Year 2 · স্নাতক দ্বিতীয় বর্ষ
4Isotope Geochemistry
Mangaia, in the southern Pacific, and Tristan da Cunha, in the southern Atlantic, are both volcanic islands built of basalt, and a hand specimen from one looks much like a hand specimen from the other, or from a mid-ocean ridge. Their isotopes tell them apart. The strontium of the Mangaia basalts carries the same proportion of strontium-87 as that of the ridges, about , while their lead is among the most radiogenic on Earth, with near 21.6 against 18.4 for the ridges. The Tristan basalts hold more strontium-87, 0.7050 to 0.7054, and less neodymium-143 than either. Melting does not sort isotopes of these heavy elements, so each lava carries the isotopic signature of the mantle that melted to make it: the Earth’s mantle is not one reservoir but several, which have kept different parent–daughter ratios for billions of years. This chapter uses the radioactive decay of rubidium, samarium, uranium and thorium as a set of tracers, follows the evolution of the mantle and the continental crust through the neodymium isotopes, separates the mantle into reservoirs and mixtures of reservoirs, discusses how fast the continents grew, and ends with the light stable isotopes of oxygen, hydrogen and carbon, which trace water and carbon through the Earth.
You already know
A radioactive parent decays at the rate , and in a closed system the daughter ratio grows as , being a stable isotope of the daughter; minerals or rocks formed together lie on an isochron, whose slope gives the age and whose intercept gives the initial ratio (high-school volume, final year; Year 1 volume, chapter on radiometric dating). A mass spectrometer separates ions by their mass-to-charge ratio (chemistry books’ Year 2 volume). The value of a sample is , in per mil, and the fractionation factor between two phases A and B is , being the ratio of the heavy to the light isotope; both are introduced, with the zero-point energies that cause isotope fractionation, in the chemistry books’ Year 3 volume. Incompatible elements, MORB and OIB were defined in Chapter 3.
4.1 Radiogenic isotopes as tracers
Three decay systems carry most of the information on the mantle and the crust. Rubidium-87 decays to strontium-87, samarium-147 to neodymium-143, and uranium and thorium, through their decay chains, to three isotopes of lead. Each parent and daughter differ in their behaviour during melting, and each daughter has a stable, non-radiogenic isotope against which it is measured.
| parent | daughter | ratio measured | decay constant (per year) | half-life (Ga) |
|---|---|---|---|---|
| Rb | Sr | 49.6 | ||
| Sm | Nd | 106.25 | ||
| U | Pb | 4.47 |
Definition 4.1 (Radiogenic isotope tracer)
A radiogenic isotope tracer is the ratio of a daughter isotope produced by a long-lived radioactive parent to a stable isotope of the same element, such as or , used to identify the source of a rock rather than to date it. The ratio of a reservoir grows at a rate set by its parent–daughter ratio, and so records the history of that ratio.
The two elements of a decay pair are separated whenever the mantle melts. In Chapter 3, rubidium proved more incompatible than strontium and neodymium more incompatible than samarium. A melt, and the crust it builds, therefore leaves the mantle with a high Rb/Sr and a low Sm/Nd; the residue keeps a low Rb/Sr and a high Sm/Nd. Over time the crust gains strontium-87 faster than its source and neodymium-143 more slowly; the depleted mantle does the opposite. The ratios of the two pairs move in opposite directions, a point the Sr–Nd diagram below makes plain.
Proposition 4.2 (Isotope ratios survive melting)
When a rock melts and the melt separates from the residue, the and ratios of the melt equal those of the source to within the precision of the measurements; only the parent–daughter ratios, Rb/Sr and Sm/Nd, are changed.
Proof. Admitted at this level. ∎
The statement rests on two facts. The isotopes of one element have the same electronic structure, so they enter a crystal or a melt almost equally; the relative mass difference between strontium-87 and strontium-86, about one per cent, is far smaller than for oxygen or hydrogen, and at high temperature the logarithm of an equilibrium fractionation factor falls as the inverse square of the temperature, towards 1. And the measurement itself corrects the fractionation that takes place in the mass spectrometer by fixing a ratio of two non-radiogenic isotopes (for neodymium, ), which would erase any small natural fractionation as well. A lava, therefore, samples the isotope ratios of its source, while its trace-element ratios also reflect the melting.
4.2 The evolution of mantle and crust
4.2.1 The chondritic reservoir
Samarium and neodymium are both refractory lithophile rare earths (Chapter 3): the bulk silicate Earth should have kept their chondritic ratio. The chondrites then give the Sm–Nd history of the undifferentiated Earth.
Definition 4.3 (Chondritic uniform reservoir)
The chondritic uniform reservoir (CHUR) is a model reservoir with the samarium–neodymium composition of the chondrites, closed since the formation of the Solar System. Its present ratios are and .
Run backwards with the isochron equation, CHUR had, when the first solids condensed ago (Chapter 2),
Since then its ratio has grown by 1.2 per cent. The differences between terrestrial rocks are a thousand times smaller, and are quoted in a more convenient unit.
Definition 4.4 (Epsilon notation)
The epsilon notation expresses the ratio of a sample, at a time before the present, as its relative deviation from CHUR at the same time, in parts per ten thousand:
Without a time, is the present value.
The mean MORB, with , has ; most rocks lie between and . A positive value means that the source of the rock has had, on average over the Earth’s history, a higher Sm/Nd than the chondrites: it is depleted in the more incompatible element, neodymium. A negative value means the opposite. The departure from the chondritic Sm/Nd is measured by the fractional deviation
which is the same whether the ratios are by mass or by atoms. With the CI values of Chapter 3 (Sm 0.145, Nd , ), the upper continental crust (4.7 and , 0.174) has .
Proposition 4.5 (Linear growth of )
A reservoir that separated from CHUR and has kept the fractional deviation since then changes its , forward in time, at the rate
where is time counted forwards. A reservoir with at its separation, a time ago, has today .
Proof. Write for and for . In a closed reservoir , with the time before the present; as , the factor differs from 1 by at most 3 per cent, and . Then , since . Dividing by , which changes by only 1.2 per cent over the age of the Earth, gives . With , and , per year, . ∎
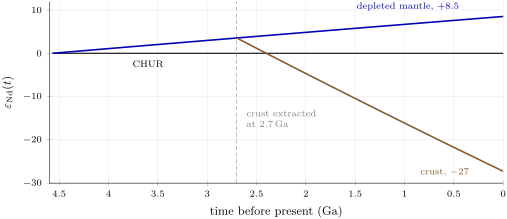
A crust with the Sm/Nd of the upper crust () therefore loses about 11 epsilon units per billion years relative to CHUR, while a mantle reservoir needs only to climb from 0 to the MORB value of in . The figure below follows the exact equations for three reservoirs: CHUR, a depleted mantle closed since the Earth formed with the Sm/Nd that brings it to the MORB value today (), and a crust extracted from that mantle 2.7 billion years ago with the upper crust’s Sm/Nd (). The crust started at , the value of its source at the time, and now stands at .
Definition 4.6 (Depleted mantle, enriched mantle)
A depleted mantle is a part of the mantle that has lost incompatible elements to melts, so that its Sm/Nd is higher and its Rb/Sr lower than chondritic; with time its becomes positive and its low. An enriched mantle is a part of the mantle that has gained incompatible elements, for instance from recycled crust or from small melts, with a negative or a high .
4.2.2 Two complementary reservoirs
If the continental crust and the depleted mantle were made from one chondritic reservoir, their neodymium must add back to the chondritic value. Neodymium is the carrier: each reservoir counts in proportion to the neodymium it holds.
Proposition 4.7 (Isotope mass balance)
Let reservoirs of masses and neodymium concentrations come from the division of one parent reservoir. Then, to a very good approximation,
both sides being evaluated at the same time, and the parent being followed as if it had stayed whole.
Proof. The number of atoms and the number of atoms are each conserved by the division, and each later grows (for ) or stays (for ) in each reservoir exactly as in the whole. Hence the -weighted mean of the ratios equals the ratio of the parent, . The share of in neodymium varies between reservoirs by much less than a part in a thousand, so weighting by is the same as weighting by . Finally is a linear function of at a given time, , and a weighted mean of linear functions is the linear function of the weighted mean. ∎
With the upper-crust value of of neodymium taken for the whole crust, a continental crust of at , that is or 0.51 per cent of the mass of the silicate Earth, holds per cent of the silicate Earth’s neodymium (primitive mantle, ). If the crust has an average of , a negative contribution of units must be balanced by the mantle: a reservoir at the MORB value of would need to hold about a fifth of the silicate Earth’s neodymium (Exercise 4.9). This is one of the arguments that the depleted mantle sampled by the ridges is not the whole mantle.
4.3 The reservoirs of the mantle
The isotopic ratios of oceanic basalts sample the mantle without passing through the continental crust. Plotted against each other, they show both the complementarity of crust and depleted mantle and the existence of other reservoirs.
Strontium and neodymium isotopes are anticorrelated in most oceanic basalts: a lava with a high has a low . This band is called the mantle array; it follows from the opposite behaviour of the two pairs during melting (rubidium less compatible than strontium, samarium more compatible than neodymium). The mean MORB lies at its depleted end, with and . Ocean island basalts spread from there towards lower and higher , but not along a single line.
Definition 4.8 (Mantle end-member)
A mantle end-member is one of the extreme isotopic compositions from which the Sr, Nd and Pb isotope ratios of oceanic basalts can be built by mixing. Four are commonly named: DMM, the depleted MORB mantle (low , high ); HIMU, for a high in its source (very radiogenic lead, above 20, with low ); EM1, enriched mantle 1 (moderately high , negative , unradiogenic lead); and EM2, enriched mantle 2 (high ).
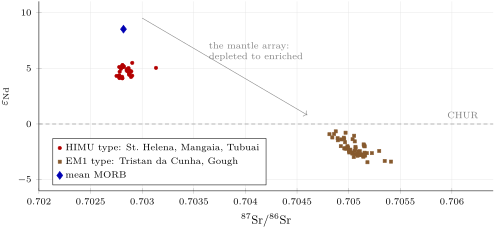
The island groups of the figure above are not random. The St. Helena group, which includes the Austral Islands (Mangaia and Tubuai among them) and Ascension, plots below the main array and has the most radiogenic lead ( above 20; Mangaia reaches 21.5 to 22.0). The Kerguelen group, Tristan da Cunha, Gough and Kerguelen, lies at moderately high and negative , always with unradiogenic lead. The Society group, with Samoa and the Marquesas, defines a shallower Sr–Nd trend reaching very high strontium ratios: two Samoan lavas have of 0.7186 and 0.7205, higher than modern seawater (0.7092). The St. Helena, Kerguelen and Society groups are the HIMU, EM1 and EM2 types.
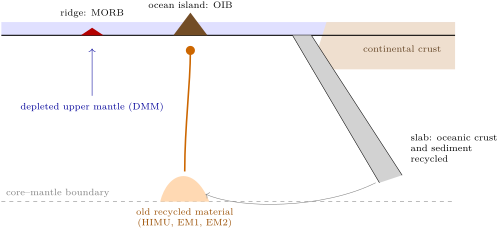
A ratio that differs between two parts of the mantle must have been maintained by a difference in parent–daughter ratio for a long time: a difference of 10 units of takes, by the linear-growth proposition, 1 billion years at or 4 billion years at . The mantle reservoirs are therefore old. What they are is read from the parent–daughter ratios their isotopes demand. HIMU needs a high U/Pb and a low Rb/Sr over a long time, which fits oceanic crust that lost lead and rubidium in the fluids released above a subduction zone and was then stored in the mantle for one or two billion years. EM1 and EM2 need a low Sm/Nd and, for EM2, a high Rb/Sr: the signature of material derived from the continents, such as recycled sediment, or of mantle enriched by small melts. These interpretations are debated; the measurements are not.
4.4 Mixing
Many isotope arrays are mixtures. A lava may come from a source that is a mixture of two reservoirs, or a magma may take in some of the crust it crosses. The two cases obey the same algebra.
Proposition 4.9 (Mixing hyperbola)
Let a mixture contain a mass fraction of component A and of component B. For an element of concentrations , and isotope ratios , :
- the concentration of the mixture, , and its isotope ratio, , satisfy with constants and : the mixtures lie on a straight line in a plot of against ;
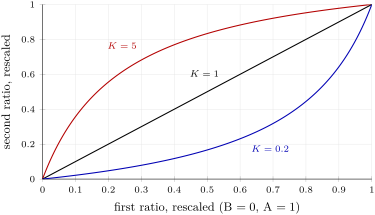
- two such ratios of two elements, and , lie on a hyperbola, called the mixing hyperbola, which is a straight line only if the ratio of the two elements is the same in A and B. Its curvature is set by .
Proof. (1) Eliminate : . Then is linear in , , and . (2) The share of the element that comes from A is , and is linear in ; likewise is linear in . With , and . Eliminating gives , a hyperbola in the plane, hence in the plane; it is the straight line when . ∎
A component rich in an element dominates the isotope ratio of that element in the mixture. A recycled sediment holds tens of times more neodymium than the depleted mantle, and a few per cent of it in a mantle source pulls the of the mixture most of the way towards its own (problem). The HIMU-type islands of the Sr–Nd figure lie off any mixing curve between MORB and the EM1 islands: no mixture of two components explains all oceanic basalts, and the end-members are at least four. A magma that assimilates continental crust moves along a mixing curve towards the crust; its position on the curve gives the proportion of crust taken in, a calculation taken up with crystallisation in Chapter 8.
4.5 Growth of the continental crust
The continental crust is the complement of the depleted mantle; how fast it was extracted is one of the oldest questions of isotope geochemistry, and still open. Several records bear on it.
Definition 4.10 (Crustal growth curve)
A crustal growth curve gives the volume, or mass, of continental crust in existence as a function of time, as a fraction of the present volume. It reflects the balance between the generation of new crust from the mantle and its destruction by recycling into the mantle.
The rocks preserved today give a first curve: less than a quarter of the volume of the juvenile continental crust preserved today is older than , and no known rock has a crystallisation age older than . But the preserved crust is what survived, not what was made. Other curves are built from the neodymium isotopes of shales, which average the upper crust exposed to erosion at the time they were deposited; from the hafnium isotopes of zircon grains, which record whether the magma that crystallised them came from new or reworked crust; or from the argon isotopes of hydrothermal quartz, which track the degassing of the crust. Several recent models of this kind put at least 60 to 80 per cent of the present volume of continental crust in place by . The two views can be reconciled only if a great deal of early crust was destroyed: in one box model fitted to both records, 2.3 to 2.6 times the present volume of continental crust has been generated since the Earth formed, and 1.3 to 1.6 times that volume has been returned to the mantle.
Present-day subduction zones show the recycling at work. Arc magmatism adds about 2.5 cubic kilometres of new crust a year, 1.5 at intra-oceanic arcs and 1.0 at continental margins (2.7 as a long-term mean), while subduction carries back about 3.2 cubic kilometres a year; to within the uncertainties, the continents have not grown during at least the Phanerozoic. The isotopes of the mantle end-members, which call for recycled crust and sediment, are the other side of the same account.
4.6 Stable isotopes
The isotopes of the light elements, hydrogen, carbon, nitrogen, oxygen and sulfur, are not produced by decay in measurable amounts. They are fractionated instead by physical, chemical and biological processes, with relative mass differences of up to a factor of two for hydrogen and deuterium, and their variations are reported as values relative to agreed standards.
Definition 4.11 (Isotope reference standard)
An isotope reference standard is a material whose isotope ratio defines the zero of a scale. Two are used in the Earth sciences. VSMOW (Vienna Standard Mean Ocean Water) defines and of waters, silicates and most other materials; its absolute ratios are and . VPDB (Vienna Pee Dee Belemnite) defines and the of low-temperature carbonates; its absolute ratios are and .
The names recall the history: SMOW was an average ocean water, and PDB the carbonate of a belemnite fossil from the Pee Dee formation; the original materials ran out and were replaced by reference materials calibrated to them, distributed by the International Atomic Energy Agency in Vienna and by NIST. On the VSMOW scale, the oxygen of VPDB has per mil (Exercise 4.2): a marine carbonate is that much heavier than the ocean water it grew from.
4.6.1 Water
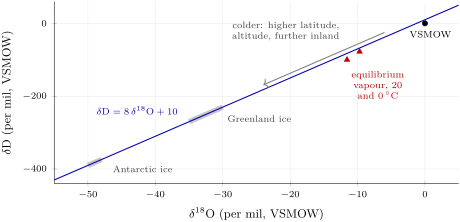
Ocean water lies near , by the definition of VSMOW. Evaporation favours the light isotopes: at equilibrium with liquid water at , with fractionation factors of 1.0098 for oxygen-18 and 1.084 for deuterium, the vapour would have per mil and per mil; the vapour above the oceans is lighter still, about per mil in , because evaporation is also a kinetic process. As an air mass moves inland and towards the poles and cools, it rains out, and each rain takes the heavy isotopes first; the remaining vapour, and the rain and snow that follow, become lighter and lighter. Greenland ice typically has of to per mil, Antarctic ice as low as .
Proposition 4.12 (Meteoric water line)
Rain and snow from all over the world, and the fresh waters derived from them, lie close to the meteoric water line
established empirically by Craig in 1961. Its intercept, 10 per mil, is called the deuterium excess; individual regions have values between about 0 and 20.
Proof. Admitted at this level. ∎
The slope can be understood without the full theory of condensation, which is left to the Year 3 volume. In each step of condensation, the liquid and the vapour differ by about per mil in each isotope, and the two shifts stand in the ratio , which is 8.6 at and 9.5 at : as the vapour is depleted step by step, falls about eight times faster than . The intercept is not zero because the vapour leaving the ocean is formed out of equilibrium. Ocean water, at the origin, therefore lies below the line.
4.6.2 Rocks and carbon
The mantle is remarkably uniform in oxygen: peridotite xenoliths have a bulk of about per mil, and the mean MORB ; magmas from the mantle stay within about one per mil of these values. Rocks that have equilibrated with water at the Earth’s surface differ: kaolinite clays, for instance, are about 27 per mil richer in oxygen-18 than the meteoric water in which they formed. A magma that assimilates such rocks is shifted away from the mantle value: a second test of crustal contamination, independent of the radiogenic isotopes.
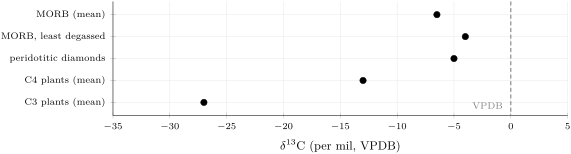
Carbon has two stable isotopes, and the large fractionation of photosynthesis sorts its reservoirs. Plants that fix carbon by the common C3 pathway average per mil, those of the C4 pathway, mostly tropical grasses, about . The carbon of the mantle, sampled by the least degassed MORB, by carbonatites and by most diamonds, lies near to per mil; the bicarbonate of seawater is about 8.5 per mil heavier than atmospheric carbon dioxide. Organic carbon is thus about 20 per mil lighter than the mantle, and the burial of organic matter in sediments leaves the remaining carbon of the ocean and atmosphere heavier: the of marine carbonates records the share of carbon buried as organic matter through time, one of the proxies of Chapter 24.
In the lab — Measuring an isotope ratio to five decimals
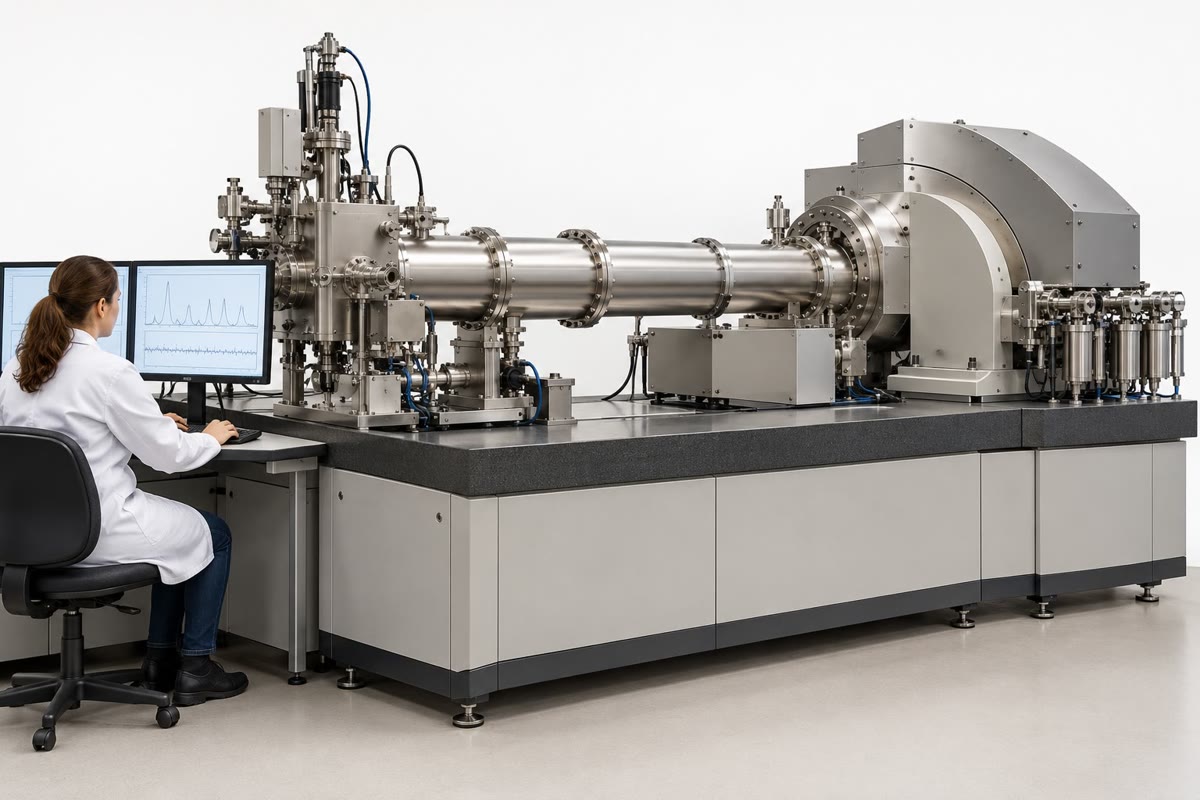
To measure , a geochemist dissolves a gram or less of rock powder in acids in a clean laboratory, where filtered air keeps dust out. Neodymium is separated from the other elements on columns of ion exchange resin, because an isobar of the same mass, such as samarium-144, would add to the signal of neodymium-144. A few hundred nanograms of the purified neodymium are loaded on a metal filament and ionised by heating in a thermal ionisation mass spectrometer, or nebulised into a plasma in a multi-collector instrument; collectors measure several isotopes at once. The ratios are corrected for the fractionation inside the instrument by fixing at 0.7219, and a reference material is analysed with every batch: a laboratory whose standard drifts by a few parts per million from its accepted value corrects its samples by the same amount.
4.7 Exercises
Exercise 4.1 ★
A basalt from Tristan da Cunha has and one from Mangaia 0.51285. Compute their and that of the mean MORB (0.513074). Which sources have had a higher Sm/Nd than chondrites?
Solution
Solution of Exercise 4.1.
Tristan: . Mangaia: . MORB: . The sources of Mangaia and of MORB, with positive , have had a higher Sm/Nd than chondrites on average; the source of Tristan a lower one.
Exercise 4.2 ★
The ratio is in VSMOW and in VPDB. What is the of VPDB on the VSMOW scale? A calcite has per mil (VPDB); compute its ratio and its on the VSMOW scale.
Exercise 4.3 ★
Compute the of CHUR ago and ago (, , today 0.512638).
Solution
Solution of Exercise 4.3.
At : , and . At : , and .
Exercise 4.4 ★
A snow sample from a mountain station has per mil. What does the meteoric water line predict? A lake water has and per mil: compute its deuterium excess , and say whether it lies above or below the line.
Solution
Solution of Exercise 4.4.
per mil. For the lake, per mil, below the line’s 10: the water lies below the meteoric water line, as evaporated surface waters do (the light isotopes left first).
Exercise 4.5 ★★
Evaluate of the linear-growth proposition. A granite has Sm and Nd (CI: 0.145 and ). Compute its , and the change of its over .
Solution
Solution of Exercise 4.5.
per year, or . The granite has , against for CI: . Over : units.
Exercise 4.6 ★★
A crust separated ago from a mantle with , with . Estimate its today with the linear-growth proposition. The exact calculation gives ; by how much does the approximation differ, and why is it too high or too low?
Solution
Solution of Exercise 4.6.
, against : the approximation is 0.4 unit too high (not negative enough). Most of the difference, about 0.3 unit, comes from : the parent, hence the deficit in growth relative to CHUR, was more abundant in the past than today (Exercise 4.10); the rest comes from rounding and the initial value.
Exercise 4.7 ★★
A basaltic magma (Sr , ) assimilates a granite (Sr , 0.7200). Compute of mixtures with 5, 10 and 20 per cent granite. Show that is a straight line against and give its slope and intercept.
Solution
Solution of Exercise 4.7.
With a mass fraction of granite, and . For : Sr , ; : 149.0, 0.70665; : 168.0, 0.70948. From the proof of the mixing proposition, is linear in Sr: , a straight line of slope (ppm) and intercept 0.7316 against . Check at : .
Exercise 4.8 ★★
With the liquid–vapour fractionation factors 1.0098 (O) and 1.084 (D) at , compute the and of a vapour in equilibrium with ocean water (0, 0), and the slope of the line from the water to the vapour. Repeat at (1.0117 and 1.111). Compare with the meteoric water line.
Solution
Solution of Exercise 4.8.
At : per mil, per mil, slope . At : and per mil, slope 8.64. Both are close to the slope 8 of the meteoric water line: the equilibrium fractionation of water between liquid and vapour alone sets the ratio of the deuterium and oxygen-18 shifts near 8.
Exercise 4.9 ★★
The continental crust is 0.51 per cent of the mass of the silicate Earth and holds, on average, Nd against for the silicate Earth. Take the crust’s as and the silicate Earth’s as 0. What share of the neodymium does the crust hold? If the rest of the mantle were uniform, what would its be? What share of the neodymium must a depleted reservoir at hold if the remainder of the mantle is chondritic?
Solution
Solution of Exercise 4.9.
The crust holds , 11 per cent of the neodymium. Mass balance: , so . With a depleted reservoir holding a share at and the rest at 0: , : about a fifth of the neodymium.
Exercise 4.10 ★★★
Show that in the linear-growth proposition the neglected terms are of relative size about . Over the age of the Earth, how large is this, and how large an error does it cause in for over ?
Solution
Solution of Exercise 4.10.
The growth rate is , with ; averaged over the interval from the separation to the present, the factor is , so the neglected terms are of relative size . Over the age of the Earth, , 1.5 per cent. For the crust of Exercise 4.6, , and the error is unit. The slow change of the CHUR ratio by which is divided adds another, smaller term, of order , here 0.02 unit.
Exercise 4.11 ★★★
Two components have Sr/Nd ratios of 13.3 (A) and 5.0 (B). Using the proof of the mixing hyperbola, find the share of strontium from A in a mixture where A supplies a share of the neodymium. For which value of do the two shares differ the most?
Solution
Solution of Exercise 4.11.
. With : . The difference is largest where , at , where : 0.24 apart.
Exercise 4.12 ★★★
A box model gives 2.3 to 2.6 times the present volume of continental crust, , generated since the Earth formed ago, and 1.3 to 1.6 times destroyed. Compute the mean rates of generation and destruction in per year. Compare them with the present rates at subduction zones, a year added and a year removed.
Solution
Solution of Exercise 4.12.
Generation: to to a year. Destruction: to to a year. The present rates differ: additions (2.7) are below the model’s mean generation, removal (3.2) above its mean destruction. In the model the crust grew early, when generation was fastest, and the present is a time of balance or slight loss, as the subduction-zone budget says.
4.8 Problem: Three islands, three mantles
Problem 4.1
Weekend problem — placing the lavas of three islands on the mantle array, separating a mixture from a third component, and dating the recycled sediment
Three volcanic islands of an imaginary ocean, Kora, Vel and Asha, erupt basalts with the isotope ratios below. A geochemist models their sources with two components: a depleted mantle like the source of MORB (Sr , Nd , , ) and an old sediment returned to the mantle by subduction (Sr , Nd , , ; , ). Kora: , ; Vel: , ; Asha: , (, ). CHUR today: , ; , .
Part I — Placing the islands.
- Compute of the two components.
- Compute of the three islands.
- Place the five compositions on a Sr– diagram. Which islands lie on the enriched side of CHUR?
- Asha has nearly the strontium ratio of the depleted mantle but a much lower . Where does it plot relative to the mantle array, and which island group of the chapter does it resemble?
- Why can the isotope ratios of the lavas be taken as those of their sources, although the lavas have very different Sm/Nd and Rb/Sr from their sources?
- A Kora lava with is old. By how much has its grown since eruption, in epsilon units? Does this matter?
Part II — Mixing the two components.
- Write the Nd concentration and the of a mixture with a mass fraction of sediment.
- Compute of mixtures with , 1, 2 and 5 per cent.
- Compute of the same mixtures.
- Show that the of the mixtures is a straight line against , and give its slope.
- Compute . Which ratio, Sr or Nd, moves towards the sediment faster as grows?
- By how many times is the sediment richer than the mantle in Nd, and in Sr? Explain with these numbers why one per cent of sediment shifts by about 11 units.
- What share of the neodymium of a mixture with per cent comes from the sediment?
Part III — How much sediment?
- Solve the Nd mixing equation for , given the ratio of the mixture.
- Compute for Kora from its neodymium.
- Compute for Kora from its strontium. Do the two agree?
- Compute for Vel from its neodymium and from its strontium.
- Compute for Asha from its neodymium, and the strontium ratio this predicts. Compare with the measured value: what do you conclude about Asha’s source?
- Suggest a third component for Asha, from the chapter, and the parent–daughter ratios it must have had.
Part IV — The age of the sediment.
- The sediment was subducted ago and has been closed since. Compute its , that of CHUR and its at that time.
- Redo the calculation with the linear-growth proposition.
- Compute the of the sediment ago.
- ago, the crust of the figure had . Is the sediment’s value at subduction consistent with an origin by erosion of such young continental crust?
- State the mass fraction of recycled sediment in the source of the most enriched island, the key number of this problem.
Solution
Solution of Problem 4.1.
1. Mantle: . Sediment: .
2. Kora , Vel , Asha .
3. With across and up: mantle (0.70282, ), Kora (0.70410, ), Vel (0.70618, ), sediment (0.72000, ), Asha (0.70290, ). Only Vel, with a negative , lies on the enriched side of CHUR.
4. Below the array: at the strontium ratio of the depleted mantle, the array would have near ; Asha has . It resembles the HIMU-type St. Helena group (Mangaia, Tubuai, St. Helena).
5. Melting changes the parent–daughter ratios but not, measurably, the isotope ratios of strontium and neodymium (proposition on melting); the lavas are young, so their ratios have not grown since eruption (question 6).
6. , or epsilon unit: far below the differences between the islands, and below the precision of a measurement.
7. , and .
8. per cent: Nd , ; 1 per cent: 1.1425, ; 2 per cent: 1.535, ; 5 per cent: 2.7125, .
9. Sr 10.95, 11.90, 13.80 and ; , 0.70571, 0.70780 and 0.71163.
10. and ; eliminating , , so : a straight line of slope (ppm) against . Check at per cent: .
11. . The mantle is relatively richer in strontium, the sediment in neodymium, so the Nd ratio moves towards the sediment faster: a little sediment shifts a long way before moves much.
12. 53 times richer in Nd (), 20 times in Sr. At per cent the sediment supplies per cent of the neodymium, which moves by units, but only per cent of the strontium.
13. : 35 per cent.
14. From : , and the same with 200 and 10 for strontium.
15. : 0.40 per cent.
16. : 0.40 per cent; the two agree.
17. Neodymium: ; strontium: . Both give 1.2 per cent.
18. , which predicts Sr and , against 0.70290 measured. Asha is not on the mantle–sediment mixing curve: its source holds another component.
19. Old recycled oceanic crust, the HIMU type: its Nd isotopes need a Sm/Nd somewhat below that of the depleted mantle, its Sr isotopes a low Rb/Sr, and its lead (not measured here) a high U/Pb, all over one to two billion years.
20. . Sediment: ; CHUR: ; .
21. ; since subduction changed by , so , within 0.2 unit of the exact value.
22. ; .
23. At subduction the sediment had , close to the of a crust only 0.7 billion years old at the time, and well above the strongly negative values of old crust: it fits the erosion of young crust, perhaps mixed with some mantle-derived material. Its of 0.7058 at that time is also that of a young crustal rock.
24. The source of Vel, the most enriched island, holds of recycled sediment.