High School Biology · Grades 10–12
5Biodiversity at Every Scale
Lay a one-metre square of string on a lawn and count what grows inside it: grass, of course, but also clover, daisies, a dandelion, plantain, moss, and, if you look with a lens, a dozen insects and a snail. Move the square onto the tarmac of the car park: nothing, or one weed in a crack. Move it into an old meadow that has never been ploughed: forty plant species, and the insects beyond counting. The word for what the square measures is biodiversity, and this chapter is about how to measure it, at what scales it exists, and why it is neither fixed nor guaranteed.
5.1 Three scales of diversity
Definition 5.1 (Biodiversity)
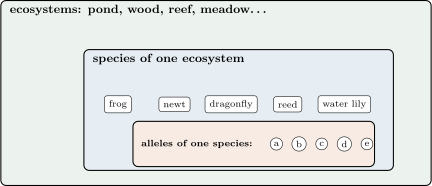
Biodiversity is the diversity of living things, considered at three scales:
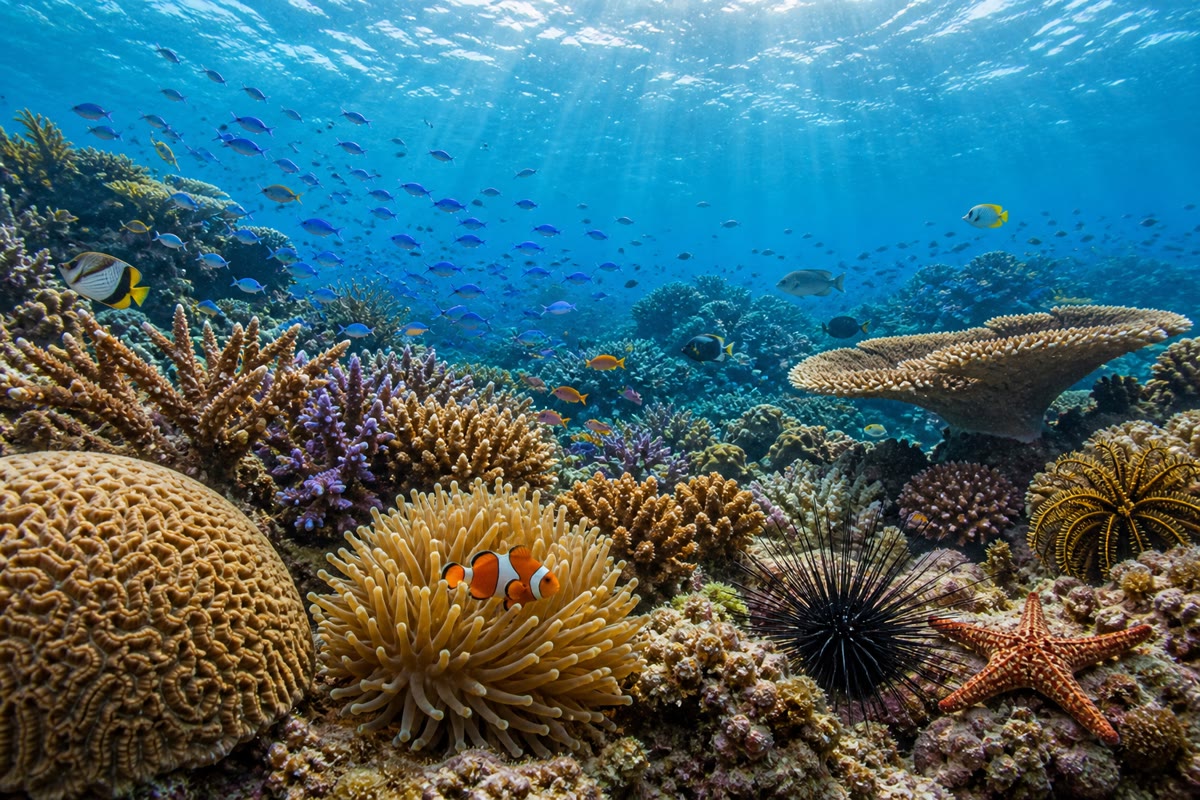
- the diversity of ecosystems — of the living communities and the environments they occupy (a pond, a beech wood, a coral reef, a meadow), each with its own set of species;
- the diversity of species within an ecosystem or on Earth — the number of species and their relative abundance;
- the genetic diversity within a species — the number of alleles of its genes and the way they are shared out among its individuals and populations.
Definition 5.2 (Species)
A species is a group of living things that resemble one another, can breed together, and produce fertile offspring; two populations that cannot interbreed, or whose hybrids are sterile, are distinct species. In practice — for fossils, for bacteria, for organisms never seen breeding — species are recognised by their shared characteristics, and Chapter 25 will show that the boundary is not always sharp.
Example 5.3 (Horse, donkey, mule)
A horse and a donkey resemble each other and can breed: their offspring is the mule. But the mule is sterile, so horse and donkey are two species. A poodle and a wolfhound look nothing alike, breed readily, and give fertile puppies: one species, the dog — which can also breed with the wolf, its ancestor.
5.2 The diversity of species
Proposition 5.4 (Counting species)
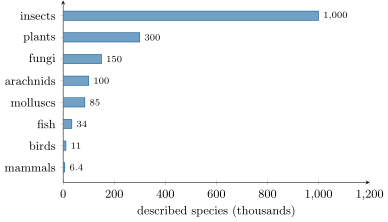
About two million species have been described and named. Most are insects (over a million), followed by plants (some 300 000), fungi, arachnids, molluscs; the vertebrates, the group we know best, number about 70 000, of which 6 400 are mammals. The number of species still undescribed is estimated, from the rate at which new ones are found, at several million more — perhaps eight to ten million eukaryotic species in all, plus a vast, largely uncounted diversity of bacteria.
Proof. Admitted at this level. ∎
Method 5.5 (Measuring the diversity of a site)
A site is never counted whole; it is sampled.
- Choose a sampling unit adapted to the organisms: a quadrat of for meadow plants, a net sweep for insects, a sieve of soil for earthworms, a length of transect for birds.
- Place units at random or at regular intervals, enough of them that adding one more changes the total little.
- In each, identify and count. Two numbers describe the sample: the species richness, the number of species found, and the relative abundance of each — a site where one species makes 95% of individuals is less diverse than one where ten species share them evenly, even at equal richness.
- Compare sites only with the same method and the same effort, at the same season.
Example 5.6 (Two lawns)
Ten quadrats on a mown school lawn: 6 plant species, of which grass covers 90%. Ten quadrats on an unmown verge beside it: 23 species, none above 30%. The verge is richer and more even; the difference is not the soil or the climate, which are the same, but the mowing, which removes every plant that cannot flower close to the ground.
5.3 Genetic diversity within a species
Proposition 5.7 (Individuals of a species are not identical)
Within a species, most genes exist in several alleles, and the individuals carry different combinations of them. The frequency of an allele in a population — the fraction of all copies of the gene that are this allele — varies from one population to another. Genetic diversity is what allows a species to respond to a changing environment: a population in which every individual is alike has nothing to select from.
Proof. Admitted at this level. ∎
Example 5.8 (Blood-group alleles around the world)
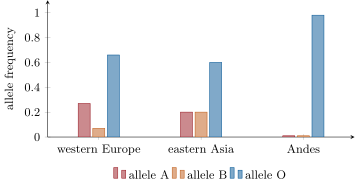
The gene of the ABO blood groups has three common alleles, A, B and O. In western Europe their frequencies are about 0.27, 0.07 and 0.66; in eastern Asia about 0.20, 0.20 and 0.60; in some native populations of South America the O allele alone reaches 0.98. Same species, same gene, different distributions of its alleles: the genetic diversity of humans is real, and it is spread across populations rather than splitting them — most of the diversity of the species is found within any one population.
Example 5.9 (A species with almost none)
Cheetahs are so alike genetically that skin grafts between unrelated animals are accepted as if between twins: the species passed through a bottleneck of very few individuals some ten thousand years ago and has never recovered its alleles. Whatever new disease or climate comes, every cheetah meets it with the same equipment; the species survives, but with nothing in reserve.
5.4 Biodiversity changes: past, present
Proposition 5.10 (Biodiversity is a state, not a constant)
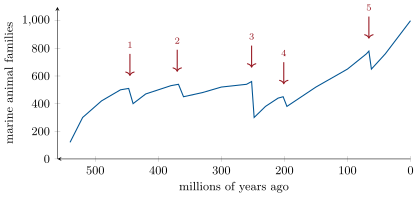
The set of species alive at a given time is a stage in a history. The fossil record shows species appearing, persisting for a few million years on average, and disappearing; the total diversity of life has increased over the last 540 million years, interrupted by five mass extinctions in which more than three quarters of species vanished within a geologically short time. The most recent, 66 million years ago, ended the non-bird dinosaurs and opened the way to the diversification of mammals.
Evidence. Counts of fossil families in dated rock layers, compiled for the whole marine record, give the curve of the next figure: a rise from a few hundred to nearly a thousand families, with sharp falls at 445, 370, 252, 201 and 66 million years ago. The 252-million-year event, the largest, removed about 95% of marine species; the layers just above it are almost empty of fossils, and new groups fill them only over the following millions of years. ∎
Proposition 5.11 (The present change)
Species are currently disappearing at a rate estimated at a hundred to a thousand times the average of the fossil record, from the destruction of ecosystems (forest clearance, drainage of wetlands, urbanisation), from overexploitation, from introduced species, from pollution and from climate change — all of human origin. Half the tropical forests of 1950 are gone; a third of amphibian species are threatened; the genetic diversity of crops and livestock has narrowed to a few varieties. Biodiversity is a resource — food, medicines, pollination, soil, the stability of ecosystems — and its loss is not reversible on a human time scale.
Proof. Admitted at this level. ∎
Example 5.12 (Reversing a loss)
Where hedgerows removed in the 1960s have been replanted, bird and insect richness returns within a decade; where wolves were reintroduced into a national park in 1995, the deer they hunt stopped stripping the riverside willows, the willows regrew, beavers returned, and the birds and fish that depend on beaver ponds with them. Protecting or restoring an ecosystem restores diversity at all three scales at once; a species kept alive in a zoo keeps only one of them.
5.5 Exercises
Exercise 5.1 ★
Name the three scales of biodiversity and give one example of each.
Solution
Solution of Exercise 5.1.
Ecosystems (a pond, a beech wood); species (the frogs, newts and reeds of the pond); genes (the alleles of the ABO gene in a human population).
Exercise 5.2 ★
Define a species. Are the lion and the tiger — which can produce sterile hybrids in captivity — one species or two?
Solution
Solution of Exercise 5.2.
A group of similar organisms that breed together and give fertile offspring. Lion and tiger give sterile hybrids, so they are two species.
Exercise 5.3 ★
From the species chart, how many times more insect species than mammal species have been described?
Solution
Solution of Exercise 5.3.
: about 150 times more.
Exercise 5.4 ★
What is an allele frequency? In a population where the O allele has frequency 0.66 and the A allele 0.27, what is the frequency of B?
Exercise 5.5 ★
How many mass extinctions does the fossil record show, and which was the largest?
Solution
Solution of Exercise 5.5.
Five; the largest was the end-Permian extinction, 252 million years ago, which removed about 95% of marine species.
Exercise 5.6 ★★
Two meadows each have 12 plant species. In the first, one species makes 80% of the plants; in the second, no species exceeds 15%. Which is more diverse, and which of the two numbers of Method 5.5 tells them apart?
Solution
Solution of Exercise 5.6.
The second: equal richness, but a far more even relative abundance. Richness alone does not distinguish them; the relative abundances do.
Exercise 5.7 ★★
A student counts insects in 3 net sweeps and finds 8 species; a classmate makes 30 sweeps in the same field and finds 21. Does the field have more species for the classmate? Explain what the difference shows about sampling.
Solution
Solution of Exercise 5.7.
The field is the same; the classmate sampled ten times more. Species found increase with effort until the curve flattens, so counts made with different effort are not comparable — the student’s 8 is an undersample, not a poorer field.
Exercise 5.8 ★★
Explain why a species reduced to a few dozen individuals may remain in danger even after its numbers have grown back into the thousands.
Solution
Solution of Exercise 5.8.
The few survivors carried only a fraction of the species’ alleles; their descendants, however numerous, share that reduced set. Genetic diversity is lost in the bottleneck and is not restored by numbers: the species has nothing in reserve against a new disease or a changed climate (the cheetah’s case).
Exercise 5.9 ★★
In the fossil-families figure, read the number of families just before and just after the extinction of 252 million years ago, and compute the fraction lost. Why is the fraction of species lost larger than the fraction of families?
Solution
Solution of Exercise 5.9.
About 560 families before, 300 after: of families lost. A family disappears only when all its species do, so many families survived through one or two species while losing the rest; the fraction of species lost (about 95%) is far larger than the fraction of families.
Exercise 5.10 ★★
Using Example 5.8, explain in what sense two neighbours in one town are likely to differ genetically about as much as two people from different continents.
Solution
Solution of Exercise 5.10.
Every population carries all three alleles, and its members differ among themselves in which they carry; the differences between populations are only shifts in frequency. Most of the species’ genetic diversity therefore exists inside each population: two neighbours typically differ at as many positions as two people from far apart.
Exercise 5.11 ★★
A pond is drained to build a car park. List one loss at each of the three scales of biodiversity.
Exercise 5.12 ★★★
The average species of the fossil record lasts a few million years; with two million known species, estimate the "background" number of extinctions per year. If the present rate is a thousand times higher, how many species would disappear per year, and how many per century?
Exercise 5.13 ★★★
After the extinction of 66 million years ago, mammals diversified from a few small forms into whales, bats, elephants and primates within some 20 million years. Explain how a catastrophe for biodiversity can also be a cause of new biodiversity.
Solution
Solution of Exercise 5.13.
The extinction emptied ways of life — large herbivores, large predators, fliers, swimmers — that the dinosaurs had occupied. Surviving mammal lineages, freed of those competitors and with their own genetic diversity to draw on, adapted to the vacant roles and split into new species: the loss opened the opportunities that the new diversity filled.
Exercise 5.14 ★★★
Modern wheat descends from a handful of varieties; its wild relatives grow in the mountains of the Middle East. Explain, with the notion of genetic diversity, why seed banks conserve the wild relatives even though they yield nothing usable.
Solution
Solution of Exercise 5.14.
Cultivated wheat has lost most of the alleles of its ancestors. The wild relatives keep them: alleles for resistance to a disease, to drought, to salt, that no current variety carries. Crossing them into wheat restores the option; once a wild relative is extinct, its alleles are gone for good.
Exercise 5.15 ★★★
"Extinction is natural, so there is no reason to worry about the present one." Discuss in a paragraph using the rate of extinction, the time of recovery, and the resources biodiversity provides.
Solution
Solution of Exercise 5.15.
Extinction is natural, but at about one species per year; the present rate is hundreds to a thousand times faster, comparable to a mass extinction, and recovery from those took millions of years — longer than our species has existed. Meanwhile the ecosystems being lost supply food, pollination, soil, water purification and the genetic reserves of our crops. The precedent shows the loss is real and the recovery not available on any human time scale.
5.6 Problem: The Hedgerow’s Dividend
Problem 5.1
Weekend problem — a field survey of two farms, one with hedgerows and one without: species counted, abundances compared, a snail’s alleles followed, and the number a hedge is worth
Two neighbouring farms grow the same wheat on the same soil. Farm A kept its hedgerows; Farm B removed them in 1970. A class samples both in June with the same method: 20 quadrats of along the field edges for plants, 20 net sweeps for insects, and 10 minutes of listening at 5 points for birds.
Part I — Plants. Results, Farm A: 31 plant species in the 20 quadrats; Farm B: 9. On Farm B, one grass makes 84% of the plants counted; on Farm A the commonest species makes 22%.
- Give the species richness of each farm’s edges and the ratio between them.
- Which farm’s plant community is more even? Explain what "even" adds to "rich".
- On Farm A, the number of species found after 5, 10, 15 and 20 quadrats was 18, 25, 29 and 31. Is the sampling sufficient? Justify.
- The same series on Farm B was 6, 8, 9, 9. Compare the two series and say what shape a "complete" sampling curve takes.
- Why must both farms be sampled in the same month?
Part II — Insects and birds. Insects: Farm A 46 species, Farm B 14. Birds: Farm A 17 species, Farm B 5; on Farm B, 60% of birds heard were of a single species.
- Compute the ratio of insect richness and of bird richness between the farms. Do the three groups (plants, insects, birds) tell the same story?
- Propose a chain of causes linking the removal of hedges to the fall in insect diversity, then to bird diversity.
- The wheat yield per hectare is the same on both farms. Does this mean the hedges have no effect on the crop? Suggest one service a hedge may render that the yield figure does not show.
- Name one species the class would expect to find only on Farm A and explain why.
- Which scale of biodiversity has been most obviously reduced on Farm B: ecosystems, species, or genes? Justify.
Part III — A snail’s alleles. The grove snail carries a gene with two common alleles for shell colour, yellow (y) and brown (b). In Farm A’s hedges, 400 snails were sampled: 100 have two y alleles, 200 have one y and one b, 100 have two b. In Farm B’s one remaining bank, 100 snails: 4 with two y, 32 with one of each, 64 with two b.
- Count the copies of y and of b in each sample (each snail carries two copies). Deduce the frequency of y on each farm.
- Which population is more genetically diverse at this gene? Compare the proportion of snails carrying both alleles.
- Thrushes hunt snails by sight; on the bare bank of Farm B, brown shells are better hidden. Propose how the frequencies of Farm B came about.
- If a wet, shaded hedge favoured yellow shells, what would you predict for Farm B’s snails if hedges were replanted and nothing else changed?
- Farm B’s snails number a few hundred; Farm A’s tens of thousands. Which population is more exposed to losing an allele altogether by chance? Why?
Part IV — The dividend.
- Across the three groups, compute the total species richness of each farm, then Farm A’s total divided by Farm B’s.
- Farm A’s hedges occupy 3% of its area. State in one sentence what fraction of the land is holding what fraction of the species.
- Hedges replanted on Farm B in 1995 were resurveyed in 2010: plants 24, insects 35, birds 12 species. What fraction of Farm A’s richness had each group recovered?
- Which of the three scales of biodiversity recovers slowest after replanting, and why?
- State the result: the factor by which hedgerows multiplied the species richness of a farm, and the one scale of biodiversity that a replanted hedge cannot bring back by itself.
Solution
Solution of Problem 5.1.
1. 31 and 9 species: ratio .
2. Farm A: no species above 22% against one at 84% on Farm B. Evenness says how the individuals are shared among the species found; a rich but uneven community is dominated by one species and the rest are rare.
3. The gains shrink (7, 4, 2): the curve is flattening, so the sample is close to complete; a few more quadrats would add at most one or two species.
4. Farm B’s curve reached 9 by the 15th quadrat and added nothing after: a complete sampling curve flattens to a plateau, which Farm B reached and Farm A nearly did.
5. Many plants are visible or identifiable only in flower, and insects and birds vary with the season; a different month would change the counts for reasons unrelated to the hedges.
6. Insects ; birds . All three groups give a factor of about 3: the same story.
7. Hedges supply the plants (leaves, flowers, dead wood, shelter) that insects feed on and breed in; fewer plant species mean fewer insect species; insects and the hedge’s berries and nest sites feed and house the birds, so bird diversity falls in turn.
8. No: yield measures the crop only. A hedge may shelter the field from wind, hold the soil, house the pollinators and the predators of crop pests, and its effects appear in bad years or over decades, not in one season’s figure.
9. A hedgerow nester such as a blackbird or a hedge sparrow (or a hedge snail, a hawthorn shield bug): it needs the shrubs for nesting, food or shelter that Farm B no longer offers.
10. Ecosystems: the hedge itself, a habitat, was removed, and the species and genes went with it; the losses at the other scales are consequences.
11. Farm A: y copies , b copies , out of 800: y frequency 0.5. Farm B: y , b , out of 200: y frequency 0.2.
12. Farm A: both alleles equally frequent and 50% of snails carry both; Farm B: 32% carry both and b dominates. Farm A is more diverse.
13. On the bare bank the yellow snails are eaten more often; generation after generation, fewer y copies were passed on, and the frequency of y fell from around 0.5 to 0.2.
14. The advantage would reverse: yellow snails would survive better in the shaded hedge and the frequency of y would rise again over the generations — provided the allele is still present.
15. Farm B’s: in a population of a few hundred, a bad year or a few chance deaths can remove every copy of the rarer allele; among tens of thousands the allele is carried by thousands of snails and chance cannot erase it.
16. Farm A: ; Farm B: ; ratio .
17. Three per cent of the land holds the habitat of about two thirds of the farm’s species.
18. Plants ; insects ; birds .
19. Genetic diversity: the species return from neighbouring populations, but the alleles lost from the local populations (Farm B’s snails, for instance) come back only if immigrants happen to carry them; a lost allele is not recreated by replanting.
20. Hedgerows multiplied the farm’s species richness by about 3.4 in every group counted; a replanted hedge brings back the ecosystem and, in time, most species, but not by itself the alleles that local populations lost.