书籍暂未推出简体中文版——当前显示英文版。
Primary & Middle School Earth and Space Sciences · 1–9 年级
28The Earth’s Climate, Past and Present
If the Earth had no air around it, but reflected the same share of sunlight as it does today, its surface would settle at an average temperature of about : frozen seas, frozen land, everywhere. Its real average is about . The difference, some , comes from a few gases in the air, present in tiny amounts, that keep part of the Earth’s heat from escaping to space. This chapter is about these gases, about the Earth’s climate in the past, and about how and why it is changing now.
You already know
The climate of a place is the weather it usually has, averaged over 30 years (Chapter 11). The lowest layer of the atmosphere, where the weather happens, is the troposphere (Chapter 23). Ice ages, with ice sheets far beyond the poles, have come and gone; the Arctic sea ice has shrunk since 1979 (Chapter 27). In chemistry, you learn that carbon dioxide, methane and water vapour are greenhouse gases: they let sunlight through but absorb the invisible infrared light given off by the warm ground, which is the greenhouse effect; burning coal, oil and gas releases carbon dioxide.
28.1 The greenhouse effect and the Earth’s temperature
Sunlight crosses the atmosphere and warms the ground and the oceans. Like every warm body, the warm surface gives off energy in turn, as infrared light that the eye cannot see. If all of it escaped to space, the Earth would be the frozen world of the first paragraph. But the greenhouse gases of the air absorb much of this infrared light and send part of it back down: the surface receives energy both from the Sun and from the air above it, and settles at a higher temperature.
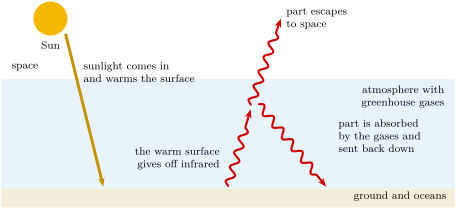
The greenhouse effect is natural and necessary: without it there would be no liquid water at the surface. The question of this chapter is a different one: what happens to the Earth’s temperature when the amount of greenhouse gas in the air changes?
28.2 Climates of the past
To read the climate of the distant past, scientists drill into the ice sheets. Every year, snow falls on Antarctica and Greenland, and the summer snow is a little different from the winter snow. Buried and pressed into ice, the yearly layers remain, one above the other, like the pages of a book. The deeper the ice, the older it is.
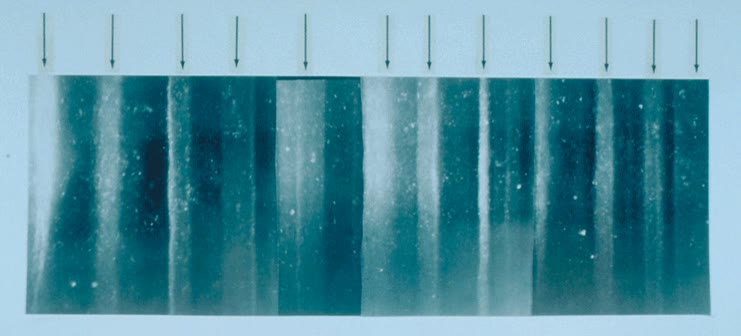
An ice core keeps two records of the past. The snow itself tells how cold the air was when it fell: the colder the air, the smaller the share of the heavier forms of hydrogen and oxygen in the snow. And as snow is pressed into ice, the spaces between the grains close up, trapping tiny bubbles of the air of the time. Scientists release this ancient air in the laboratory and measure its carbon dioxide.
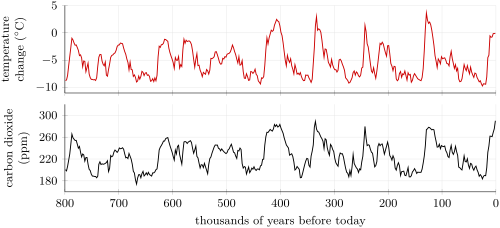
The two curves tell the same story. Again and again, long cold times, the ice ages, gave way to shorter warm times, then the cold came back. At the coldest, the air over Antarctica was about colder than in the last thousand years; in the warmest times it was a few degrees warmer. And the carbon dioxide rose and fell with the temperature, between about in the cold times and about in the warm ones. We live in one of the warm times, which began as the last ice age ended.
Method 28.1 (Reading two records side by side)
- Check that the two records share the same time axis, and which way time runs.
- Pick a date on the time axis and read each record at that date.
- Look for peaks and troughs: do they come at the same times in both records?
- Say what moves together, without deciding yet which change caused the other.
Example 28.2 (The last ice age in the ice core)
At years before today (the 20 on the time axis), the temperature curve is at about and the carbon dioxide at about . In the last thousand years, the temperature curve is close to 0 and the carbon dioxide close to . So, at the coldest of the last ice age, the air over Antarctica was about colder, and it held about less carbon dioxide, a third less.
Further back still, the Earth knew climates much warmer than any of the last 800 000 years. The scientific assessments estimate that the last time the Earth’s surface stayed or more above its level of the late 19th century was over three million years ago.
28.3 The records of today
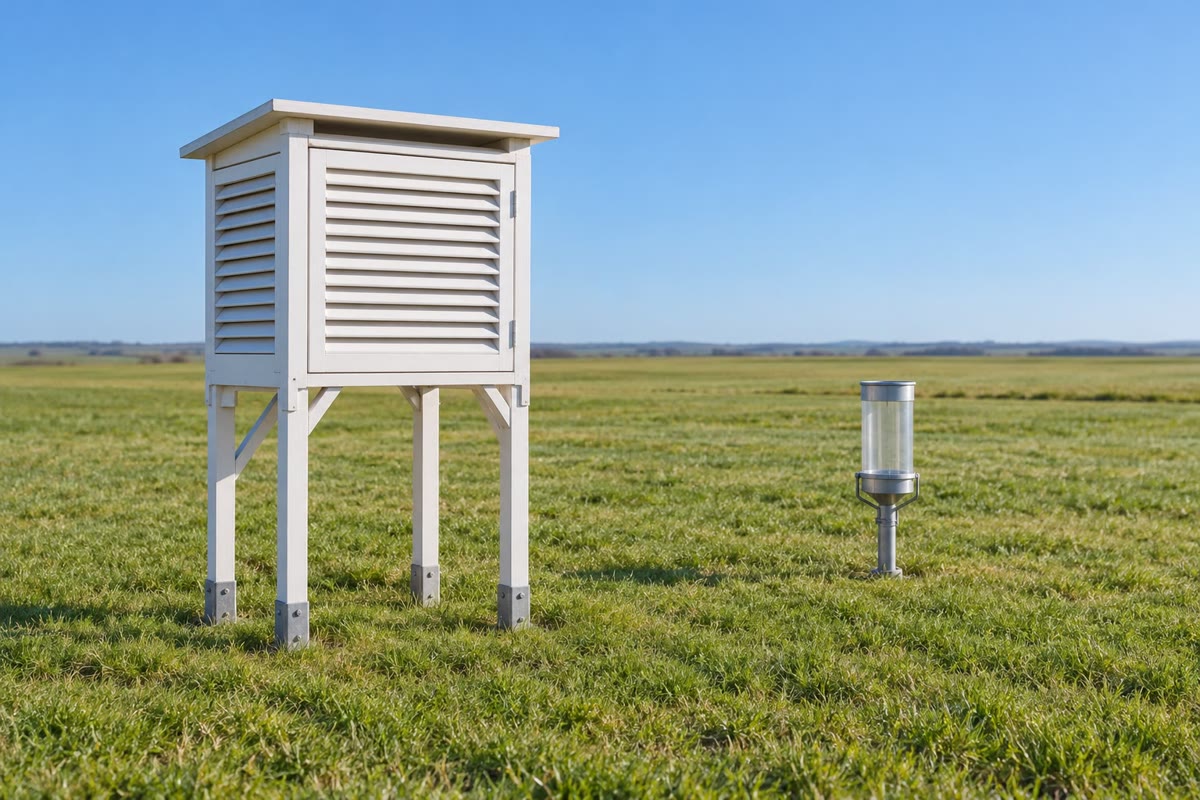
Since the late 19th century, the temperature has been measured every day at thousands of weather stations on land and at sea, with thermometers kept in the shade. To follow the whole planet, scientists do not average the temperatures themselves, which depend on where each station is, but how much each one differs from its own usual value.
Definition 28.3 (Temperature anomaly)
A temperature anomaly is the difference between a temperature and its average over a chosen reference period. It is positive when it is warmer than that average, negative when it is colder.
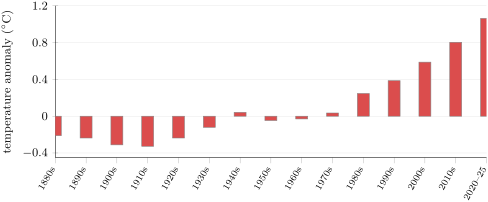
The NASA record of the global temperature, for instance, gives each year’s anomaly compared with the average of 1951–1980, from land stations and from measurements of the sea surface. Averaged decade by decade, it shows a clear rise.
Definition 28.4 (Global warming)
Global warming is the rise of the average temperature of the Earth’s surface, as a whole, since the second half of the 19th century.
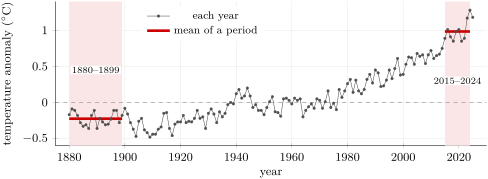
Year by year, the record goes up and down: one year can be cooler than the one before, because the weather of a whole year, over oceans and continents, varies too. To measure a warming, scientists therefore compare averages over many years, never two single years.
Method 28.5 (Measuring a warming between two periods)
- Choose two periods of at least ten years each, one early and one late, so that the ups and downs of single years cancel out.
- Average the yearly anomalies of each period.
- Subtract the early mean from the late one: the result is the warming between the two periods, in degrees.
- Say which record and which periods you used: another record, or other periods, give a slightly different number.
Example 28.6 (The warming since the 1970s)
In the NASA record, the anomalies of the ten years 1970–1979 average , and those of 2010–2019 average . The warming between these two decades is , in forty years: about per decade. Single years, also forty years apart, would give very different answers: 1976 () against 2016 (1.01) gives , but 1979 (0.16) against 2011 (0.61) gives only .
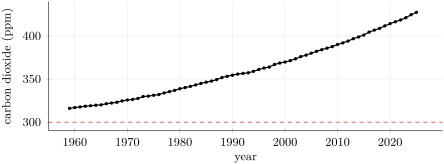
The carbon dioxide of the air has been measured directly since March 1958, at an observatory about up the slopes of the Mauna Loa volcano, in Hawaii. In 1959, its yearly average was ; by 2025, it had reached , far above the that it never exceeded in 800 000 years of ice. It rises faster and faster: by less than a year in the 1960s, by more than a year in the last ten years.
Figures as of 2025
The yearly average carbon dioxide at Mauna Loa was in 2025. In the NASA record, the warmest year since 1880 was 2024, with an anomaly of compared with 1951–1980.
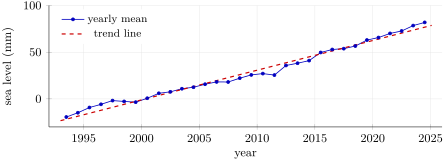
The sea is rising too. Since 1993, satellites have measured the height of the sea surface all over the globe: the trend line of their record rises by about a year, about in thirty years. Two things raise the sea: water that warms expands, and melting ice on land adds water to the ocean. And the ice is shrinking: mountain glaciers almost everywhere are retreating, and the Arctic’s summer sea ice has lost almost half of its extent since 1979 (Chapter 27).
28.4 Climate change and its causes
Definition 28.7 (Climate change)
Climate change is a change in the climate of the Earth, or of a region, that lasts for decades or longer: a change of its average temperature, rain, winds or ice, not just one unusual season.
The climate has always changed, as the ice cores show. What is new is the speed of today’s change, and its cause. Scientists from all over the world regularly assess what has been published on the climate, in the reports of the Intergovernmental Panel on Climate Change (IPCC). The reports weigh how sure each statement is, with words chosen with care.
In these reports, each of the words below has a fixed meaning: the chances in 100 that the statement is true.
| virtually certain | 99 to 100 | likely | 66 to 100 |
| extremely likely | 95 to 100 | about as likely as not | 33 to 66 |
| very likely | 90 to 100 | unlikely | 0 to 33 |
A few statements carry none of these words: they are given as facts, such as “it is unequivocal”. When you read a news story about the climate, look for these words, and notice which ones the story keeps and which it drops.
The assessment published in 2021 states the following.
- It is unequivocal that human influence has warmed the atmosphere, the ocean and the land.
- The global surface temperature of 2011–2020 was about higher than in 1850–1900, and each of the last four decades was warmer than any decade before it since 1850.
- The likely human-caused warming from 1850–1900 to 2010–2019 is 0.8 to , with a best estimate of : about the whole of the observed warming. Natural causes together changed the temperature by only to .
- The carbon dioxide of the air in 2019 was higher than at any time in at least two million years (high confidence); it had risen by 47 % since 1750.
- Human influence is very likely the main cause of the retreat of glaciers since the 1990s and of the shrinking of the Arctic sea ice; and very likely the main cause of the rise of the sea since at least 1971.
History — Charles David Keeling’s curve
In March 1958, a young chemist of the Scripps Institution of Oceanography, Charles David Keeling, began measuring the carbon dioxide of the air on Mauna Loa, high above the sea and far from any town. His measurements have gone on ever since: they are the longest record of carbon dioxide measured directly in the air, and the curve they draw, rising year after year, carries his name, the Keeling curve.
Why does the warming follow the carbon dioxide? Burning coal, oil and gas releases carbon dioxide; more carbon dioxide in the air means that more of the infrared light given off by the surface is absorbed and sent back down, and the surface warms. Water vapour, methane and the other greenhouse gases add to the effect. The past and the present agree: in the ice cores as in today’s records, the Earth’s temperature and its carbon dioxide rise and fall together.
28.5 Exercises
Exercise 28.1 ★
(a) What would the average temperature of the Earth’s surface be without the greenhouse effect? (b) What is it with it? (c) By how many degrees does the greenhouse effect warm the surface? (d) Name two greenhouse gases.
Solution
Solution of Exercise 28.1.
(a) About . (b) About . (c) : about . (d) Two of: carbon dioxide, water vapour, methane.
Exercise 28.2 ★
Weather or climate? (a) It rained all day yesterday. (b) Summers in this region are hot and dry. (c) The 2010s were warmer than the 1980s worldwide. (d) Next week will be cold.
Solution
Solution of Exercise 28.2.
(a) Weather. (b) Climate. (c) Climate (and climate change: a change over decades). (d) Weather.
Exercise 28.3 ★
Look at the photograph of the ice core section. (a) How long is the section, and how many years of snow does it hold? (b) Find the average thickness of one year’s layer, in centimetres. (c) Why is the deepest ice of an ice sheet the oldest?
Exercise 28.4 ★
A town’s average July temperature over 1991–2020 is . Give the temperature anomaly of a July averaging (a) ; (b) ; (c) . (d) What does a negative anomaly mean?
Solution
Solution of Exercise 28.4.
(a) . (b) . (c) . (d) That month was colder than its 1991–2020 average.
Exercise 28.5 ★★
Use the bar chart of the decades. (a) Which decades were colder than the 1951–1980 average? (b) Read the anomaly of the 1980s and of the 2010s. (c) By how much did the anomaly grow between these two decades? (d) Is the rise steady from one decade to the next over the whole record?
Solution
Solution of Exercise 28.5.
(a) The 1880s to the 1930s, the 1950s and the 1960s. (b) About and . (c) . (d) No: the decades from the 1880s to the 1910s got a little colder, and the 1950s were a little colder than the 1940s; but since the 1970s each decade has been warmer than the one before.
Exercise 28.6 ★★
At Mauna Loa, the yearly average carbon dioxide was in 1959, in 1969, in 2015 and in 2025. (a) What was the average rise per year from 1959 to 1969? (b) From 2015 to 2025? (c) How many times faster was the rise in the second period? (d) By how many percent did the carbon dioxide grow from 1959 to 2025?
Solution
Solution of Exercise 28.6.
(a) a year. (b) a year. (c) : about three times faster. (d) .
Exercise 28.7 ★★
Use the 800 000-year record. (a) Write 800 000 years in scientific notation. (b) About how long ago was the last time it was as warm as today, before our own warm time? (c) What carbon dioxide level did the air hold at that time? (d) Do the temperature and the carbon dioxide rise and fall at the same times?
Solution
Solution of Exercise 28.7.
(a) years. (b) About to years ago: the temperature curve rises above 0 there. (c) About . (d) Yes: the peaks and troughs of the two curves come at the same times.
Exercise 28.8 ★★
The sea rises by about a year. (a) How much is that in 10 years, in centimetres? (b) If it kept this rate, how much would it rise between 2025 and 2100? (c) Name two reasons why the sea rises. (d) Does the melting of the Arctic sea ice raise the sea? Explain.
Exercise 28.9 ★★
In the IPCC words, how many chances in 100, at least, does each statement have of being true? (a) “It is very likely…” (b) “It is likely…” (c) “It is virtually certain…” (d) A newspaper writes “scientists are sure that” about a statement the report calls likely. What is wrong?
Solution
Solution of Exercise 28.9.
(a) 90. (b) 66. (c) 99. (d) Likely means at least 66 chances in 100, not certainty: the newspaper makes the statement sound surer than the scientists said.
Exercise 28.10 ★★
A friend says: “This winter was the coldest in ten years where I live, so the Earth is not warming.” Explain, using the words weather, climate and global, why this argument does not hold.
Solution
Solution of Exercise 28.10.
One cold winter in one place is weather: it says what happened during a few months at one spot. Global warming is a change of climate, measured over decades, and global: it is the average over the whole Earth. A cold winter here can happen while the Earth as a whole is warmer than before, and the decade averages keep rising.
Exercise 28.11 ★★★
At the coldest of the last ice age, about years ago, the air held about of carbon dioxide; just before the industrial era, about ; in 2025, about . (a) How much did the carbon dioxide rise from the ice age to the industrial era, and in how many years? (b) How much did it rise from the industrial era to 2025? Take 1750 as the start of the industrial era. (c) Compare the two rises: in size, and in average rate per year, using scientific notation. (d) What does the IPCC say about the carbon dioxide level of today compared with the past?
Solution
Solution of Exercise 28.11.
(a) , in about years. (b) , in years. (c) The second rise is larger (147 against 90 ppm). Rates: ppm a year, against ppm a year: about 120 times faster. (d) That in 2019 it was higher than at any time in at least two million years (high confidence).
Exercise 28.12 ★★★
The IPCC assessment gives the observed warming from 1850–1900 to 2010–2019 as about , and the human-caused warming as likely 0.8 to (best estimate ); the natural causes together are given as to . (a) Compare the best estimate of the human-caused warming with the observed warming. (b) Could natural causes alone explain the observed warming? Explain. (c) What does likely mean in this sentence?
Solution
Solution of Exercise 28.12.
(a) They are almost equal: 1.07 against . The best estimate says that human influence explains about the whole of the observed warming. (b) No: the natural causes together changed the temperature by at most, ten times less than the observed warming. (c) At least 66 chances in 100 that the human-caused warming lies between 0.8 and .
28.6 Problem: The planet’s thermometer
Problem 28.1
Weekend problem — the warming of the Earth is worked out from the NASA temperature record, then set beside the carbon dioxide and the sea
The table gives the global temperature anomaly of the NASA record (compared with the 1951–1980 average) for some groups of years, and other records of the chapter.
| mean anomaly, 1880–1899 | |
| mean anomaly, 1951–1980 | |
| mean anomaly, 2015–2024 | |
| carbon dioxide at Mauna Loa, 1959 / 2025 | / |
| sea level trend from satellites, since 1993 | per year |
Part I — The decades.
- Why is the anomaly of 1951–1980 exactly zero?
- Was 1880–1899 warmer or colder than 1951–1980? By how much?
- Was 2015–2024 warmer or colder than 1951–1980? By how much?
- Compute the warming of 2015–2024 compared with 1880–1899.
Part II — The carbon dioxide.
- By how many ppm did the carbon dioxide rise between 1959 and 2025?
- By what percentage of its 1959 value?
- In the ice cores, the carbon dioxide never went above about in 800 000 years. By how much does the 2025 value exceed it?
- Explain in two sentences how more carbon dioxide in the air warms the surface.
Part III — The sea.
- How much has the sea risen from 1993 to 2025 at the rate of the table, in centimetres?
- Name the two causes of this rise.
- The IPCC gives the warming of 2011–2020 compared with 1850–1900 as about . Is your answer to question 4 of the same size? Give one reason why the two numbers differ a little.
- Write the sentence a science journalist could print: “Since the end of the 19th century, the Earth’s surface has warmed by about …”
Solution
Solution of Problem 28.1.
1. Because it is the reference period: the anomalies are measured from its own average.
2. Colder, by .
3. Warmer, by .
4. .
5. .
6. .
7. .
8. Carbon dioxide absorbs part of the infrared light given off by the warm surface and sends part of it back down. With more of it in the air, more energy comes back to the surface, which warms.
9. years; , about .
10. The warming sea water expands; ice on land (glaciers, ice sheets) melts into the sea.
11. Yes, the same size: about against . They differ a little because the periods are not the same (1880–1899 instead of 1850–1900; 2015–2024 instead of 2011–2020: the more recent years were warmer), and because the IPCC combines several records, not only the NASA one.
12. “Since the end of the 19th century, the Earth’s surface has warmed by about .”