书籍暂未推出简体中文版——当前显示英文版。
Primary & Middle School Earth and Space Sciences · 1–9 年级
25Air Masses, Fronts and Weather Maps
The morning is bright and still. Around noon, thin white streaks appear very high in the sky, and slowly spread into a pale veil that dims the Sun. In the afternoon the clouds thicken and come lower; by evening a steady rain is falling. During the night it turns warm and damp, then a dark line of cloud brings a short burst of heavy rain and a gust of wind. The next morning is clear, fresh and windy. In two days a depression has passed over the town, with its two fronts.

Weather forecasters saw it coming days before. This chapter shows how: the air of our skies comes in large masses, the masses meet along fronts, and maps of the pressure show where they are going.
You already know
Air presses on everything it touches; a barometer measures this pressure in hectopascals (the physics books), and at sea level it is about (Chapter 23). Clouds form when damp air rises and cools (Chapter 7). At the ground, the wind blows from high pressure towards low pressure, and the Earth’s rotation turns it aside: to the right in the northern hemisphere. Between about and , the westerlies bring one storm after another (Chapter 24).
25.1 Air masses
Air that stays for days over the same place takes on the character of the surface beneath it. Over a warm ocean it becomes warm and damp; over a frozen land, cold and dry. When it moves away, it carries this character with it, sometimes for thousands of kilometres.
Definition 25.1 (Air mass)
An air mass is a very large body of air in which the temperature and the humidity are nearly the same everywhere at a given height. It takes them from the region where it formed, its source region.
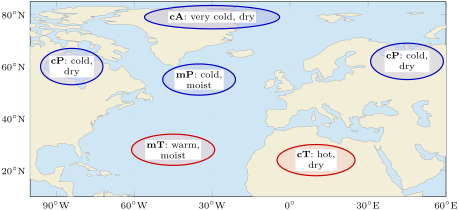
Forecasters name an air mass with two letters. The first says where it formed: c (continental) over land, so it is dry; m (maritime) over an ocean, so it is moist. The second says how cold it is: A (arctic) over the polar regions, P (polar) over the high latitudes, T (tropical) over the low latitudes. Air from a hot desert is cT, hot and dry; air from the Arctic is cA, very cold and dry.
25.2 Fronts
When an air mass moves, it meets another one. The two do not mix easily: they stay apart, with a narrow boundary between them where the weather changes.
Definition 25.2 (Front)
A front is the boundary at the ground between two air masses of different temperature and humidity. At a cold front, cold air pushes into warmer air and takes its place; at a warm front, warm air pushes into colder air and takes its place.
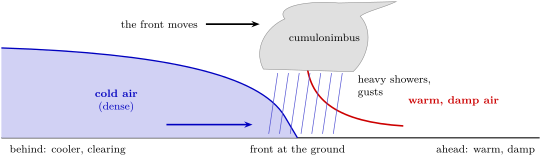
Cold air is denser than warm air. At a cold front, the cold air slides under the warm air like a wedge and lifts it up sharply. The warm, damp air rises fast and builds towering clouds, cumulus and cumulonimbus: the front brings heavy showers, sometimes hail and thunder, gusts of wind and a sudden drop in temperature. Once it has passed, the rain stops and the sky clears. A cold front moves fast, up to twice as fast as a warm front.
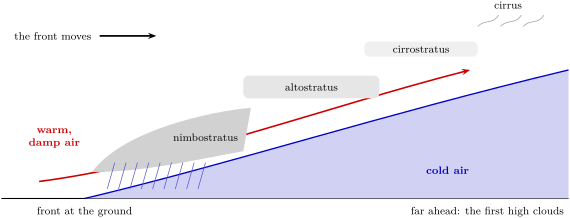
At a warm front, the light warm air cannot push the cold air away from the ground: it climbs slowly over it, on a long and gentle slope. Its clouds therefore appear far ahead of the front, high in the sky: first thin streaks of cirrus, then a veil of cirrostratus, then grey altostratus. As the front comes nearer, the clouds get lower and thicker and a long, steady rain begins. After it has passed, the air is warmer and damper.
On a weather map, a cold front is drawn as a blue line with triangles, a warm front as a red line with half circles. The symbols sit on the side towards which the front is moving. When a fast cold front catches up with a warm front, the two join into an occluded front, drawn in purple with both symbols.
25.3 Depressions and anticyclones
Fronts are born in the great whirls of air that cross the middle latitudes. Where air rises, the pressure at the ground is lower than all around; where it sinks, the pressure is higher.
Definition 25.3 (Depression and anticyclone)
A depression, or low, is a region where the pressure at sea level is lower than all around it. An anticyclone, or high, is a region where it is higher than all around it.
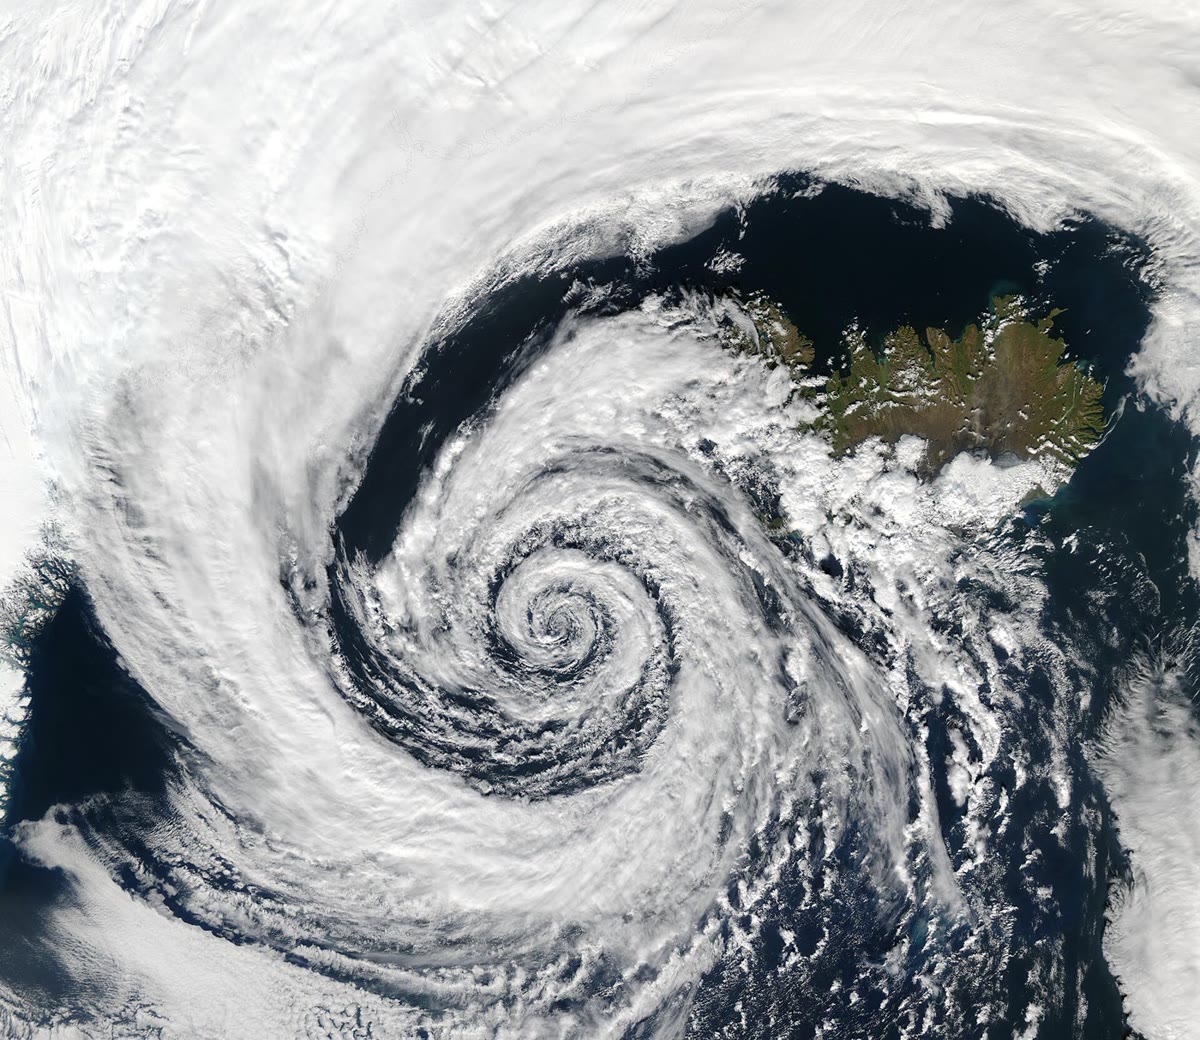
The wind blows from the high towards the low, but the Earth’s rotation turns it aside, so it ends up blowing almost around the centres. In the northern hemisphere it turns anticlockwise around a depression and clockwise around an anticyclone; in the southern hemisphere, the other way round. In a depression, the air flows in near the ground, rises, cools and forms clouds: depressions bring cloud, rain and wind, and their fronts. In an anticyclone, the air sinks and warms as it comes down: anticyclones bring dry, settled weather with light winds. A typical anticyclone has a pressure of about or more at its centre; a deep depression falls below .
25.4 Isobars and weather maps
To see the depressions and anticyclones, forecasters draw maps of the pressure. Every station measures its pressure and reduces it to sea level, so that a station on a mountain can be compared with one on the coast. Then lines are drawn through all the places where the pressure is the same.
Definition 25.4 (Isobar)
An isobar is a line on a map joining places where the pressure at sea level is the same. Isobars are labelled in hectopascals and are often drawn every .
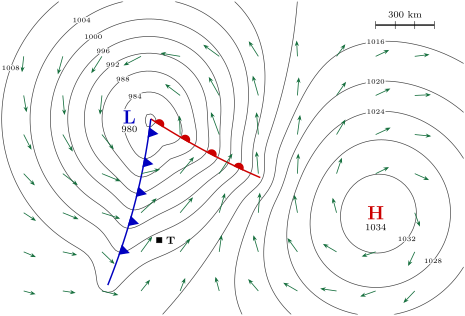
Around a depression the isobars form closed loops, with the lowest pressure at the centre, marked L; around an anticyclone they form loops with the highest pressure at the centre, marked H. Where the isobars are close together, the pressure changes quickly from one place to the next, and the wind is strong; where they are far apart, the wind is light.
Method 25.5 (Reading a weather map)
- Find the centres: L for the depressions, H for the anticyclones, with their pressures.
- Read the isobars: their values rise towards H and fall towards L. Close isobars mean a strong wind.
- Find the wind’s direction: in the northern hemisphere it blows nearly along the isobars, with the low pressure on its left, turned a little towards the low.
- Find the fronts and the way they move (the side of their symbols), then the air on each side: what is coming next?
Example 25.6 (The weather at the town T)
On the map, T lies south of the warm front and east of the cold front: in the warm air between the two fronts. The warm front has already passed it. The isobars run from the south-west to the north-east there, with the low to the north-west: the wind blows from the south-west, warm and damp. The cold front is coming from the west. Its triangles point east, towards the town: within hours there will be a short spell of heavy showers and gusts, then the wind will turn to the west or north-west, the air will get cooler and the sky will clear.
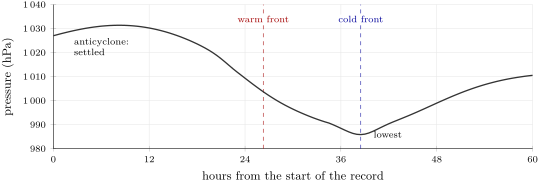
A barometer gives its own warning, even without a map. Suppose the whole map above drifted east, without changing, at an hour, and a recording barometer stood at a station S, east of the fronts. Over two and a half days it would draw the record below.
Example 25.7 (Reading a barometer’s record)
For the first 8 hours the pressure rises to about : the anticyclone passes over S, with settled weather. Then it falls for 30 hours, by about : the depression is coming. It falls fastest a few hours before the warm front passes, more slowly in the warm air behind it, and reaches its lowest, about , just as the cold front passes. Then it rises: the depression is moving away, and the cooler, clearer air behind the cold front arrives.
25.5 How a forecast is made
Definition 25.8 (Weather forecast)
A weather forecast is a statement of the weather expected at a place over the coming hours or days, worked out from observations of the atmosphere and from the laws of physics.
A forecast is made in three steps. First, weather services around the world make millions of observations every day: temperature, rainfall, pressure, wind and humidity, measured at ground stations, at sea, by weather balloons, by radar and from satellites. Then these observations are fed into computer models: very powerful computers work out, step by step, how the atmosphere will change from its present state. Finally, forecasters read the results, compare them with what they know of their region, and write the forecast.
History — The first public forecast
In 1854 a naval officer, Robert FitzRoy, was put at the head of a new weather office in London. Every morning at 9 o’clock, stations around the coasts measured the weather and sent their readings to London by the telegraph, the newest invention of the day. In 1859 a terrible storm, the Royal Charter gale, sank many ships; FitzRoy then set up a service of storm warnings for sailors, which began in February 1861. On 1 August 1861 he went further and published the first public weather forecast in a newspaper, The Times. His forecasts looked one or two days ahead and were very general; they were the start of the forecasts we read today.
Forecasts have become much better. Over the past decades, forecasters have gained about one extra day of good forecast every ten years: a forecast for four days ahead is now as good as a forecast for one day ahead was thirty years ago. But the further ahead a forecast looks, the less sure it is, because small errors in the starting observations grow as the computer goes forward in time.
In the field — Watching a front arrive
On a day when the forecast announces a front, look at the sky every few hours and note the time, the clouds, the wind and the temperature. Before a warm front, do high streaks of cirrus come first? When a cold front passes, does the temperature drop and the wind change? Compare your notes with the weather map of the day.
25.6 Exercises
Exercise 25.1 ★
Give the meaning of each pair of letters and say whether the air mass is warm or cold, damp or dry: (a) mT; (b) cP; (c) cT; (d) mP.
Solution
Solution of Exercise 25.1.
(a) Maritime tropical: warm and damp. (b) Continental polar: cold and dry. (c) Continental tropical: hot and dry. (d) Maritime polar: cold and damp.
Exercise 25.2 ★
Match each sign of a weather map with its meaning: a blue line with triangles; a red line with half circles; a line joining places with the same pressure; the letter H; the letter L.
Solution
Solution of Exercise 25.2.
Blue line with triangles: a cold front. Red line with half circles: a warm front. Line joining places with the same pressure: an isobar. H: the centre of an anticyclone (high pressure). L: the centre of a depression (low pressure).
Exercise 25.3 ★
True or false? Correct the false sentences. (a) Anticyclones usually bring settled weather. (b) The clouds of a warm front arrive after the front. (c) Close isobars mean a light wind. (d) Cold air is denser than warm air.
Solution
Solution of Exercise 25.3.
(a) True. (b) False: they arrive before it, far ahead, high in the sky. (c) False: close isobars mean a strong wind. (d) True.
Exercise 25.4 ★
On the weather map of this chapter: (a) what is the pressure at the centre of the depression? (b) Of the anticyclone? (c) How many hectopascals separate two neighbouring isobars? (d) By how many hectopascals does the pressure differ between the two centres?
Solution
Solution of Exercise 25.4.
(a) . (b) . (c) . (d) .
Exercise 25.5 ★★
Put these events in the order in which they happen when a warm front approaches and passes: steady rain; thin streaks of cirrus; a grey veil of altostratus; warmer, damper air; the clouds come lower and thicker.
Exercise 25.6 ★★
Explain why the clouds of a cold front are towering, while those of a warm front are spread in layers. Use the words wedge, steep, gentle slope.
Solution
Solution of Exercise 25.6.
At a cold front, the dense cold air pushes under the warm air like a wedge: the warm air is lifted on a steep slope, rises fast and builds tall clouds. At a warm front, the warm air climbs slowly over the cold air on a gentle slope: it rises little by little over a long distance, and its clouds spread out in layers.
Exercise 25.7 ★★
On the weather map: (a) where is the wind strongest, near L or near H? How can you tell? (b) North of L, from which direction does the wind blow? (c) South of H? (d) Does the wind turn clockwise or anticlockwise around L?
Solution
Solution of Exercise 25.7.
(a) Near L: the isobars are closer together there, and the arrows are longer. (b) From the east (the arrows point west, a little towards the south-west). (c) From the east (the arrows point west). (d) Anticlockwise.
Exercise 25.8 ★★
A barometer in a town reads at 6:00, at 12:00 and at 18:00. (a) By how much does the pressure fall in 12 hours? (b) What is coming towards the town, a depression or an anticyclone? (c) What weather can the town expect?
Solution
Solution of Exercise 25.8.
(a) . (b) A depression: the pressure keeps falling. (c) Clouds, wind and rain, probably with a front.
Exercise 25.9 ★★
Air that has stayed for a week over the Sahara moves north over the Mediterranean Sea. (a) Name this air mass with its two letters. (b) Is it hot or cold, damp or dry, when it leaves? (c) What could change in its character as it crosses the sea?
Exercise 25.10 ★★
A forecast for four days ahead is now as good as a forecast for one day ahead was thirty years ago. (a) How many days of good forecast have been gained in thirty years? (b) How many is that for each ten years? (c) If the same progress went on, in how many years would a five-day forecast be as good as today’s one-day forecast?
Solution
Solution of Exercise 25.10.
(a) days. (b) day for each ten years. (c) It needs more days: about 40 years.
Exercise 25.11 ★★★
On the weather map, use the scale bar. (a) About how many kilometres separate the centre L from the centre H? (b) Near L, two neighbouring isobars are about apart. By how many hectopascals does the pressure change over there? (c) Near H, two neighbouring isobars are about apart. Same question. (d) Where is the wind stronger? Do the arrows of the map agree?
Solution
Solution of Exercise 25.11.
(a) About (four and a half scale bars). (b) over : per . (c) per . (d) Near L, where the pressure changes faster; yes, the arrows are longer near L.
Exercise 25.12 ★★★
A cold front lies west of a town and moves east at per hour; a warm front lies west of another town and moves at half that speed. (a) Which front reaches its town first, and how many hours earlier? (b) Describe the weather each town will see when its front passes. (c) Which town will be warmer once its front has passed?
Solution
Solution of Exercise 25.12.
(a) The cold front: hours. The warm front moves at per hour: hours. The cold front arrives 2 hours earlier. (b) First town: towering clouds, heavy showers, gusts, then cooler air and a clearing sky. Second town: lowering layered clouds and a long, steady rain, then warmer, damper air. (c) The second town, reached by warm air.
25.7 Problem: Will the match be rained off?
Problem 25.1
Weekend problem — a football match is planned for 15:00 in the town T of the weather map; the cold front is coming: its speed is measured on two maps and the hour it reaches the town is forecast
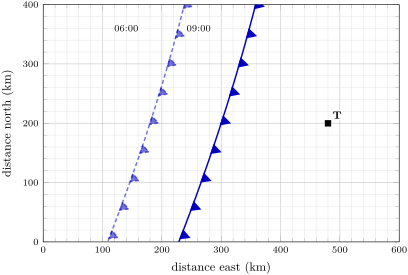
At 09:00 a young forecaster looks at the weather map of this chapter, then at the map below: it shows the cold front near the town at 06:00 and at 09:00, on a grid of squares of .
Part I — Reading the map.
- On the weather map of the chapter, is the town in the warm air or in the cold air? Which front has already passed over it?
- From which direction does the wind blow at the town?
- Which way is the cold front moving? How can you tell from its symbols?
- What weather will the cold front bring when it passes?
Part II — The front’s speed.
- On the map above, at the height of the town, how far east is the front at 06:00? At 09:00?
- How many kilometres has the front moved in these three hours?
- What is its speed, in kilometres per hour?
- At 09:00, how many kilometres separate the front from the town?
Part III — The forecast.
- If the front keeps the same speed, how many hours will it need to reach the town?
- At what time will it reach the town?
- Suppose the heavy showers last about one hour after the front passes. Will it still be raining at 15:00?
- The front could slow down to per hour. When would it reach the town then? Write the forecast for the match in one or two sentences, giving both possible hours.
Solution
Solution of Problem 25.1.
1. In the warm air, between the two fronts. The warm front has already passed.
2. From the south-west.
3. Towards the east: the triangles of a cold front lie on the side towards which it moves, and they point east, towards the town.
4. Towering clouds, heavy showers, perhaps thunder and hail, gusts of wind; then cooler air, a wind from the west or north-west and a clearing sky.
5. At at 06:00 and at at 09:00.
6. .
7. per hour.
8. The town is at : .
9. hours, that is 4 hours and 30 minutes.
10. 09:00 + 4 h 30 min = 13:30.
11. No: the showers should end at about 14:30, before the kick-off.
12. hours: at 15:00, just at the kick-off. Forecast: “The cold front should reach the town at about 13:30, with an hour of heavy showers and gusts, then clearing skies: the match can most likely be played. If the front slows down, it could arrive at 15:00 and delay the match.”