Primary & Middle School Earth and Space Sciences · Grades 1–9
27Ice on Earth
The two photographs below were taken from the same place, on a lagoon in Alaska, 26 years apart. In 1990, a wide tongue of ice came down the valley all the way to the water. In 2016, the ice had pulled back up the valley and grown narrower; trees and bare rock filled the space it had left. Between 1984 and 2021, satellite images show that the front of this glacier, Pedersen Glacier, moved back about .
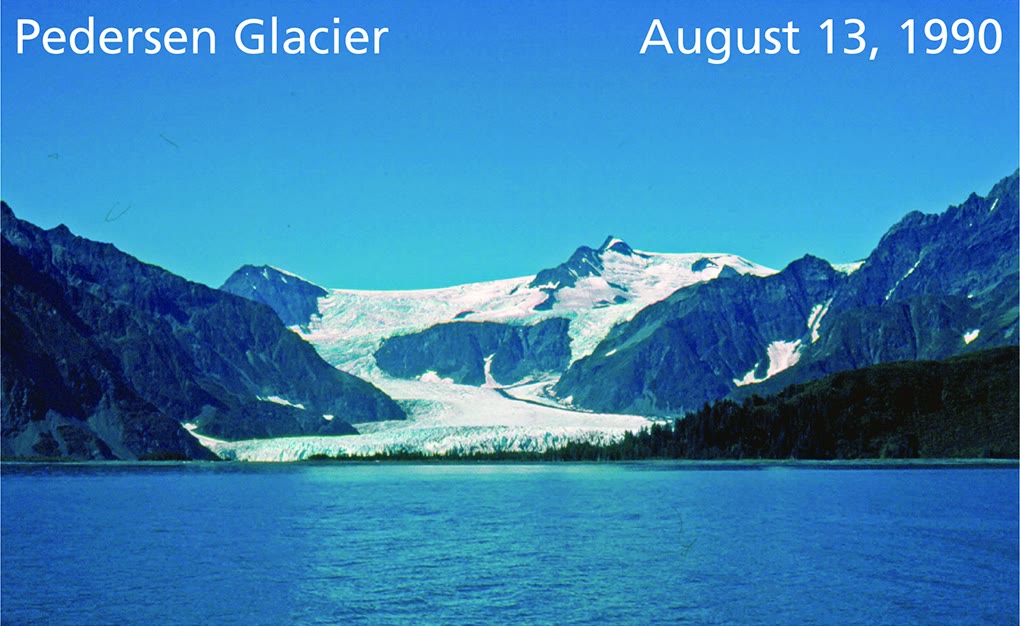
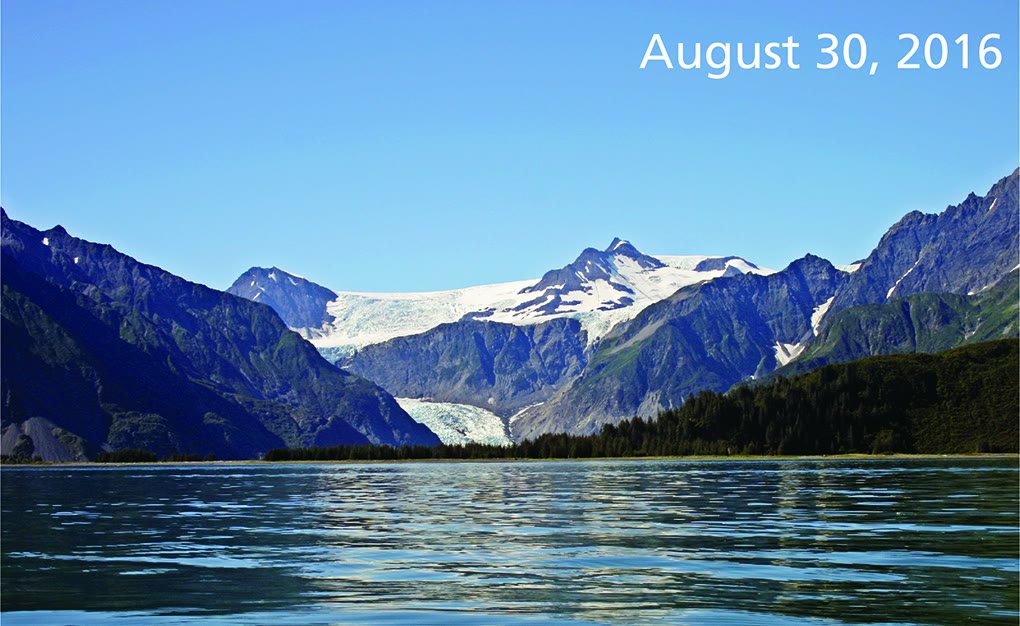
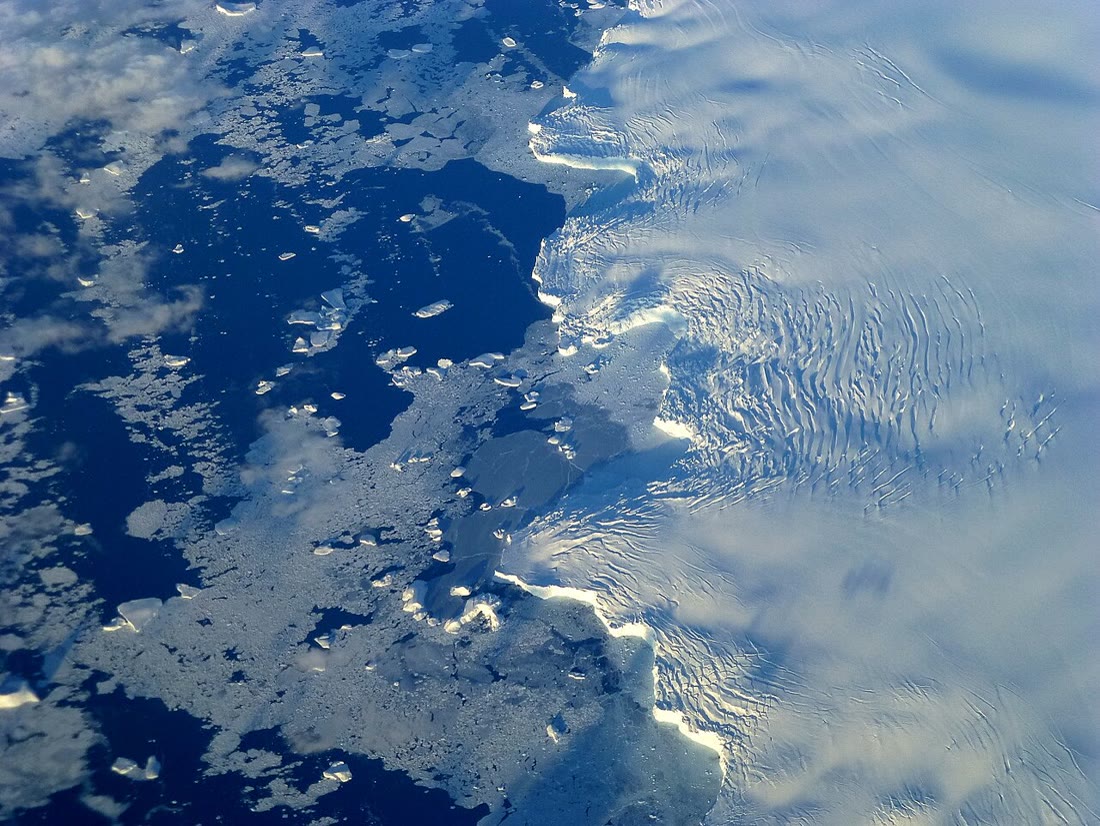
Ice covers about a tenth of the land on Earth today. It lies in mountain valleys, in two huge sheets over Antarctica and Greenland, on the polar seas and, hidden, inside the frozen ground of the far north. This chapter looks at each of them in turn, at how ice shapes the land, and at the times when ice covered much more of the Earth than it does now.
You already know
Snow is one kind of precipitation: ice crystals that grow in a cloud and fall without melting (Chapter 7). Running water erodes the land, carries the pieces away and deposits them further down; a river cuts a valley (Chapter 10). When sea water freezes, the salt is left behind in the water around the ice (Chapter 26). In physics, you learn that water expands when it freezes, so ice is less dense than liquid water, and that a body lighter than the water it pushes aside floats.
27.1 Glaciers
High in the mountains, more snow falls in winter than melts in summer. Year after year, new snow buries the old snow and presses it down. The crystals pack together, the air between them is squeezed out, and after about a year the snow has become firn, a grainy material between snow and ice. Buried deeper and deeper, the firn turns into hard, solid ice; for most glaciers this takes more than a hundred years.
Definition 27.1 (Glacier)
A glacier is a mass of ice, formed from snow piled up over many years, that moves slowly downhill over the land under its own weight.
A glacier has two parts. In its upper part, the accumulation area, more snow falls each year than melts: the glacier gains ice. In its lower part, the ablation area, more ice melts each year than snow falls: the glacier loses ice. The ice gained above keeps flowing down to replace the ice lost below. If the two balance, the front of the glacier, its snout, stays in the same place.
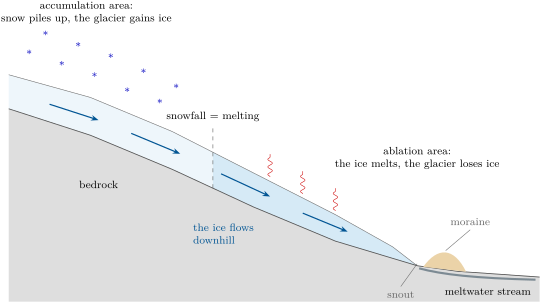
How can solid ice flow? Under the weight of the ice above it, the ice deep in a glacier slowly deforms, the way a thick layer of cold honey spreads. The glacier also slides over the rock below it, on a thin film of water or on wet mud. The bottom of the glacier, rubbing on the rock, moves more slowly than its top. Most glaciers move slowly and steadily; a few suddenly surge. In 1986, Hubbard Glacier in Alaska surged forward about a day, and the fastest surge on record, Kutiah Glacier in Pakistan in 1953, averaged about a day for three months.
When a glacier loses more ice below than it gains above, its snout moves back up the valley: the glacier retreats. A retreating glacier still flows downhill, like a conveyor belt; it just melts faster than it flows. Muir Glacier, in Alaska, filled its whole valley down to the sea in 1941. By 2004, its snout had moved back , and the ice surface had come down by more than .
27.2 How ice shapes a valley
A glacier is a powerful tool of erosion. Its ice freezes onto blocks of loose rock and plucks them away; the stones frozen into its base scrape the rock below like sandpaper. The glacier carries all this rock, from fine dust to huge boulders, down the valley like a conveyor belt, and drops it where the ice melts.
Definition 27.2 (U-shaped valley and moraine)
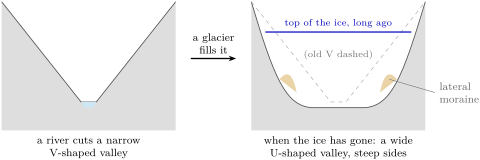
A U-shaped valley is a valley with a broad, flat floor and steep sides, carved by a glacier that widened and deepened a narrow V-shaped river valley. A moraine is a ridge of rock debris, from dust to boulders, left by a glacier: a lateral moraine along its side, a terminal moraine at its end.
Moraines are useful clues. A terminal moraine far down a valley, with no ice anywhere near it, shows how far the glacier once reached; a lateral moraine high on a valley side shows how thick the ice once was. A large boulder resting alone on a field, made of a rock found nowhere nearby, is another clue: it is an erratic, a rock carried far from its home by a glacier and left behind when the ice melted. Erratics range from pebbles to blocks larger than a house.
In the field — Reading a valley shaped by ice
On a walk in the mountains, or in a photograph of a mountain valley, look at the shape of the valley in cross-section: a narrow V, or a wide U with steep walls? Look across the valley floor for long ridges of jumbled stones and soil running along its sides or across it: they may be moraines. Look for big boulders that do not match the rock around them, and for smooth rock surfaces scratched by long parallel lines. Stay on the paths, keep away from the edges of steep slopes and from the ice itself, and draw what you see in your notebook.
27.3 Ice sheets, ice shelves and icebergs
The largest masses of ice on Earth are not in mountain valleys: they cover whole lands. The Antarctic ice sheet spreads over almost million and is nearly thick at its thickest. The Greenland ice sheet covers about million , four-fifths of the island, and is over thick. Together they hold more than 99 % of the ice on land, and more than two-thirds of all the fresh water on Earth.
Definition 27.3 (Ice sheet, ice shelf and iceberg)
An ice sheet is a mass of ice covering more than of land, like a huge dome that spreads outwards in all directions. Where ice flowing off the land reaches the sea and goes on floating on it, still joined to the ice behind it, it forms an ice shelf. An iceberg is a large block of ice, more than across, that has broken off a glacier or an ice shelf and floats in the sea.
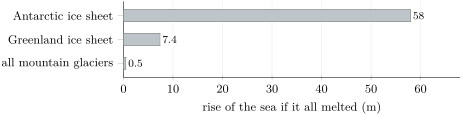
The water locked in the ice sheets came from the ocean: it evaporated, fell as snow and piled up on land. If all the ice of Greenland melted, the sea would rise by about ; if all the ice of Antarctica melted, by about . All the mountain glaciers of the world, more than of them, would add less than half a metre.
Floating ice is different. An ice shelf or an iceberg already floats on the sea: it has already pushed aside its own weight of water. When it breaks up or melts, the sea does not rise. But an ice shelf holds back the glaciers behind it, like a cork in a bottle; when the Larsen B ice shelf in Antarctica broke apart in 2002, the glaciers behind it sped up, some to eight times their former speed, and poured more land ice into the sea.
In the lab — Floating ice and ice on land
Indoors, put a small stone in each of two clear glasses so that it sticks out above the water when you fill them. In the first glass, float a few ice cubes on the water. In the second, balance the same number of ice cubes on the stone, out of the water. Fill both glasses with water to the same level and mark it with a felt pen. Wait until all the ice has melted, then compare the water levels with the marks. Which glass behaves like the sea when an iceberg melts, and which like the sea when an ice sheet melts?
27.4 Sea ice
Sea ice is something else again: it is the sea itself, frozen. Each winter the surface of the polar oceans freezes over a vast area; each summer much of this ice melts again. In the Arctic, the ice is smallest at the end of the summer, in September, and largest at the end of the winter, in March. Satellites have measured its extent, the area of sea where at least 15 % of the surface is covered with ice, every day since the late 1970s.
Definition 27.4 (Sea ice)
Sea ice is frozen sea water: it forms, grows and melts in the ocean itself. It is different from icebergs and ice shelves, which float on the sea but were made of snow fallen on land.
Sea ice matters far beyond the poles. Open sea water is dark: it reflects only about 6 % of the sunlight that reaches it and absorbs the rest. Sea ice reflects 50 to 70 %, and sea ice covered with snow up to 90 %. When the ice melts, the dark water underneath absorbs more of the Sun’s energy and warms, which melts more ice.
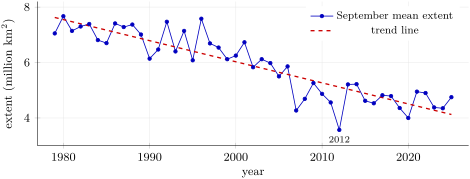
The points go up and down from one year to the next: the weather of each summer counts. But over the years they clearly come down. To see the change through the ups and downs, scientists draw a trend line, the straight line that passes as close as possible to all the points.
Method 27.5 (Reading a trend on a graph)
- Read the axes: what is measured, in which unit, over which years.
- Look at the points: is there a general rise, a general fall, or neither, behind the ups and downs?
- Read the trend line at the first year and at the last year.
- Take the difference, and divide by the number of years (or of decades) between them: this is the average change per year (or per decade).
- Do not read too much into one year: a single point far from the line is weather, the line is the trend.
Example 27.6 (The Arctic’s September ice)
On the graph, the trend line is at about million in 1979 and about million in 2025. The change is million km in years, that is 4.6 decades: . The September sea ice has shrunk by about million per decade: in 46 years, the trend line has lost almost half of its 1979 value. The lowest point, million in 2012, sits well below the line: that summer was an exceptional one.
Measurements show that the summer sea ice of the Arctic has become both smaller and thinner since the 1980s, as the Arctic has warmed. Chapter 28 looks at how the Earth’s climate is changing, and why.
27.5 Permafrost
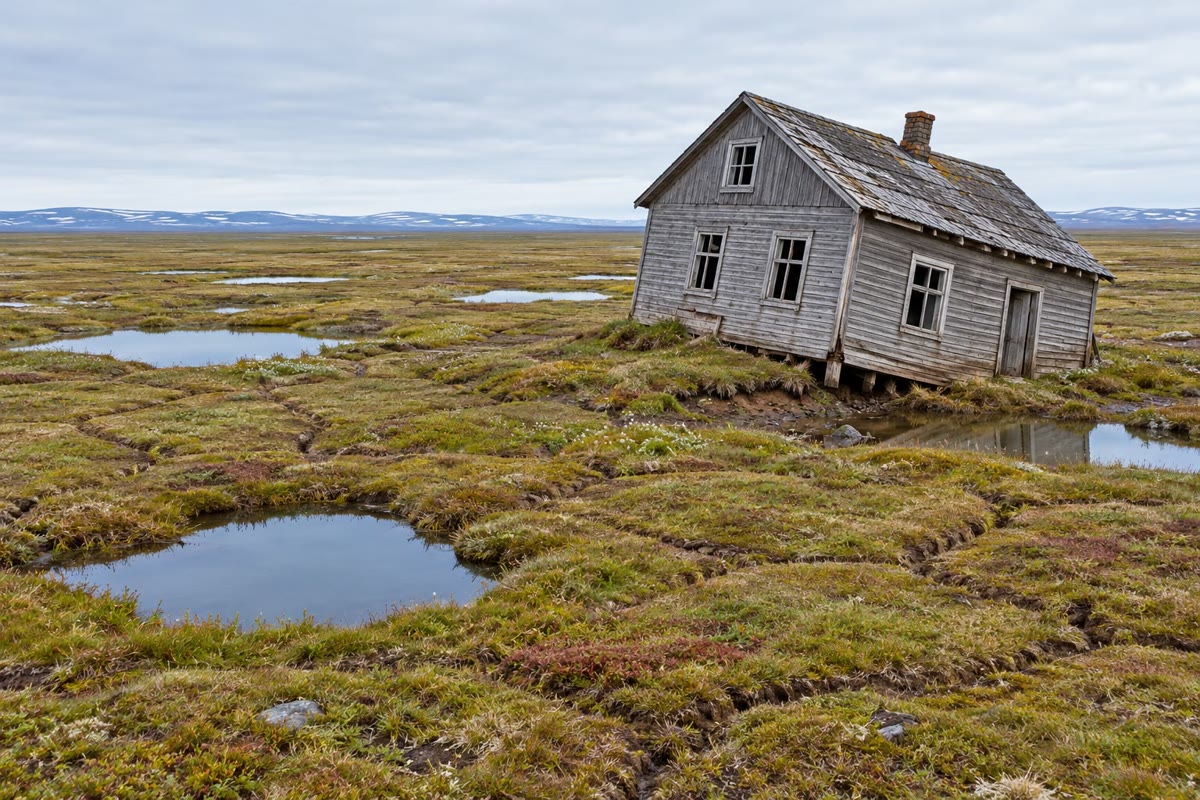
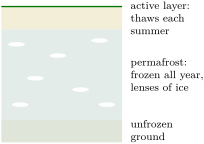
In the far north, the cold reaches deep into the ground. Under the tundra of North America, Greenland and northern Asia, the soil and rock stay frozen all year round, and have often been frozen for thousands of years. Only a thin top layer, the active layer, thaws each summer and freezes again each winter; plants grow in it, and water that cannot drain into the frozen ground below lies in pools on the surface.
Definition 27.7 (Permafrost)
Permafrost is ground, soil or rock, that stays at or below for at least two years in a row.
Permafrost lies under about million , a quarter of the land of the northern hemisphere, and under about 85 % of Alaska. Frozen ground full of ice is as hard as rock; when its ice melts, the ground turns to mud and sinks. Roads crack, buildings tilt, and pipelines can break: where it crosses permafrost, the Trans-Alaska Pipeline runs above the ground for . Thawing permafrost also lets the remains of plants frozen in it for thousands of years decay, and release carbon dioxide and methane into the air.
27.6 The ice ages
Ice has not always covered the same part of the Earth. About years ago, ice sheets covered much of North America and of northern Europe, including Scandinavia. Glaciers then covered about a quarter of the land, against about a tenth today. So much water was locked up in this ice that the sea stood more than lower than today: parts of today’s continental shelves were dry land. From about years ago the ice sheets melted back, and the sea rose; it reached roughly its present level about years ago.
Definition 27.8 (Ice age)
An ice age is a long cold time in the Earth’s history when ice sheets spread far beyond the polar regions and cover large parts of the continents. The last ice age was at its coldest about years ago and ended about years ago.
The clues of the last ice age are everywhere in the lands it covered: U-shaped valleys far from any glacier today, terminal moraines across plains, erratic boulders lying on fields. And it was not the only one. Over the last few hundred thousand years, the ice ages and the warmer times between them have followed one another again and again; we live in one of the warm times. Chapter 28 tells how scientists read this long story in the ice of Antarctica itself.
27.7 Exercises
Exercise 27.1 ★
Using the long section of a glacier in this chapter, name: (a) the part of the glacier where it gains ice; (b) the part where it loses ice; (c) the front of the glacier; (d) the ridge of rock debris at its end.
Solution
Solution of Exercise 27.1.
(a) The accumulation area. (b) The ablation area. (c) The snout. (d) A (terminal) moraine.
Exercise 27.2 ★
True or false? Correct the false sentences. (a) A glacier is made of frozen sea water. (b) Snow takes about a year to become firn. (c) When a glacier retreats, its ice flows uphill. (d) Sea ice is smallest in the Arctic in September.
Exercise 27.3 ★
Give the word for each description: (a) a valley with a broad floor and steep sides, carved by ice; (b) a boulder carried far from its home by a glacier; (c) a floating plate of ice still joined to the ice on land; (d) ground that stays frozen for at least two years in a row.
Solution
Solution of Exercise 27.3.
(a) A U-shaped valley. (b) An erratic. (c) An ice shelf. (d) Permafrost.
Exercise 27.4 ★
(a) Which two lands are covered by ice sheets today? (b) Which of the two would raise the sea more if all its ice melted, and by how much? (c) What share of the land on Earth is covered by ice today?
Solution
Solution of Exercise 27.4.
(a) Antarctica and Greenland. (b) Antarctica, by about (Greenland: about ). (c) About a tenth (10 %).
Exercise 27.5 ★★
Use the graph of the Arctic sea ice in September. (a) Read the extent in 1979 and in 2012. (b) By how many million km did it shrink between these two years? (c) What fraction of the 1979 extent had gone in 2012? Round to a simple fraction. (d) Why is it more reliable to compare the trend line than two single years?
Solution
Solution of Exercise 27.5.
(a) About million in 1979 and million in 2012. (b) : about million . (c) : about half. (d) A single year depends on the weather of that summer: 2012 is far below the line. The trend line uses all the years, so one unusual summer changes it very little.
Exercise 27.6 ★★
Muir Glacier’s snout moved back between 1941 and 2004. (a) How many years is that? (b) What was its average retreat per year, in metres? Round to the nearest ten metres. (c) Pedersen Glacier moved back between 1984 and 2021. What was its average retreat per year? (d) Which glacier retreated faster?
Solution
Solution of Exercise 27.6.
(a) years. (b) : about a year. (c) years; : about a year. (d) Muir Glacier, more than twice as fast.
Exercise 27.7 ★★
Explain, in a few sentences and in order, how snow falling high on a mountain becomes the ice of a glacier’s snout, far down the valley. Use the words firn, accumulation area, flows and ablation area.
Solution
Solution of Exercise 27.7.
In the accumulation area, high on the mountain, more snow falls each year than melts. New snow buries and presses the old snow, which turns into firn after about a year, then, deeper down and much later, into solid ice. Under its own weight the ice flows slowly down the valley. Lower down, in the ablation area, it melts faster than snow falls; the ice that reaches the snout is ice that formed high up, often long ago.
Exercise 27.8 ★★
Two glasses are filled to the same level. In glass A, ice cubes float on the water; in glass B, the same ice cubes rest on a stone above the water. (a) After the ice has melted, in which glass has the level risen? (b) Which glass is a model of an iceberg melting in the sea? Of an ice sheet melting on land? (c) Why does the breaking up of an ice shelf still matter for the level of the sea?
Solution
Solution of Exercise 27.8.
(a) In glass B: the melted ice runs into the water and raises it; in glass A the level stays where it was. (b) Glass A is the iceberg (ice already floating in the sea); glass B is the ice sheet (ice on land). (c) An ice shelf holds back the glaciers behind it. When it breaks up, these glaciers speed up and pour more land ice into the sea, and that raises it.
Exercise 27.9 ★★
A walker crosses a wide valley with a flat floor and very steep sides. In the middle of a field she finds a granite boulder as big as a car; all the rocks of the valley are limestone. Higher up, a long ridge of jumbled stones runs along the valley side. (a) What shape is the valley, and what carved it? (b) How did the boulder get there? What is it called? (c) What is the ridge, and what does its height on the valley side tell you?
Solution
Solution of Exercise 27.9.
(a) A U-shaped valley, carved by a glacier. (b) A glacier carried it from far up the valley, where there is granite, and left it when the ice melted: it is an erratic. (c) A lateral moraine: its height shows how thick the glacier once was; the ice reached at least that high on the valley side.
Exercise 27.10 ★★
The Antarctic ice sheet would raise the sea by about if it all melted, and the Greenland ice sheet by about . (a) What would a tenth of the Greenland ice add? (b) What would a hundredth of the Antarctic ice add? (c) How many times more does Antarctica hold than Greenland? Round to the nearest whole number.
Solution
Solution of Exercise 27.10.
(a) . (b) . (c) : about 8 times more.
Exercise 27.11 ★★★
The mean extent of the Arctic sea ice in September was million over the years 1980–1989 and million over the years 2010–2019. (a) One million is . Write both values in km, without the word “million”. (b) By how much did the mean extent fall between these two decades? (c) The two decades are 30 years apart. What is the fall per decade? Compare it with the trend line’s million per decade. (d) Why can a straight trend line not be extended forever into the future?
Solution
Solution of Exercise 27.11.
(a) and . (b) , that is . (c) : about million per decade, a little more than the trend line’s million ; each decade mean still carries the ups and downs of its own ten summers, but both ways of reading the graph show the same large loss. (d) The extent cannot fall below zero, and a trend line only describes the years that were measured: what happens next depends on how the Arctic’s climate changes, so the line is not a forecast.
Exercise 27.12 ★★★
About years ago the sea stood about lower than today. Off a coast, the continental shelf slopes down very gently, by for every out to sea (exercise data). (a) How far out to sea was the coast at that time? (b) Where did the water of the missing go? (c) Explain why a terminal moraine found today on a plain, far from any mountains, is a clue to the same ice age.
Solution
Solution of Exercise 27.12.
(a) : the coast was about further out to sea. (b) It had evaporated from the ocean, fallen as snow on the continents and stayed there as the ice of the great ice sheets. (c) A terminal moraine forms at the end of a glacier. One on a plain far from any mountains shows that an ice sheet once reached that plain, at a time when ice covered much more land than today.
27.8 Problem: A glacier’s long retreat
Problem 27.1
Weekend problem — the front of a mountain glacier has been measured every ten years since 1960; its speed of retreat is worked out, and the valley it leaves is read
Every ten years since 1960, a team has measured the position of the snout of Glacier G, a valley glacier in the mountains. The distance is measured up the valley from a rock marker R, painted on the valley floor at the snout in 1960. A hut H stands beside the valley floor, up the valley from R. The map shows the snout at each measurement and the ridge just below the 1960 snout.
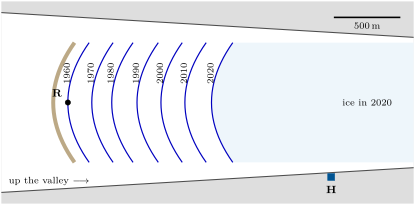
| year | 1960 | 1970 | 1980 | 1990 | 2000 | 2010 | 2020 |
|---|---|---|---|---|---|---|---|
| distance of the snout from R (m) | 0 | 180 | 330 | 520 | 700 | 880 | 1080 |
Part I — The snout’s positions.
- How far did the snout move back between 1960 and 2020?
- Work out how far it moved back in each decade. In which decade did it move back the least? The most?
- Has the glacier stopped flowing downhill? Explain.
- The dark ridge just below the 1960 snout is made of jumbled rock debris. What is it called, and how did it form?
Part II — The speed of retreat.
- What was the average retreat per decade between 1960 and 2020?
- And per year?
- Muir Glacier moved back in 63 years, about a year. How many times faster was that than Glacier G?
- Did Glacier G gain more ice in its accumulation area than it lost in its ablation area, or less? Explain.
Part III — The valley it leaves.
- What shape would you expect the valley floor between R and the 2020 snout to have in cross-section? Why?
- In 2020, how far was the snout from the level of the hut?
- At the average speed of Part II, how many years would the snout need to reach the level of the hut? In which year would that be?
- Give one reason why this year is not a forecast.
Solution
Solution of Problem 27.1.
1. .
2. 1960–1970: ; 1970–1980: ; 1980–1990: ; 1990–2000: ; 2000–2010: ; 2010–2020: . The least in 1970–1980, the most in 2010–2020.
3. No: a retreating glacier still flows downhill. Its snout moves back because the ice melts faster than it arrives.
4. A terminal moraine: the ice carried rock debris down the valley and dropped it at its snout, where the ice melted, while the snout stood there.
5. per decade.
6. a year.
7. : about 11 times faster.
8. Less: it lost more ice in its ablation area than it gained in its accumulation area, so its snout moved back.
9. U-shaped: a broad floor with steep sides, because the glacier widened and deepened the valley while it filled it.
10. .
11. years: in 2070.
12. The speed changed from decade to decade (from 150 to ), and the future retreat depends on the snowfall and the summer temperatures of the years to come: a past rate is not a forecast.