Primary & Middle School Earth and Space Sciences · Grades 1–9
29Living with Natural Risks
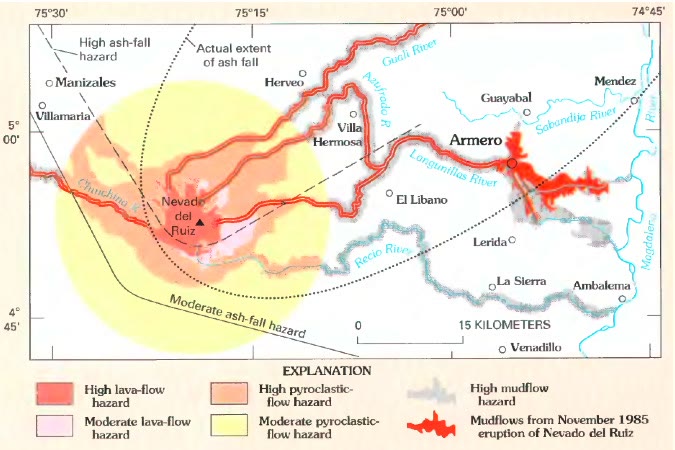
Late in the evening of 13 November 1985, most of the people of Armero, a town of Colombia, were in bed. A storm hid the snow-capped volcano Nevado del Ruiz, away, and nobody in the town saw it erupt. The hot rocks melted part of its ice, and the water, mixed with ash and rock, rushed down the valleys as mudflows. About two hours later, the mudflows poured out of the valley of the river Lagunillas, straight into the town: some people, most of the town, were killed. Two hours was time enough to walk to higher ground. The people of Armero were not told.
Six years later, at Mount Pinatubo in the Philippines, the volcano was watched, the warning came in time and the people left (Chapter 19). Both were explosive volcanoes, with people living in the path of their mudflows. What differed was what people knew, and what they did with it. This chapter is about that difference.
You already know
A natural hazard is a natural event that can harm people; it becomes a natural disaster when it strikes where people live and does great harm (Chapter 12). A river that overflows covers its floodplain (Chapter 10). A volcano often gives warning signs before a large eruption: small earthquakes, swelling slopes, gas (Chapter 19). Scientists cannot predict earthquakes; seismometers record them, and an earthquake under the sea can set off a tsunami (Chapter 20). A weather forecast says what the weather will be in the coming days (Chapter 25).
29.1 Hazard, vulnerability and risk
The same earthquake does not do the same harm everywhere. Under an empty desert it harms no one. Under a town of strong buildings whose people know what to do, it shakes, frightens and breaks windows. Under a town of heavy, badly built houses, it can bring them down on the people inside. The hazard is the same; what changes is how easily the place can be harmed.
Definition 29.1 (Vulnerability)
The vulnerability of a place is how easily its people, its buildings and the things they need can be harmed by a natural hazard. Homes on a floodplain, weak buildings, no warning and no plan make a place vulnerable.
Definition 29.2 (Risk)
The risk that a place faces from a natural hazard is the danger of harm to its people and their goods. It depends both on the hazard, how strong and how frequent it is, and on the vulnerability of the place: where there is no hazard, or nothing that can be harmed, there is no risk.
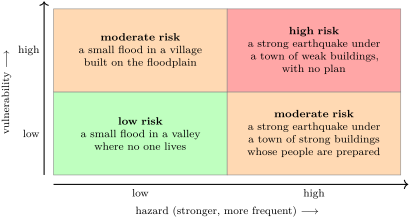
Armero was a place of high hazard: a snow-capped volcano that had woken a year before, and a town built on the deposits of old mudflows, at the mouth of a valley that had carried them before. It was also highly vulnerable: the scientists lacked instruments and support, the information given to the authorities was often vague, and no evacuation plan and no quick way to warn the town existed.
29.2 Forecasting and prevention
Some hazards can be seen coming. A storm is forecast days ahead (Chapter 25); a flood after heavy rain, hours to days ahead; a large eruption often announces itself days to weeks ahead, though not always. A tsunami crosses an ocean in hours, so a warning can reach distant coasts before it does. Earthquakes, on the other hand, cannot be predicted: scientists can say which faults will break again one day, never the day.
A forecast, however good, is useful only if something is done before the hazard strikes. Most of that work is done long before any warning.
Definition 29.3 (Prevention)
Prevention is everything done before a natural hazard strikes to lower the risk: knowing where the hazard can strike, building in safe places and in safe ways, watching the hazard, warning people and preparing them.
Prevention works on both sides of the risk grid. Watching a volcano or a river does not make it less dangerous, but it gives time to act. Building away from the floodplain, building strong houses, planning the routes to higher ground and practising them all lower the vulnerability.

29.3 Watching volcanoes and faults
A volcano observatory watches the warning signs of Chapter 19 with instruments that run day and night and send their readings to the observatory.
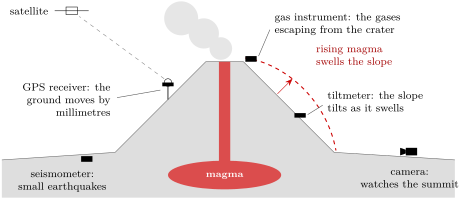
None of these signs gives the day and the hour of an eruption. The scientists read them together, as a doctor reads several measurements of a patient, and say how the danger changes; the authorities decide when to close an area and when to move people out. At Pinatubo this chain worked. At Nevado del Ruiz, the volcano had given signs for a year, with swarms of earthquakes, but the instruments were few, and the chain from the scientists to the people of Armero was broken.
Faults are watched in the same way, by networks of seismometers and of GPS stations that measure, millimetre by millimetre, how the two sides of a fault slowly move. This tells which faults are storing up the strain of the next large earthquake, but not when it will come. For earthquakes, prevention is the main defence.
29.4 Hazard maps and flood zones
The first step of prevention is to know where a hazard can strike.
Definition 29.4 (Hazard map)
A hazard map shows the places that a natural hazard can reach, often with several levels of danger. It is drawn from what the hazard has done in the past and from the shape of the ground.
The map of Nevado del Ruiz, at the start of this chapter, is a hazard map: the mudflows of the past had followed the valleys, and the next ones would follow them too. Flood maps follow the same idea. Water spreads over the low, flat ground beside a river: the higher the flood, the wider the band of ground it covers. A flood map draws the edge of the water for a chosen flood, often the flood that has a chance of 1 in 100 of being reached or passed in any year. It is called the 100-year flood, but it is not a flood that comes once a century: it can come two years in a row.
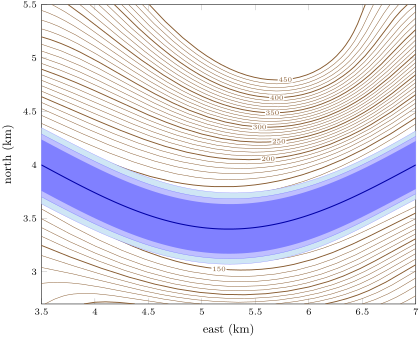

Method 29.5 (Reading a flood-zone map)
- Find which flood the zone stands for: how high above the river, or how often it may come.
- Locate the place on the map, with the scale bar or the grid.
- If the place lies inside the shaded zone, that flood would reach it; if it lies outside, it would stay dry in that flood, not in every flood.
- To compare places, use their heights above the river: the lower, the more often flooded.
Example 29.6 (Three houses beside the river)
On a map like the one above, a house stands on ground above the river. A flood above the river does not reach it; floods of 5 and do. A second house, above the river, is reached only by the flood, and a third, on a slope above the river, by none of the three. The first house is the most vulnerable: smaller floods, which come more often, are enough to reach it.
29.5 Building to resist earthquakes
In an earthquake, the ground moves back and forth under a building, and the building is shaken from below; in a strong earthquake, the danger comes above all from buildings that crack and fall. Engineers cannot stop the shaking, but they can build so that the structure carries the forces of the shaking without falling.
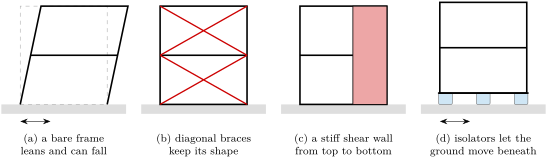
The same principles serve a house, a school or a bridge. They are easiest to apply when the building is designed, rather than added to an old building afterwards.
In the lab — A tower on a shaking tray
Indoors, build two small towers of the same height from drinking straws or wooden sticks and modelling clay, as two-storey frames. Give the second one diagonal braces on every side. Stand both on a tray, then slide the tray quickly back and forth, gently at first, then harder. Which tower leans first? Which one keeps its shape? Then put the bare tower on four marbles under a light card, and shake again: what changes?
29.6 Warnings in time
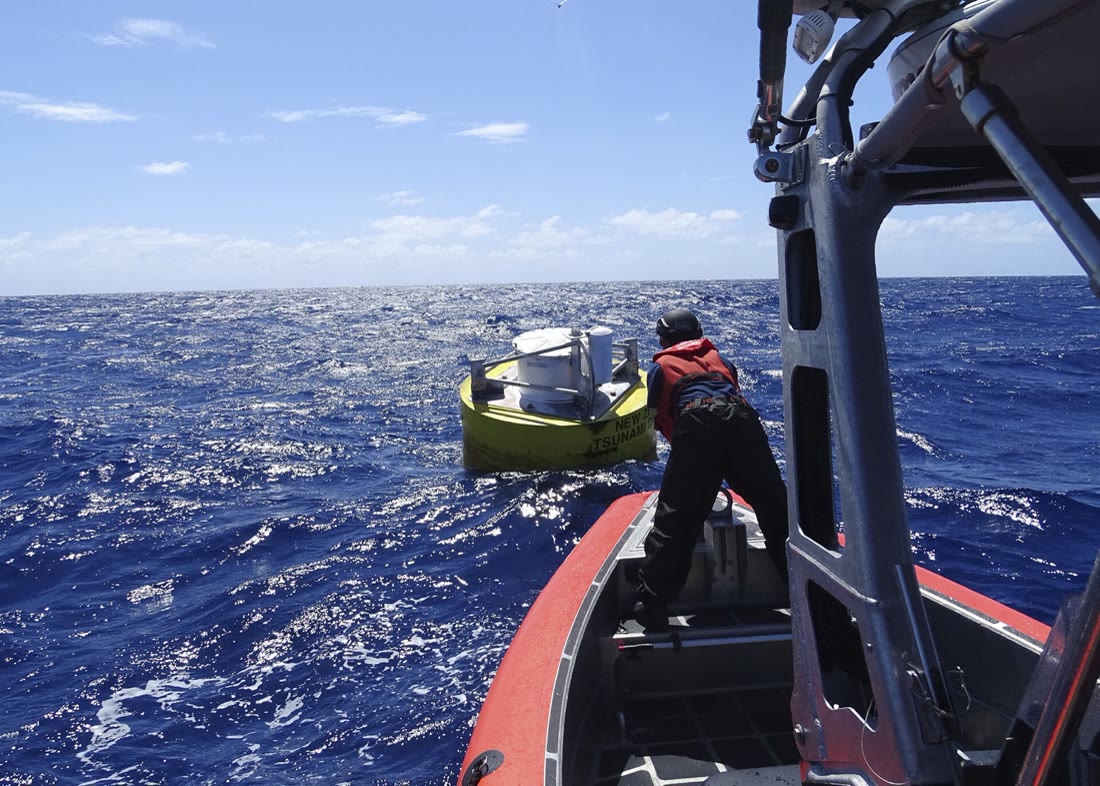
The last part of prevention is the warning. For tsunamis, it starts on the floor of the ocean. At sites near where destructive tsunamis have started before, a pressure recorder lies on the sea floor and reads the weight of the water above it every , which gives the height of the sea surface. It sends its readings by sound through the water to a buoy moored at the surface, and the buoy relays them by satellite to the tsunami warning centres. A rise of the sea far from any coast shows a tsunami on its way, hours before it reaches distant shores.
History — A network of buoys
In 2001 the first array of six such stations was complete, in the Pacific Ocean. After the tsunami of December 2004, which reached the coasts of the Indian Ocean with no warning system in place (Chapter 20), the network grew: by March 2008, there were 39 stations.
A warning saves lives only if it reaches people who know what to do with it: the routes to higher ground are signposted and practised, the emergency kit is ready, schools hold drills. At Armero, the hazard was known and the map was drawn; the warning never reached the town.
29.7 Exercises
Exercise 29.1 ★
Hazard or vulnerability? (a) A river that floods almost every spring. (b) A village with no warning system. (c) Heavy houses of brick with no frame. (d) A strong earthquake on a nearby fault. (e) A town built at the mouth of a valley where mudflows have run before.
Solution
Solution of Exercise 29.1.
(a) Hazard. (b) Vulnerability. (c) Vulnerability. (d) Hazard. (e) Both: the mudflows are the hazard; building the town in their path makes it vulnerable.
Exercise 29.2 ★
True or false? Correct the false sentences. (a) A natural hazard in a place where no one lives is a high risk. (b) Prevention can lower the vulnerability of a town. (c) A hazard map shows where a hazard can strike. (d) A good warning system makes a volcano less dangerous.
Solution
Solution of Exercise 29.2.
(a) False: where no one lives, nothing can be harmed, so the risk is low. (b) True. (c) True. (d) False: a warning does not change the volcano; it lowers the vulnerability of the people, who can leave in time.
Exercise 29.3 ★
For each hazard, say whether it can be forecast days or hours ahead: (a) a storm; (b) a flood after heavy rain; (c) an earthquake; (d) the arrival of a tsunami on a coast far from where it started.
Solution
Solution of Exercise 29.3.
(a) Yes, days ahead. (b) Yes, hours to days ahead. (c) No: earthquakes cannot be predicted. (d) Yes: once the tsunami has started, it takes hours to cross the ocean, and the warning travels faster.
Exercise 29.4 ★
Use the drawing of a watched volcano. What does each instrument measure, and what warning sign of an eruption does it watch for? (a) A seismometer. (b) A tiltmeter. (c) A GPS receiver. (d) A gas instrument.
Solution
Solution of Exercise 29.4.
(a) The shaking of the ground: swarms of small earthquakes as magma rises. (b) The tilt of the slope: the volcano swelling. (c) How the ground moves, by millimetres: the swelling as magma gathers. (d) The gases of the plume: more gas escaping as magma comes up.
Exercise 29.5 ★★
In 1985, the mudflows of Nevado del Ruiz reached Armero, away, about two hours after the eruption. (a) What was their average speed, in kilometres per hour? (b) A person walks at about . How far could the people have walked in two hours? (c) Why did they not leave? (d) Give two things that could have saved them.
Solution
Solution of Exercise 29.5.
(a) . (b) , far enough to reach higher ground. (c) Nobody saw the eruption, hidden by the storm, and nobody warned them: there was no quick way to send the information to the town, and no evacuation plan. (d) For example: an evacuation plan with routes to higher ground, practised in advance; a chain of warning from the scientists to the town; more instruments on the volcano.
Exercise 29.6 ★★
Use the flood-zone map of the Varden Hills. (a) Which flood covers the widest band? (b) With the grid of the map, measure the width of each zone across the valley at east. (c) A barn stands on ground above the river. Which of the three floods reach it? (d) Why is the flood above the river the one that comes most often?
Solution
Solution of Exercise 29.6.
(a) The flood above the river. (b) About for the flood, for the flood and for the flood (readings within about are fine). (c) Only the flood: the ground is higher than 2 and above the river. (d) A small rise of the river is needed to reach it, and small floods come more often than large ones.
Exercise 29.7 ★★
Place each situation on the risk grid (low or high hazard, low or high vulnerability) and say whether the risk is low, moderate or high. (a) Strong buildings and drills in a town on an active fault. (b) A camp site on the floodplain of a river that rarely floods. (c) A village of weak houses at the foot of an active volcano, with no observatory. (d) A town on a hilltop far from any fault, river or volcano.
Solution
Solution of Exercise 29.7.
(a) High hazard, low vulnerability: moderate risk. (b) Low hazard, high vulnerability: moderate risk. (c) High hazard, high vulnerability: high risk. (d) Low hazard, low vulnerability: low risk.
Exercise 29.8 ★★
Three schools are built on the same ground. School A is a frame of posts and beams with brick walls between them; school B has the same frame with diagonal braces and two shear walls; school C has the frame of B, standing on isolators. (a) Rank them from the safest to the least safe in an earthquake. (b) Explain what the braces do. (c) Explain what the isolators do.
Solution
Solution of Exercise 29.8.
(a) C, then B, then A. (b) The braces form triangles, which cannot lean without stretching or squashing a brace: the frame keeps its shape instead of leaning over. (c) The isolators give way as the ground moves back and forth beneath them, so much less of the motion reaches the school.
Exercise 29.9 ★★
A flood map shows the 100-year flood, which has a chance of 1 in 100 of being reached or passed in any year. (a) Write this chance as a percentage. (b) A neighbour says: “The 100-year flood came last year, so we are safe for 99 years.” What is wrong? (c) On average, how many such floods would come in 300 years?
Exercise 29.10 ★★
A tsunami warning station reads the sea floor pressure every . (a) How many readings does it make in one hour? (b) In one year of 365 days? Write the answer in scientific notation. (c) A tsunami crosses the deep ocean at about . How long does it take to reach a coast away? (d) Why does that time matter?
Solution
Solution of Exercise 29.10.
(a) readings. (b) readings. (c) . (d) In these three hours, the warning centres can warn the coast and people can move to higher ground.
Exercise 29.11 ★★★
A family of four prepares an emergency kit with water for 3 days, at about per person per day, for drinking and washing. (a) How many litres of water do they need? (b) How many bottles of is that? (c) Name four other things the kit holds, and say why each one is useful. (d) Why is the kit kept near the door?
Solution
Solution of Exercise 29.11.
(a) . (b) , so 31 bottles. (c) For example: food that keeps, to eat when the shops are shut; a torch, if the electricity is cut; a radio working on batteries or by hand, to hear the warnings; a first-aid kit, to treat small injuries; warm blankets. (d) So that it can be taken at once if the family has to leave quickly.
Exercise 29.12 ★★★
A town lies beside a river, at the mouth of a valley that comes down from a snow-capped volcano. Old mudflow deposits lie under its streets. The volcano has begun to shake with small earthquakes. Write a prevention plan of five points for the town. For each point, say whether it acts on the hazard side (knowing and watching the hazard) or on the vulnerability side of the risk.
Solution
Solution of Exercise 29.12.
For example: (1) draw a hazard map of the mudflows, valley by valley (hazard side); (2) install seismometers, tiltmeters, GPS receivers and gas instruments on the volcano (hazard side); (3) set up a fast chain of warning from the observatory to the town, with sirens (vulnerability side); (4) plan and signpost routes to higher ground, and practise them with drills (vulnerability side); (5) build no new homes or schools in the path of the mudflows (vulnerability side).
29.8 Problem: Where should the new school go?
Problem 29.1
Weekend problem — a new school is placed on the map of the Varden Hills, away from floods, steep slopes and the fault; the final answer is the number of houses inside the flood zone
The village of the Varden Hills needs a new school, and three sites are offered: A, B and C, on the map below. The flood zone shaded on the map is all the ground less than above the river, which a large flood would cover. The table gives, for each site, the elevation of the ground, the level of the river beside it, and how much the ground rises over measured flat across the slope.
| site | ground elevation | river level beside it | rise of the ground over |
|---|---|---|---|
| A | |||
| B | |||
| C |
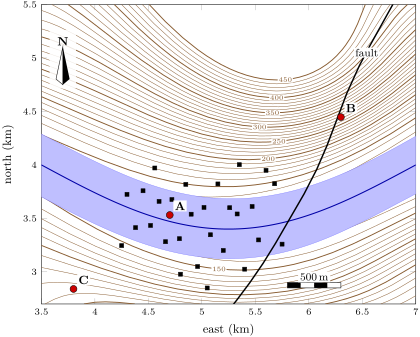
Part I — The flood zone.
- Using the river levels of the table, say which way the river flows.
- Compute the height of each site above the river beside it.
- Which of the three sites lies in the flood zone?
- Use the scale bar to measure the width of the flood zone, across the valley, at site A.
Part II — The slopes and the fault.
- A slope in percent is the rise of the ground for every measured flat. Compute the slope at each site.
- Which site would be exposed to a landslide? Explain.
- Use the scale bar to estimate the distance from each site to the fault.
- Suppose that the fault could still move. Why is the ground right on top of it a bad place for a school?
Part III — Choosing.
- Draw a table with one row per site and three columns: in the flood zone? steep slope? on the fault? Fill it with yes or no.
- Which site would you choose? Justify your choice with the table.
- The chosen site still lies in a region where the ground can shake. Name two ways of building the school, and one habit of its pupils, that lower its vulnerability.
- The school will also serve as a shelter during floods. Count the houses of the village that stand inside the flood zone. What fraction of all the houses is that?
Solution
Solution of Problem 29.1.
1. The river is at beside C, beside A and beside B; on the map C is to the west and B to the east, so the river flows east.
2. A: ; B: ; C: .
3. Only A, which is less than above the river.
4. About (between 0.5 and ).
5. The rise over is half the rise over : A ; B ; C .
6. B: its slope is very steep, and loose rock and soil can slide down a steep slope, especially after heavy rain.
7. A: about ; B: almost on the fault (less than ); C: about .
8. If the fault moves, the ground breaks and shifts along it, which can tear a building apart; and an earthquake on the fault would shake the ground there very hard.
9.
10. Site C: it is the only site with three “no”: above the river, a gentle slope of , more than from the fault.
11. For example: diagonal braces and shear walls in the frame, strong joints, or isolators under the building; the pupils practise earthquake drills (drop, cover, hold on).
12. 17 houses out of 28 stand inside the flood zone: , about 3 houses in 5.