বইগুলো এখনো বাংলা ভাষায় পাওয়া যায় না — ইংরেজি সংস্করণ দেখানো হচ্ছে।
Primary & Middle School Earth and Space Sciences · শ্রেণি 1–9
20Earthquakes
On the morning of 26 December 2004, under the sea off the north-western tip of Sumatra, in Indonesia, the rocks broke along a fault: it was one of the largest earthquakes ever measured. On the nearby coast of Sumatra, the sea rose in waves up to high, which swept as far as inland. Over the next hours the waves crossed the Indian Ocean and struck the coasts of fifteen countries, as far away as Africa. About 230 000 people died. There was, at the time, no warning system in the Indian Ocean.
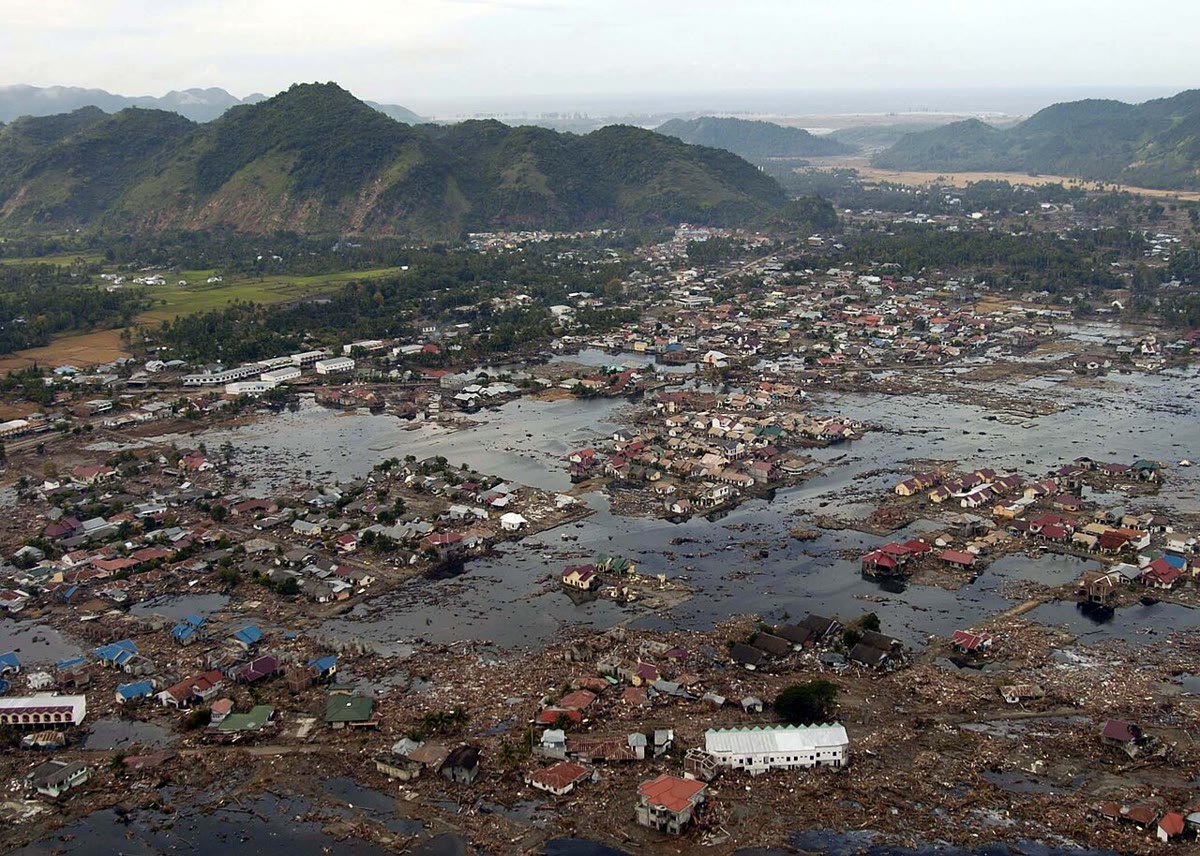
How do rocks break? How do scientists find, within minutes, where an earthquake struck and how large it was? And why did the sea, hours later, rise on coasts where nobody had felt anything?
You already know
An earthquake is a sudden shaking of the ground, caused by rocks that break and slip, deep underground (Chapter 8). The outer shell of the Earth is made of plates, and 92 % of the large earthquakes happen less than from a plate boundary (Chapter 18). When an earthquake strikes, waves travel through the rocks of the whole Earth: a faster kind (the P waves) and a slower kind (the S waves); by timing them, scientists discovered the core (Chapter 16).
20.1 Rocks that break
The plates move a few centimetres a year, but their edges are rough: they stick together while the rest of the plates keeps moving. The rocks near the edge bend a little, like a ruler you push at both ends, and store up energy. When the push finally overcomes the friction, the rocks unstick all at once and slip: that sudden slip is the earthquake.
Definition 20.1 (Fault)
A fault is a break in the rocks along which the two blocks on either side have moved with respect to each other. During an earthquake the blocks slip suddenly along the fault; the larger the fault and the slip, the larger the earthquake.
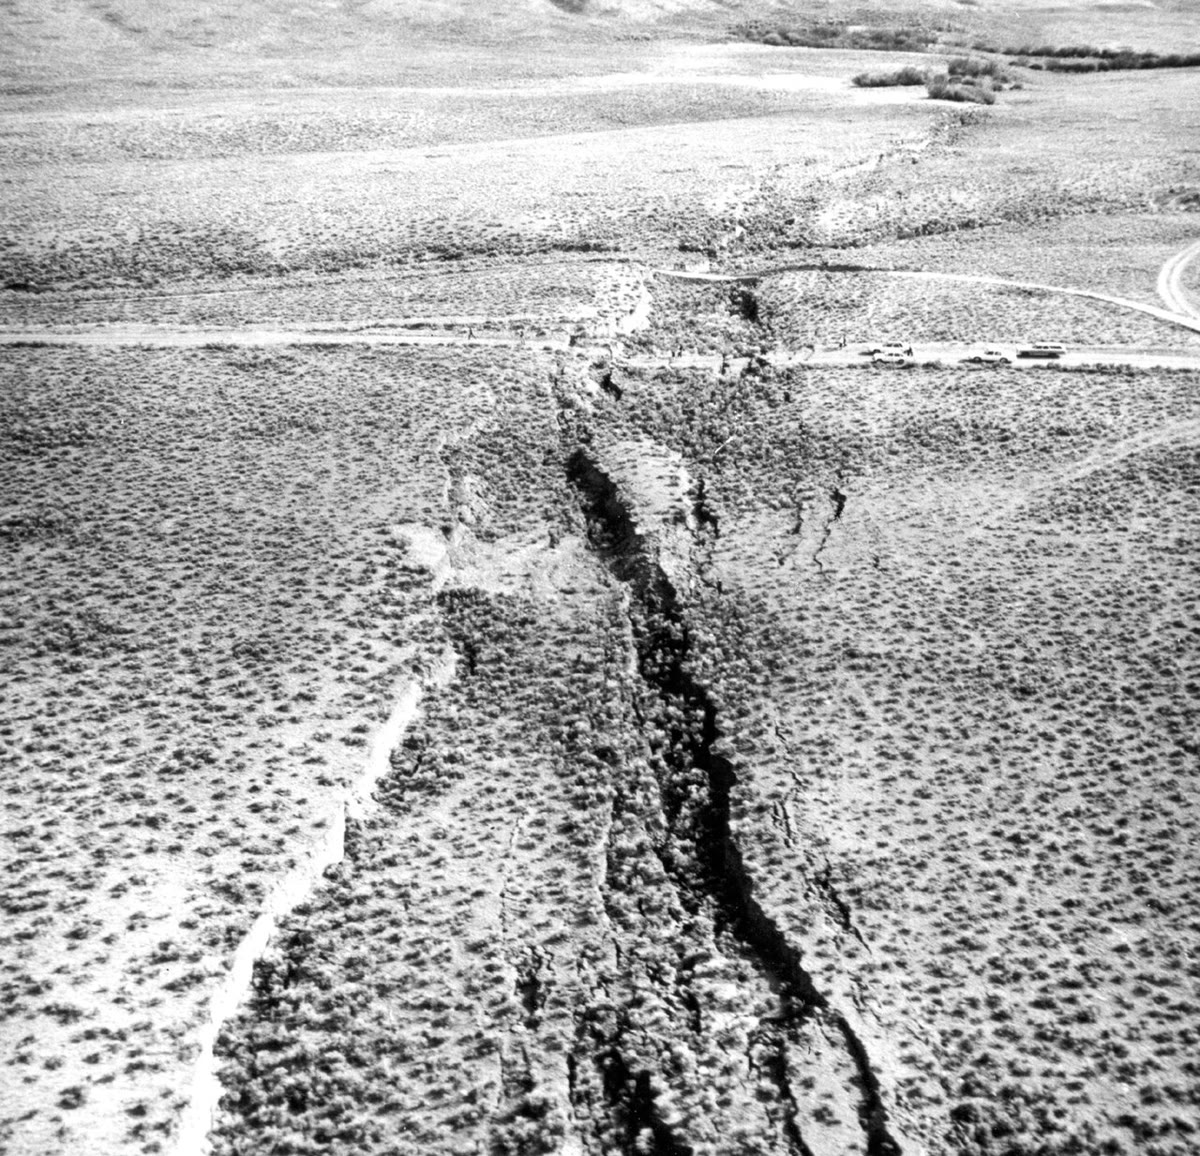
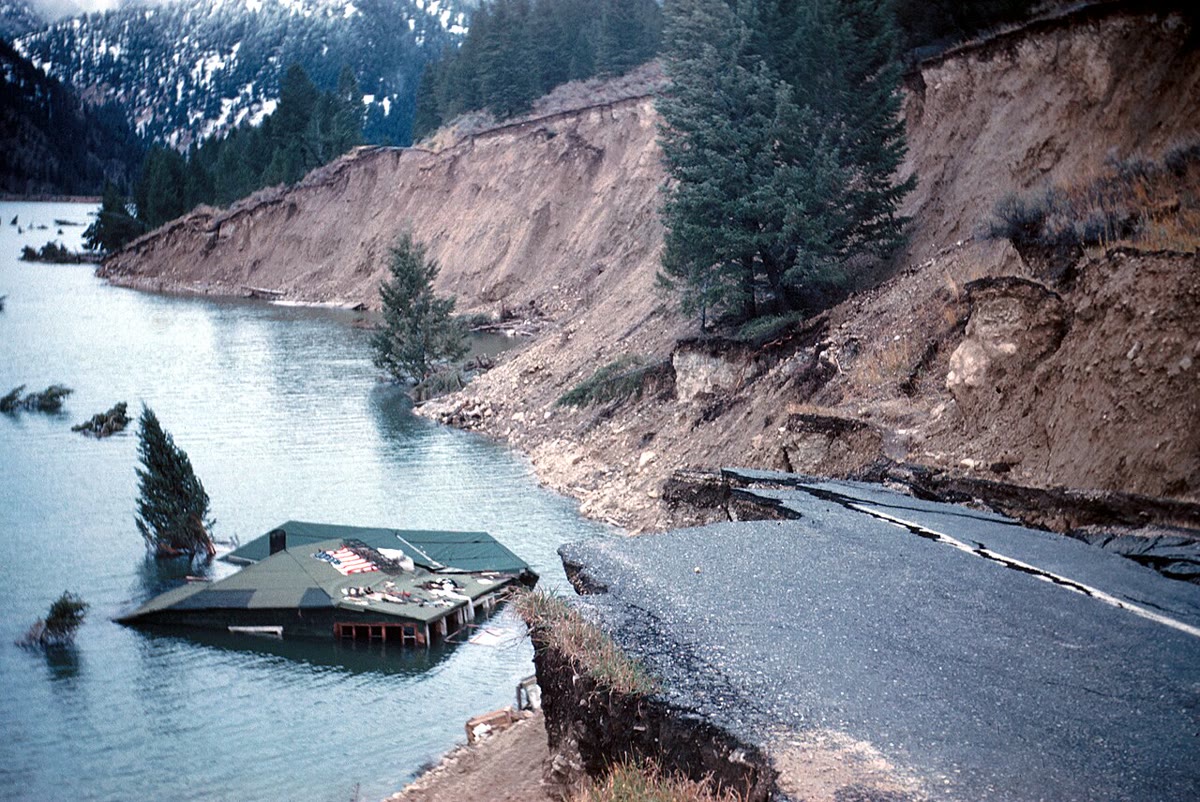
A plate boundary is made of many faults, and most of the world’s earthquakes happen on them. But faults also exist inside the plates, and some of them can break too. When a large fault breaks near the surface, the slip can be seen on the ground: a step in a field, a road cut in two, a fence or a row of trees shifted sideways.
Definition 20.2 (Focus and epicentre)
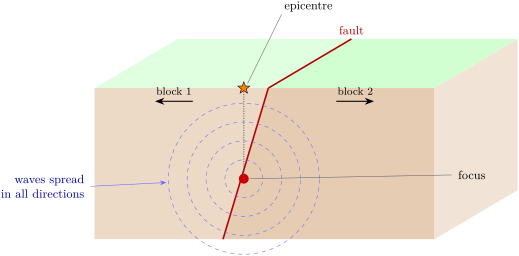
The focus of an earthquake is the place underground, on the fault, where the slip starts. The epicentre is the point on the Earth’s surface directly above the focus.
The focus is often a few kilometres to a few tens of kilometres deep. Of the 7 031 earthquakes of magnitude 6 or more recorded between 1976 and 2025, 5 561 — 79 % — had their focus less than down. But 483 started more than down, and the deepest down: these deep earthquakes happen where one plate sinks under another, inside the sinking plate.
A large earthquake rarely comes alone. It is often followed by smaller ones in the same place, the aftershocks, for weeks, months and even years. Sometimes smaller earthquakes come before it, but nobody can tell they were warnings until the large one has happened: scientists cannot predict earthquakes. They can only say which faults will break again one day, and help people prepare.
20.2 Recording an earthquake
Definition 20.3 (Seismometer and seismogram)
A seismometer is an instrument that records the shaking of the ground. Its record, a wiggly line drawn against time, is a seismogram.
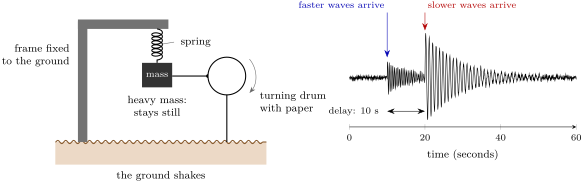
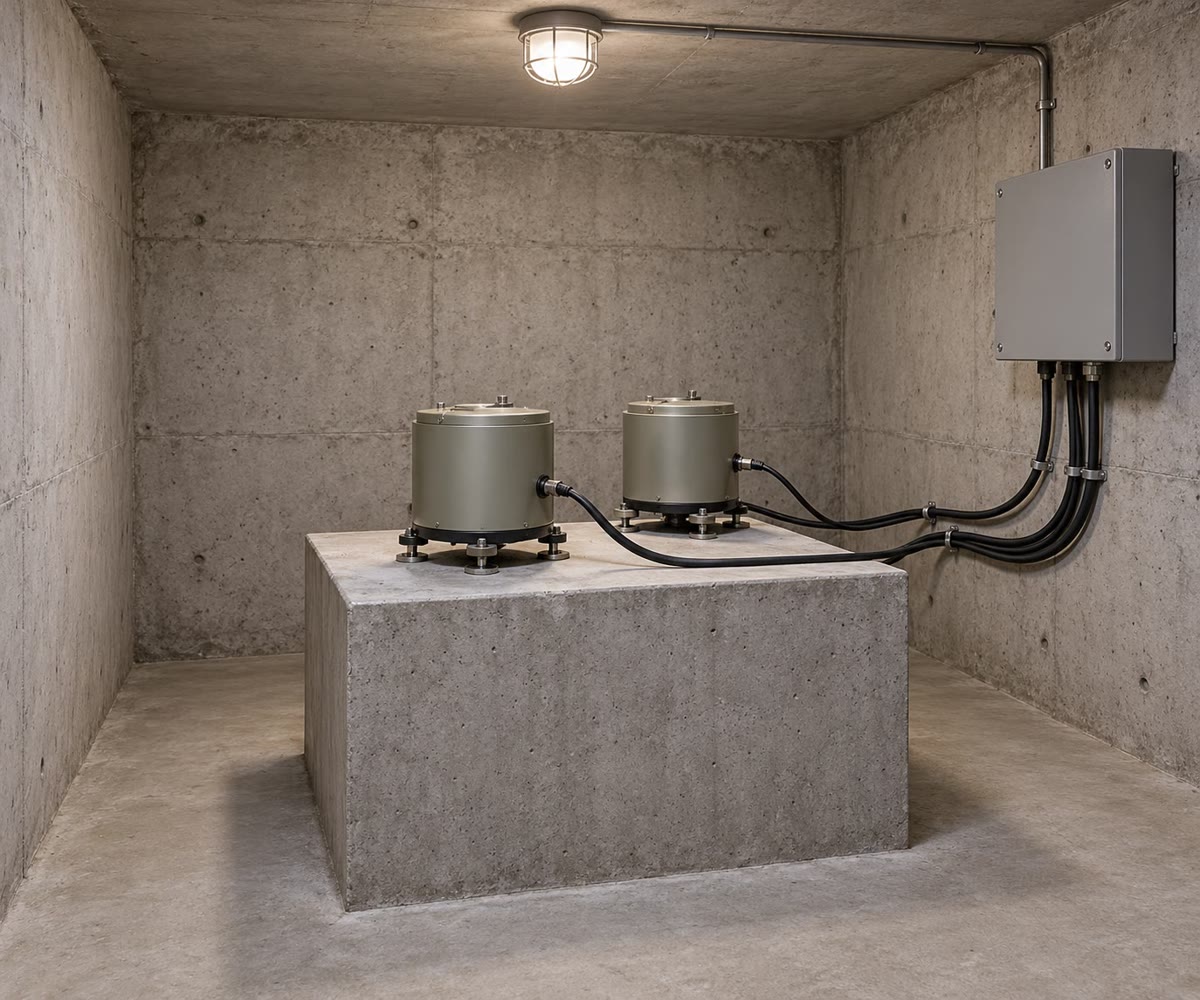
The idea of a seismometer is simple. A frame is fixed firmly to the ground; a heavy weight hangs from it on a spring. When the ground shakes, the frame shakes with it, but the heavy weight, held only by its spring, stays almost still. The instrument records the movement of the frame with respect to the still weight: that is the movement of the ground. In the drawing below, a pen fixed to the mass draws it on paper wrapped around a turning drum.
How far away was the earthquake?
A seismogram tells more than “the ground shook”. The faster waves always arrive first and the slower ones after. Close to the focus, they arrive almost together; far away, the slower waves fall more and more behind, just as during a storm the thunder lags farther behind the lightning when the storm is far away. So the delay between the two arrivals tells the distance to the earthquake.
How many kilometres for each second of delay? It depends on the speeds of the two waves in the rocks they cross. With the speeds of the reference model of the Earth (Chapter 16), each second of delay means about in the upper crust and in the lower crust. In the exercises of this chapter we use the round value of for each second.
Method 20.4 (Finding the epicentre with three stations)
- On the seismogram of each station, read the delay between the arrival of the faster waves and the arrival of the slower ones.
- Turn each delay into a distance (here: the delay in seconds, in kilometres).
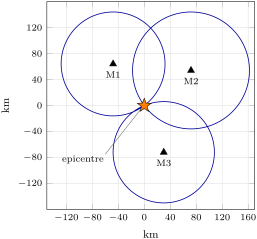
- On a map, draw around each station a circle whose radius is its distance. The epicentre lies somewhere on each circle.
- With two circles, there are usually two possible points; the third circle passes through only one of them: that is the epicentre.
Example 20.5 (Three circles)
Three stations record the same earthquake. The delays are at station M1, at M2 and at M3. The distances are , and . The three circles, drawn below, meet at a single point: the epicentre.
20.3 How large? Magnitude and intensity
Two different numbers describe an earthquake, and they are often confused.
Definition 20.6 (Magnitude)
The magnitude of an earthquake measures its size: the energy released at the source. It is worked out from the seismograms. Each earthquake has a single magnitude, written with one decimal, such as 6.3 or 9.1.
Definition 20.7 (Intensity)
The intensity of an earthquake at a place describes how strongly the ground shook there, from what people felt and from the damage they saw. It is written in Roman numerals, from I (not felt) to XII (total destruction). One earthquake has many intensities: a different one in each place.
The magnitude scale climbs fast. Each step of 1 in magnitude means waves about 10 times larger on the seismogram and about 32 times more energy released. An earthquake of magnitude 8 releases about times more energy than one of magnitude 6.
Method 20.8 (Comparing two magnitudes)
To compare the energy of two earthquakes, count the whole steps between their magnitudes, and multiply by 32 once for each step: 1 step, 32 times; 2 steps, about 1000 times; 3 steps, about 32 000 times.
Example 20.9 (Magnitude 9 and magnitude 7)
The 2004 earthquake off Sumatra had a magnitude of 9.1. An earthquake of magnitude 7.1 is two steps smaller: it released about , so about 1000 times, less energy.
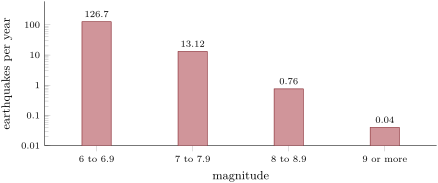
The largest earthquakes ever measured all happened where one plate sinks under another: magnitude 9.5 in Chile on 22 May 1960, 9.2 in Alaska in 1964, 9.1 off Sumatra in 2004 and 9.1 off the coast of Japan on 11 March 2011. Large earthquakes are rare, and the larger they are, the rarer, as the chart shows: each step up in magnitude, about ten times fewer.
The intensity scale has no formula: it is a list of what happens. The table gives it in short form.
| intensity | what is felt and seen |
|---|---|
| I | not felt, except by a very few people |
| II | felt only by a few people at rest, especially upstairs; hanging objects may swing |
| III | felt indoors; it feels like a passing truck |
| IV | felt indoors by many; dishes, windows and doors rattle |
| V | felt by nearly everyone, many woken up; some dishes and windows broken |
| VI | felt by all, many frightened; some heavy furniture moved; slight damage |
| VII | little damage in well-built buildings, much in poorly built ones; some chimneys broken |
| VIII | much damage in ordinary buildings, some partly collapse; chimneys and walls fall |
| IX | great damage even in strong buildings; buildings shifted off their foundations |
| X | most buildings destroyed with their foundations; rails bent |
| XI | few buildings left standing; bridges destroyed |
| XII | damage total; objects thrown into the air |
The intensity is highest, usually, near the epicentre, and decreases with distance. But it also depends on the ground: solid rock shakes the least, soft mud the most. A town built on soft ground can be shaken harder than another town closer to the epicentre but built on rock.
20.4 Tsunamis
Definition 20.10 (Tsunami)
A tsunami is a series of sea waves set off by a sudden movement of the sea floor — usually an earthquake under the sea, sometimes an eruption — which can cross whole oceans and flood the coasts.
When a fault under the sea breaks, the sea floor moves suddenly up or down, and lifts or lowers the whole column of water above it. The water spreads out in waves. Out in the deep ocean, a tsunami is surprising: it is rarely more than a metre high, and ships do not even notice it pass beneath them. But it is fast: over , as fast as a jet plane. As it reaches shallow water near the coast, it slows down to 30 or — still faster than anyone can run — and grows taller. Most tsunamis are less than high at the coast; the largest pass . The first wave is not always the largest, and the waves can keep coming for hours.
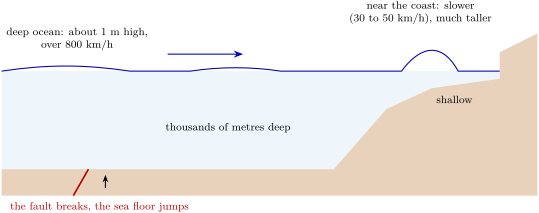
Example 20.11 (From Sumatra to Sri Lanka)
Colombo, the largest city of Sri Lanka, is about from the epicentre of the 2004 earthquake. At , a tsunami covers this distance in hours, that is about 2 hours and 17 minutes. Nobody in Sri Lanka felt the earthquake: the wave came without any warning but the sea itself.
Remark 20.12 (The warning the sea gives)
On a coast, three signs can announce a tsunami: a strong or long earthquake; the sea behaving strangely — a sudden flood, or the water drawing back far from the shore, showing the sea floor like a very low tide; or a loud roar coming from the ocean. During the shaking, protect yourself as you learned (drop, cover, hold on). Then do not wait for an official warning: go as high, or as far inland, as you can, at once. A tsunami from a nearby earthquake can arrive within minutes.
20.5 Exercises
Exercise 20.1 ★
Match each word with its meaning: fault; focus; epicentre; seismometer; magnitude; intensity. (a) The place underground where the slip starts. (b) How strongly the ground shook at one place. (c) A break in the rocks along which the two sides have moved. (d) The point on the surface above the focus. (e) The size of an earthquake, one number for each earthquake. (f) An instrument that records the shaking of the ground.
Exercise 20.2 ★
The focus of an earthquake lies straight below a village. (a) Where is the epicentre? (b) How far is the village from the focus? (c) A second village is from the epicentre. Will its intensity usually be higher or lower than in the first village? Why?
Exercise 20.3 ★
Magnitude or intensity? (a) “The earthquake measured 6.8.” (b) “In our street, all the dishes fell and a chimney broke.” (c) “It was VI in the town and IV in the villages of the hills.” (d) “It released 32 times more energy than last year’s.”
Exercise 20.4 ★
True or false? Correct the false ones. (a) Scientists can tell a week in advance when an earthquake will strike. (b) In the open ocean, a tsunami is a huge wall of water. (c) One earthquake has a single magnitude but many intensities. (d) Most large earthquakes happen near plate boundaries.
Solution
Solution of Exercise 20.4.
(a) False: scientists cannot predict earthquakes; they only know which faults will break again one day. (b) False: in the open ocean a tsunami is rarely more than a metre high; it grows near the coast. (c) True. (d) True: 92 % of the earthquakes of magnitude 6 or more happen less than from a plate boundary.
Exercise 20.5 ★★
Use the chart of earthquakes per year. (a) About how many earthquakes of magnitude 6 to 6.9 happen in a year? Of magnitude 7 to 7.9? (b) How many times fewer are the second than the first? (c) Add the three bars from 7 upwards: about how many earthquakes of magnitude 7 or more happen in a year? (d) The chart says 0.04 a year for magnitude 9 or more. How many is that in 50 years?
Exercise 20.6 ★★
Use the method for comparing magnitudes. (a) How many times more energy does an earthquake of magnitude 7 release than one of magnitude 6? (b) And one of magnitude 8 than one of magnitude 6? (c) How many times larger are its waves on the seismogram, for the same distance, between magnitude 6 and 8?
Solution
Solution of Exercise 20.6.
(a) One step: 32 times. (b) Two steps: , about 1000 times. (c) Each step makes the waves 10 times larger: times larger.
Exercise 20.7 ★★
Use for each second of delay between the faster and the slower waves. (a) A station records a delay of . How far away was the earthquake? (b) Another records . (c) An earthquake struck from a station: what delay will the station read? (d) Why can one station alone not tell where the epicentre is?
Solution
Solution of Exercise 20.7.
(a) . (b) . (c) . (d) One station gives only a distance, not a direction: all the points at that distance form a circle around the station, and the epicentre could be anywhere on it.
Exercise 20.8 ★★
Use the intensity table. Give the intensity for each report. (a) “Felt by nearly everyone; we were woken up and two glasses broke.” (b) “Only my grandmother, resting upstairs, felt it; the lamp swung.” (c) “Walls and chimneys fell; several houses partly collapsed.” (d) The same earthquake gave reports (a) and (c). Explain how this is possible.
Solution
Solution of Exercise 20.8.
(a) V. (b) II. (c) VIII. (d) The intensity changes from place to place: report (c) comes from a place close to the epicentre, or built on soft ground; report (a) from a place farther away, or on solid rock. The earthquake still has only one magnitude.
Exercise 20.9 ★★
Of the 7 031 earthquakes of magnitude 6 or more of 1976–2025, 5 561 had their focus less than deep. (a) How many had a deeper focus? (b) What percentage is that? Round to the nearest whole number. (c) The deep ones happen where one plate sinks under another. Explain why they can start so deep there.
Solution
Solution of Exercise 20.9.
(a) . (b) : about 21 %. (c) The sinking plate goes down deep into the mantle. It is still rigid enough to break, so earthquakes can start inside it, hundreds of kilometres down.
Exercise 20.10 ★★
Malé, the capital of the Maldives, is about from the epicentre of the 2004 earthquake. (a) At , how long did the tsunami take to reach it? Give hours and minutes. (b) How much later did it arrive than at Colombo (2 hours 17 minutes)? (c) With such delays, why could a warning system have saved many lives?
Solution
Solution of Exercise 20.10.
(a) hours: 3 hours and minutes, about 3 hours 8 minutes. (b) 3 h 8 min 2 h 17 min 51 minutes later. (c) The wave took hours to arrive, while a large earthquake under the sea is located within minutes: a warning could have sent people to high ground long before the wave came.
Exercise 20.11 ★★★
A tsunami crosses of deep ocean at , then the last of shallow water at . (a) How many minutes does it take for the deep part? (b) For the shallow part? (c) How long is the whole journey? (d) What is surprising in your answers? (e) Why does the wave grow taller as it slows down?
Solution
Solution of Exercise 20.11.
(a) hour: 30 minutes. (b) hour: 30 minutes. (c) 60 minutes. (d) The last take as long as the first : the wave slows down enormously in shallow water. (e) The front of the wave slows down while the water behind it still comes fast: the water piles up, and the wave grows taller.
Exercise 20.12 ★★★
(a) How many times more energy does an earthquake of magnitude 9 release than one of magnitude 6? (b) Each year there are about 127 earthquakes of magnitude 6 to 6.9. Suppose each of them releases the energy of a magnitude 6. How many years of them does it take to release the energy of one magnitude 9 earthquake? (c) What does this tell you about the share of the energy carried by the very largest earthquakes?
Solution
Solution of Exercise 20.12.
(a) Three steps: , about 33 000 times. (b) : about 260 years of all the magnitude-6 earthquakes of the world. (c) Almost all the energy is released by the few very largest earthquakes: a single magnitude 9 outweighs centuries of magnitude-6 earthquakes.
20.6 Problem: Where did the ground shake?
Problem 20.1
Weekend problem — three stations record an earthquake under the sea, the epicentre is found on the map, and the town of Port Hale is warned before the tsunami arrives
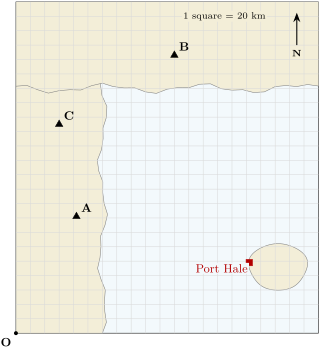
An earthquake strikes under the sea of an invented coast. Three seismometer stations, A, B and C, stand on land; the town of Port Hale stands on an island (map below; one square is ). In this region, each second of delay between the faster and the slower waves means . The stations record:
| station | faster waves arrive | slower waves arrive |
|---|---|---|
| A | 10:15:25 | 10:15:45 |
| B | 10:15:16 | 10:15:29 |
| C | 10:15:19 | 10:15:34 |
Part I — Three stations.
- For each station, find the delay between the two arrivals, in seconds.
- Which station is closest to the earthquake? How can you tell without any calculation?
- Find the distance from each station to the earthquake.
- Station A’s distance alone does not say where the earthquake was. Describe all the places that are at this distance from A.
Part II — Finding the epicentre.
- One square is . How many squares is the radius of each circle?
- Place the corner O at the bottom left of the map. Station C is 3 squares east and 14.5 squares north of O; going 6 squares () due east of C, you reach a point E. Check on the map that E is also on the circles of A and B: it is the epicentre. How many squares east and north of O is it?
- Is the epicentre on land or under the sea? Why does that matter?
- The magnitude was 7.4. How many times more energy than a magnitude 6.4 earthquake did it release?
Part III — The wave reaches the coast.
- On the map, Port Hale is 12 squares from the epicentre. How many kilometres is that?
- At , how many minutes does the tsunami take to reach Port Hale?
- Locating the earthquake and sending the warning takes 5 minutes after the shaking starts. At what time after the earthquake does the warning reach Port Hale?
- How many minutes do the people of Port Hale have to reach high ground before the tsunami arrives?
Solution
Solution of Problem 20.1.
1. A: s. B: s. C: s.
2. Station B: its delay is the shortest, and the shorter the delay, the closer the earthquake. (Its faster waves also arrived first.)
3. A: . B: . C: .
4. All the points from A: a circle of radius centred on A. The epicentre is somewhere on it.
5. A: squares. B: squares. C: squares.
6. E is squares east and 14.5 squares north of O, out at sea between the three stations; the circles of A and B pass through it.
7. Under the sea. A sudden movement of the sea floor can set off a tsunami: the coasts and the island have to be warned.
8. One step of magnitude: about 32 times more energy.
9. .
10. hour, and minutes.
11. 5 minutes after the earthquake.
12. : the people of Port Hale have about 13 minutes to reach high ground. (The wave slows down in the shallow water near the island, which gives a little more time, but nobody should count on it: they leave at once.)