书籍暂未推出简体中文版——当前显示英文版。
University Earth and Space Sciences — Year 3 · 本科三年级
30Where the Elements Come From
The calcium of a limestone cliff was made, for the most part, inside massive stars that exploded before the Sun was born. The iron of the Earth’s core comes mostly from a different kind of explosion, that of a white dwarf. The platinum of a ring belongs to a peak of abundance built by bursts of neutron captures lasting seconds, in mergers of two neutron stars or in a rare kind of supernova; which of the two made most of it is still debated. Each of these events has left its mark in the composition of the Sun, which is also, apart from the few elements that the planets could not keep, the composition of the Solar System. This chapter reads that record: it sets out the solar abundances, recalls how the light elements were made, follows the neutron captures that built the heavy ones, finds the sites where each process runs, and models how the composition of a galaxy changes as its stars live and die. It ends where the geology of the earlier volumes begins: why the Earth, made of the same material as the Sun, is so rich in iron and so poor in volatiles.
You already know
Big Bang nucleosynthesis, the fusion of hydrogen and helium in stars, the binding energy per nucleon and its maximum near iron, the valley of stability, beta decay and half-lives, the cross-section of a reaction, main-sequence stars, red giants, white dwarfs, neutron stars and supernovae are in the physics books. The meteorite classes, the CI chondrites, the condensation temperature, refractory and volatile elements, the Goldschmidt classes and the bulk silicate Earth are in the Year 2 volume, in its chapters on the formation of the planets and on the elements in the Earth. The structure of the Galaxy, its thin and thick discs, its halo and its stellar populations are in the previous chapter.
30.1 The solar abundances
The Sun holds more than of the mass of the Solar System, and its outer layers have kept, apart from a few light elements and a slow settling of heavy ones, the composition of the gas from which the Sun and the planets formed. Its composition is read in two ways: from the absorption lines of its photosphere, and from the CI chondrites, the meteorites whose composition, except for the most volatile elements, is the closest of all known materials to the Sun’s.
Definition 30.1 (Solar abundance; dex)
The solar abundance of an element is the number of its atoms relative to those of hydrogen in the Sun, written on a logarithmic scale on which hydrogen is set at :
A difference of one unit in such a logarithm is called a dex: two abundances that differ by dex differ by a factor . For a star, the abundance relative to the Sun is written with brackets, , and likewise for any two elements.
The figure below shows the solar abundances of the recent compilation that reassessed all 83 long-lived elements. Iron, at , has one atom for every atoms of hydrogen; helium has atoms per hydrogen atom. Several features stand out, and the rest of the chapter explains them.
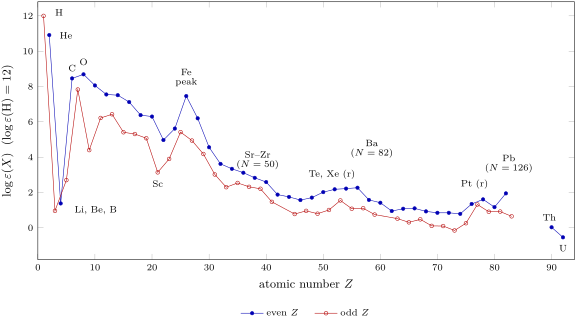
- Hydrogen and helium make almost all the atoms, a thousand times more than all the others together; both were made in the Big Bang, and some of the helium since then in stars.
- Lithium, beryllium and boron, just after helium, lie far below carbon: beryllium is twelve million times less abundant.
- The abundances fall steeply from oxygen to the heavy elements, with peaks around oxygen, around iron, around barium and around lead, and smaller ones that the figure labels.
- Elements of even atomic number are more abundant than their odd neighbours: scandium, between calcium and titanium, is about times rarer than calcium and times rarer than titanium. This is the odd–even effect.
- Beyond the iron peak the curve flattens: from iron to gold the abundance drops by a factor of , but from gold to lead it rises again, by a factor of eleven.
By mass, the present photosphere is hydrogen, helium and of everything else. Corrected for the heavy elements that have settled below the photosphere since the Sun formed, the proto-solar values, those of the gas the Sun was born from, are , and .
Definition 30.2 (Metallicity)
The metallicity of a star or of a gas is its content of elements heavier than helium, called metals in astronomy whatever their chemistry: as a mass fraction , or, as it is usually measured, as the iron abundance relative to the Sun, . A star with has a tenth of the Sun’s iron per hydrogen atom.
The two sources of the solar abundances agree remarkably well. The figure below compares them element by element. For 58 elements, those neither too volatile for the meteorites nor destroyed in the Sun, the weighted mean difference between the photospheric and the CI abundance is dex. Two groups fall off the line. The meteorites hold far less hydrogen, helium, carbon, nitrogen, oxygen and noble gases than the Sun: these elements stayed in the gas when the solids condensed. The Sun holds times less lithium than the meteorites: it has destroyed of its lithium by nuclear burning.
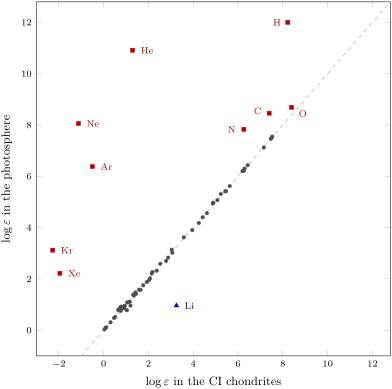
The agreement is a fact of great weight for geology. It means that the meteorites, which can be analysed in the laboratory, give the composition of the Solar System for all but the most volatile elements; and that the Sun, whose photosphere gives hydrogen, carbon, nitrogen and oxygen, fills in the rest. The Year 2 volume built the composition of the bulk Earth on that foundation.
30.2 The light elements and the stars
The physics books describe Big Bang nucleosynthesis: in the first three minutes, as the Universe cooled, protons and neutrons combined into deuterium, helium-3, helium-4 and a trace of lithium-7, and into nothing heavier. The observed primordial abundances are a helium mass fraction , a deuterium-to-hydrogen ratio of and a lithium-to-hydrogen ratio of , the last measured in old metal-poor stars of the Galactic halo. All the other elements, and the excess of helium in the Sun, , were made in stars.
The stars of the physics books burn hydrogen into helium on the main sequence, then helium into carbon and oxygen as red giants; the most massive go on, in shells around their cores, to neon, magnesium, silicon and finally iron. Fusion stops there, because the binding energy per nucleon is greatest near iron: building heavier nuclei by fusion absorbs energy instead of releasing it. Beyond the iron peak, the elements are built by another route, the capture of neutrons, the subject of the next section. Lithium, beryllium and boron are fragile: they are destroyed at the temperatures of stellar interiors, which is why the Sun has burnt nearly all its lithium, and why the three elements form a trough in the abundance curve.
Definition 30.3 (Alpha element)
An alpha element is one of the even- elements oxygen, neon, magnesium, silicon, sulfur and calcium, whose most abundant isotopes (, , , , , ) have mass numbers that are multiples of four, and which are made mainly in massive stars and returned to the gas by their explosion as core-collapse supernovae.
The peaks of oxygen and of the alpha elements, and the odd–even effect, are the marks of these burning stages: helium nuclei are built into the even nuclei more readily than anything into the odd ones, and nuclei with even numbers of protons are more tightly bound. What a star returns to the gas depends on its mass.
Definition 30.4 (Stellar yield)
The stellar yield of an element from a star of given initial mass is the mass of that element which the star has newly made and returns to the interstellar gas, in winds and in its final explosion, as a fraction of the star’s mass.
Stars of less than live longer than the age of the Universe and return nothing. Stars of to return helium, nitrogen, carbon and the heavy elements of the s process (barium, yttrium, strontium) in their winds, and end as carbon–oxygen white dwarfs. Stars of more than to make mainly the alpha elements and some iron, and explode as core-collapse supernovae. A white dwarf in a close binary can explode as a Type Ia supernova, and such explosions make the bulk of the iron.
30.3 Neutron captures
A neutron has no electric charge and is not repelled by a nucleus: even a slow neutron enters it, and the nucleus, one mass unit heavier, sheds the binding energy as a gamma ray. Repeated captures make heavier isotopes of the same element until one is unstable; it then decays, usually by beta-minus decay, into the next element, which captures in turn. Which nuclei are made depends on one comparison: the time between two captures against the half-life of the unstable nuclei met on the way.
Definition 30.5 (Neutron capture; s process; r process)
Neutron capture is the absorption of a free neutron by a nucleus, . In the s process (slow), the captures are slower than most beta decays: the time between two captures on one nucleus is hundreds to thousands of years, so an unstable nucleus nearly always decays before it can capture, and the chain of captures and decays follows the valley of stability. In the r process (rapid), the neutron density is so high that captures are far faster than the decays: the nuclei are driven to very neutron-rich isotopes, far from stability, in a few seconds, and decay back to stability once the neutrons run out.
The two processes reach different nuclei, and the chart of the nuclides shows which. The figure below draws a strip of it, from cadmium to barium. The s process climbs it along the valley of stability: along a row of an element while the isotopes are stable, then up one row by a beta decay. The r process comes from the neutron-rich side, bottom right: each very neutron-rich nucleus decays by successive beta-minus decays along its isobar, keeping its mass number, and stops at the first stable nucleus it meets. A stable nucleus that has a stable isobar of lower is shielded from the r process: lies behind , behind , behind . Those three can only be made by the s process: they are s-only. Conversely, and lie beyond the s path, which leaves tellurium at , whose half-life is : they are r-only.
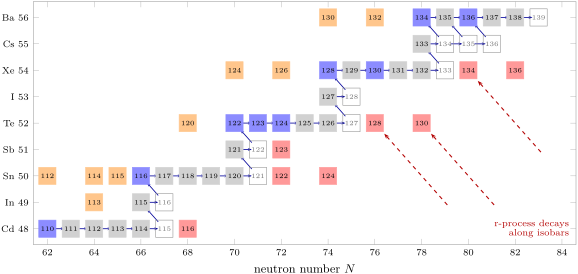
A third group, the orange squares, is reached by neither process: the proton-rich isotopes such as , or .
Definition 30.6 (p nuclei)
The p nuclei are the stable isotopes on the proton-rich side of the valley of stability, beyond the iron peak, that neither the s nor the r process can make: they are shielded from the r process by a stable isobar of lower and lie off the s path. They are ascribed to a separate p process, probably in supernova explosions, and with few exceptions their abundances are much smaller than those of the neighbouring s and r isotopes.
The rule that reads the chart, applied to all 287 nuclides of the proto-solar table beyond zinc, finds 30 s-only nuclei, 29 r-only nuclei and 36 p nuclei. One of these p nuclei, , is in fact reached by the s process through a long-lived excited state of that the simple rule ignores; the other 35 are the p nuclei of the literature.
The s process can be followed quantitatively, because its nuclei are near stability and their capture cross-sections can be measured. In a stellar plasma at temperature the neutrons are thermalised, and what matters is the cross-section averaged over their Maxwell–Boltzmann distribution, , quoted for a thermal energy .
Proposition 30.7 (The relation)
On a stretch of the s path where every nucleus is stable and the neutron density and temperature are constant, let be the abundance of the nucleus of mass number and its averaged cross-section. If the neutron flow has reached a steady state, then
so that the product is the same for every nucleus of the stretch.
Proof. A nucleus of mass captures neutrons at the rate per nucleus, with the mean thermal speed of the neutrons. It is made by captures on and destroyed by captures on itself, so . In a steady state the derivative vanishes, which is the relation. A nucleus with a large cross-section is quickly passed on and stays rare; one with a small cross-section piles up. ∎
The three s-only isotopes of tellurium test it. Their proto-solar abundances are , and atoms per million silicon atoms, and their cross-sections , and : the products are , and , equal within three per cent, although the abundances differ by a factor of five. Across a neutron magic number the relation breaks: nuclei with , or are so tightly bound that they capture poorly, for against for , and they act as bottlenecks. The figure below shows the product for all the s-only nuclei: flat plateaus separated by steps near , and .
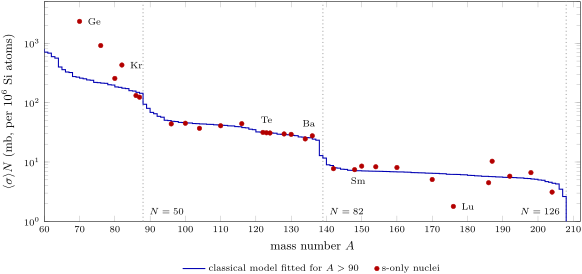
The line of the figure is the classical model of the s process: a small fraction of the iron-56 is exposed to neutrons, with exposures spread exponentially about a mean , and the flow is followed nucleus by nucleus with the measured cross-sections. Its fit to 22 s-only nuclei heavier than (leaving out , which decays, and , fed by the decay of ) gives and of the solar iron-56, close to the of the detailed analyses, in which each seed nucleus captures on average about fifteen neutrons. The lightest s-only nuclei, germanium-70 and selenium-76, lie far above the line: they need a second, weak component, made in massive stars.
Where an unstable nucleus on the path lives about as long as the time between two captures, the flow splits: part of it decays, part captures. Such branchings occur at , , , and , among others. A branching lets part of the flow bypass a nucleus: of the two s-only isotopes of samarium, receives the whole flow and only the part that went round the branching at mass 147, and the ratio of their , , measures that share. Since the share depends on the neutron density and the temperature, the branchings are thermometers and densimeters of the stars where the s process ran.
In the lab — Measuring a capture cross-section
To measure the averaged cross-sections that the s process needs, physicists reproduce a stellar neutron spectrum at an accelerator. Protons striking a lithium target make neutrons by the reaction , whose spectrum mimics a thermal one at , close to the of the helium-shell flashes of a red giant. The sample sits right against the target, in the strongest flux, and after the irradiation the gamma rays of the newly made radioactive nuclei are counted: this activation method works with samples of less than a microgram. Where the product is stable, the neutrons are sent in pulses and timed over a flight path to give their energy, and a sphere of barium fluoride crystals around the sample records the gamma-ray cascade of each capture.
History — Technetium in red giants
In 1952 P. W. Merrill found the lines of technetium in the spectra of red giants of spectral type S. Technetium has no stable isotope; the one made by the s process, , has a half-life of years, far shorter than the lives these stars had lived. The technetium had to have been made inside the stars, and recently. It was the first direct evidence that stars make elements. In 1957 E. M. and G. R. Burbidge, W. A. Fowler and F. Hoyle, and independently A. G. W. Cameron, formulated the classical model of the s process.
The r process leaves its own peaks. Its path runs close to the neutron drip line, the limit beyond which a nucleus cannot hold another neutron, and the flow waits at the nuclei with closed neutron shells, , and , until they beta-decay. These waiting points pile up material; after the final decays to stability the piles lie at mass numbers a few units lower than the s-process peaks of the same magic numbers, which are made of stable nuclei: near (tellurium and xenon) and (platinum), against and for the s peaks of barium and lead. The abundance curve shows both sets of peaks side by side. The r process makes about half the heavy elements, the s process the other half.
30.4 Where the processes run
The main s process runs in red giants of up to about three solar masses, near the end of their lives, as asymptotic-giant-branch stars. Between flashes of helium burning in a shell around their cores, a thin layer rich in carbon-13 forms; at about the reaction releases neutrons for some ten thousand years, at densities of to neutrons . During the flashes themselves, above , gives a burst of a few years at up to . The products are dredged up to the surface, where technetium is seen, and blown away in the star’s wind. The weak s process, which makes the s-only nuclei lighter than , runs in massive stars during their helium and carbon burning.
Core-collapse supernovae, the end of stars above eight to ten solar masses, return the alpha elements and part of the iron soon after the stars’ birth, because massive stars live short lives. Type Ia supernovae, white dwarfs that explode in binaries, return most of the iron, but only after a delay: the white dwarf must form first, from a star of less than eight solar masses, and then either gather matter from a companion until it reaches the Chandrasekhar mass, about , or merge with a second white dwarf. The r process needs a far more extreme place.
Definition 30.8 (Neutron-star merger; kilonova)
A neutron-star merger is the coalescence of two neutron stars in a close binary, whose orbit has shrunk by the emission of gravitational waves. Part of the neutron-rich matter is flung out. A kilonova is the transient glow of that ejecta, heated by the radioactive decay of the freshly made r-process nuclei, which lasts for days.
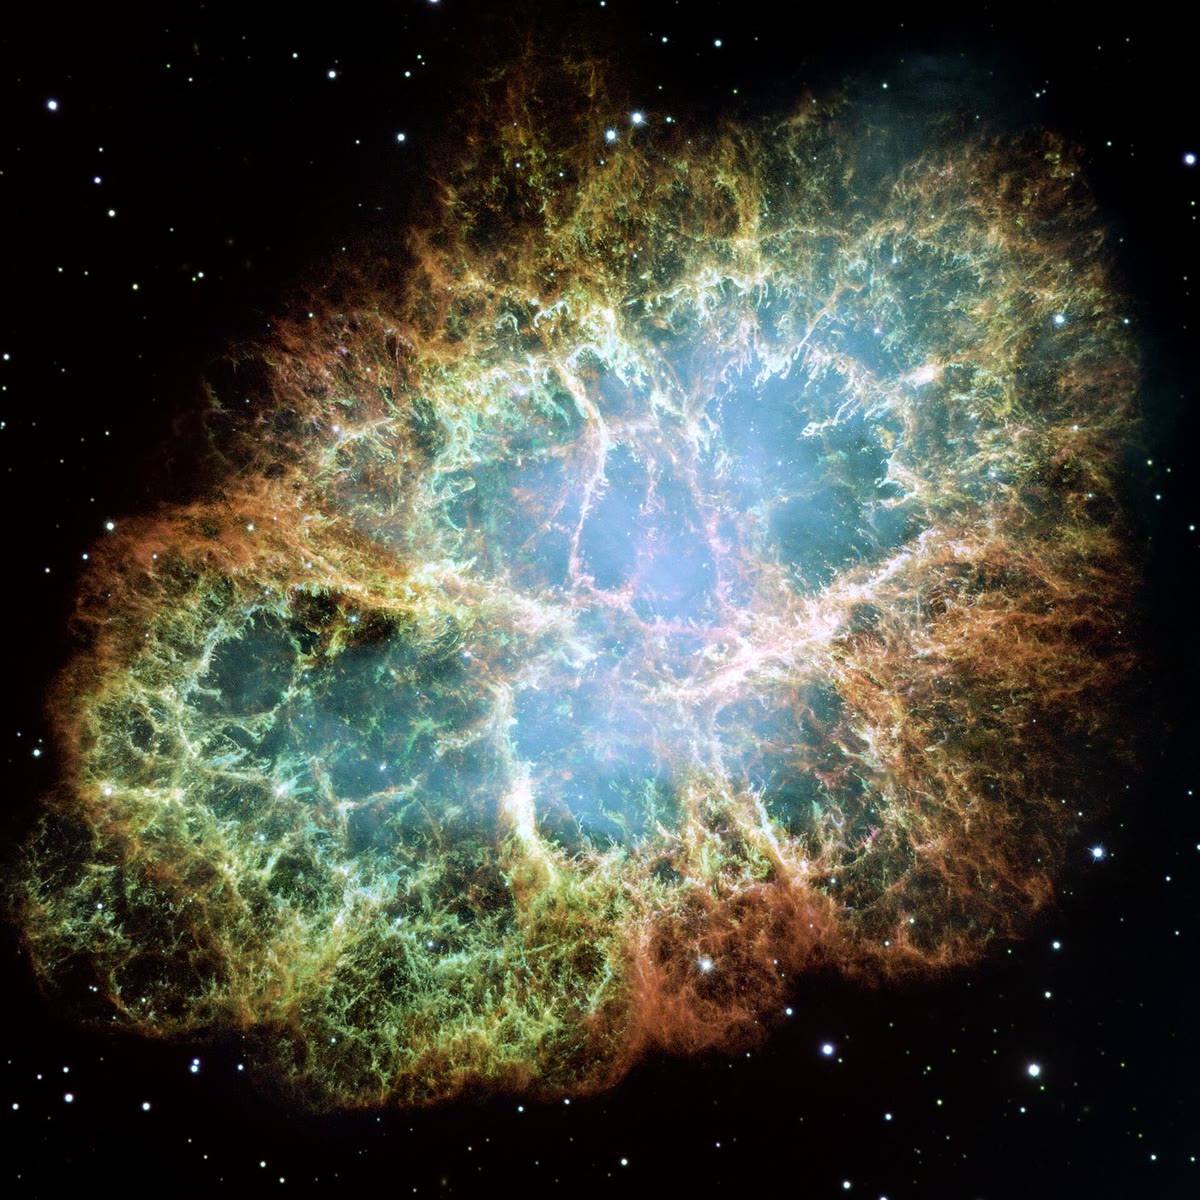
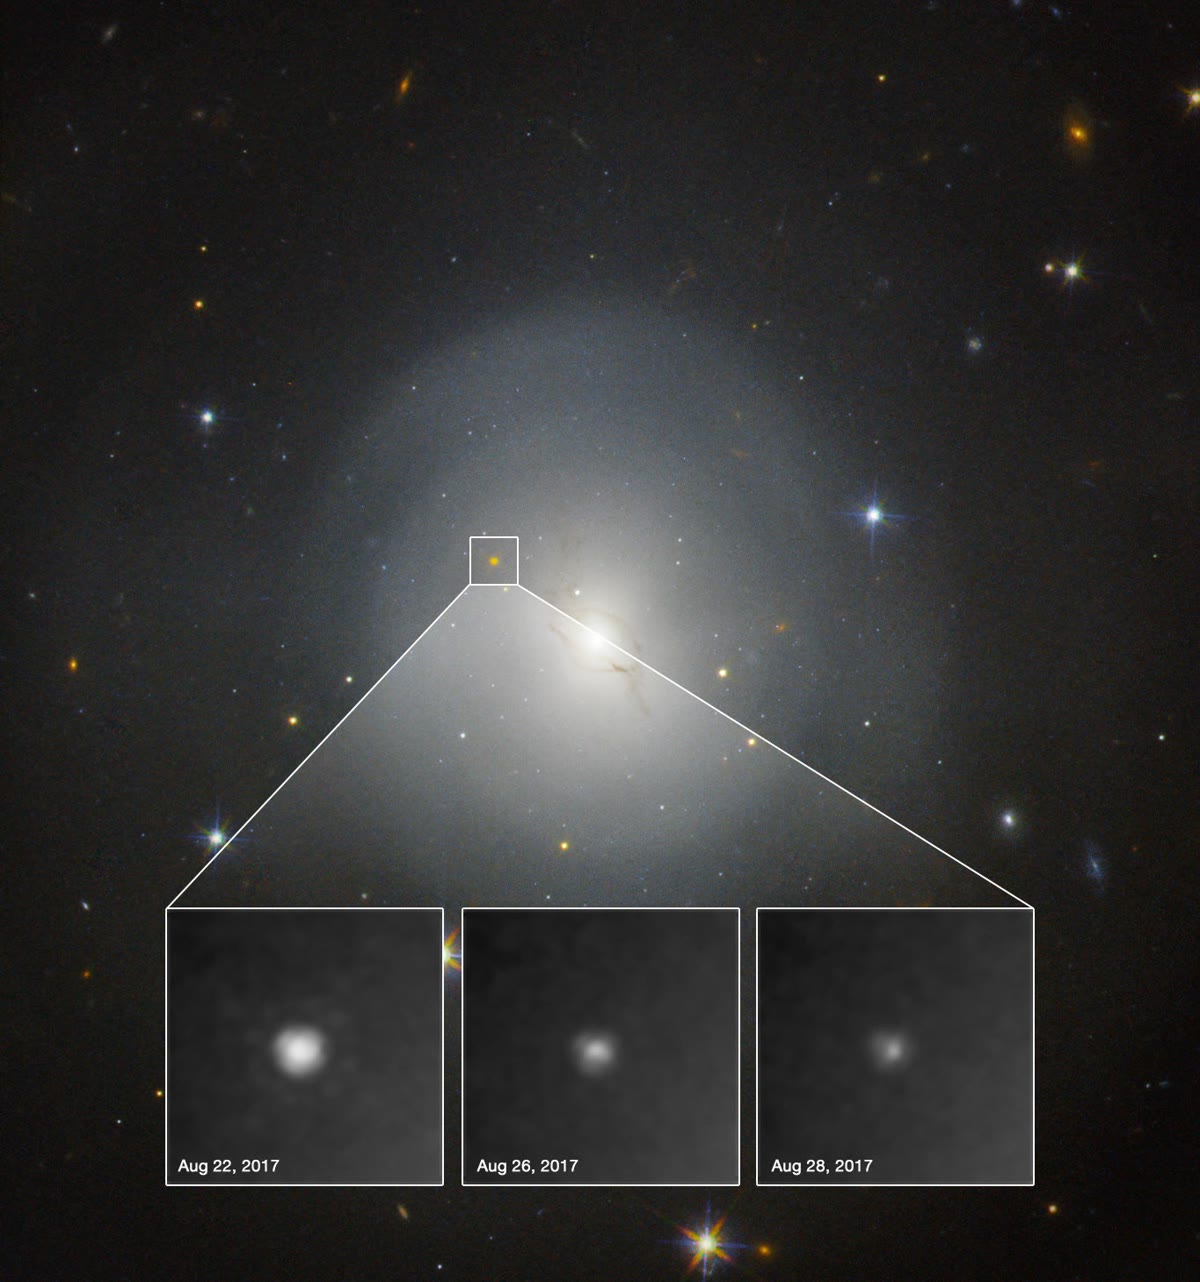
On 17 August 2017 the gravitational-wave detectors recorded the inspiral of two neutron stars, GW170817, at a distance of about : two bodies of to , together . A gamma-ray burst arrived after the merger. Less than eleven hours later telescopes found a new point of light in the galaxy NGC 4993 (figure below). Its ultraviolet glow faded within two days, and over ten days its light turned red and infrared. The models of that evolution need several components of ejecta, the reddest rich in the lanthanides, heavy r-process elements whose dense forest of lines makes the ejecta opaque. The total ejected mass is estimated at to : the first direct evidence that neutron-star mergers make r-process elements.
Figures as of 2021
Whether neutron-star mergers make most of the Galaxy’s r-process elements is not settled. Mergers wait for their binary orbits to decay, and models of the Galaxy’s evolution in which they are the only source make the r-process elements too late to explain what is seen in the oldest, most metal-poor stars. Rare kinds of core-collapse supernova, with fast rotation and strong magnetic fields, and the collapse of very massive stars are the other candidates; one model of the Galaxy explains the observed europium if about three per cent of the hypernovae of 25 to are of the magnetically driven kind.
30.5 The chemical evolution of the Galaxy
Each generation of stars returns to the gas some of what it made, and the next generation forms from that enriched gas. The composition of a star therefore records the composition of the gas at its birth, and the stars of a galaxy, sorted by age, record its history.
Definition 30.9 (Galactic chemical evolution)
Galactic chemical evolution is the change of the composition of the gas and of the stars of a galaxy with time, under the combined action of star formation, the stellar yields, the lifetimes of the stars, and the gas that flows into the galaxy or is driven out of it; and the study of that change by models compared with the abundances of stars of known age.
The simplest model treats a region of a galaxy as one well-mixed box of gas that turns slowly into stars. Let be the mass locked in long-lived stars and in stellar remnants, the mass of gas, and the total. The yield per stellar generation is the mass of new metals that a generation of stars returns to the gas per unit mass it locks up.
Theorem 30.10 (Closed-box model)
Consider a region that exchanges no gas with its surroundings, starts as pure gas without metals, stays well mixed, and in which the stars that make metals die at once while the others live for ever (instantaneous recycling). Then the metallicity of the gas is
where is the gas fraction, and the mass of stars formed with a metallicity below is .
Proof. When a mass is locked into stars, the gas loses , together with the metals it contains, , and gains of new metals: and . Expanding the second, , and the terms in cancel: . Integrating from , gives . The stars formed while the gas metallicity was below are those formed while the gas fell from to , a mass . ∎
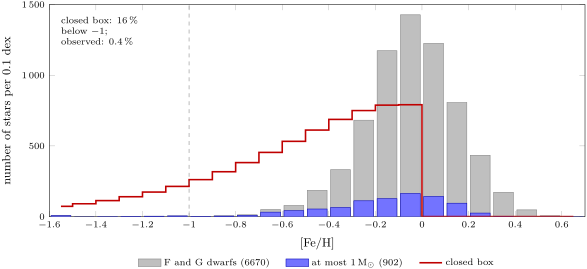
The model predicts the metallicity distribution of the long-lived stars. In the solar neighbourhood the surface density of gas is and that of stars and stellar remnants , so . If the gas today has the proto-solar , the yield is , and the fraction of all the stars formed so far that have below a tenth of the present value, if iron follows the metals, is .
Definition 30.11 (G-dwarf problem)
The G-dwarf problem is the shortage of metal-poor long-lived stars in the solar neighbourhood compared with the prediction of the closed-box model: far fewer of the long-lived dwarf stars of spectral type G have low metallicities than a closed box would have made.
Of the 6670 stars of the survey sample, 26 have : , against the of the closed box. Even among the 902 stars of at most a solar mass, the fairest comparison, the 26 make . The way out is to open the box: if the disc of the solar neighbourhood was built by a slow infall of metal-poor gas over several billion years, the early gas was never a large reservoir waiting to make metal-poor stars, and the tail disappears. Models of the disc that reproduce the distribution need an infall time longer than three to four billion years.
The second clock is the ratio of two kinds of element. The alpha elements come from core-collapse supernovae, soon after a stellar generation is born; much of the iron comes from Type Ia supernovae, long after. In old halo stars, with , is about : these stars formed from gas enriched by core-collapse supernovae alone. In disc stars it falls with increasing metallicity to zero, the solar value, as the Type Ia supernovae add their iron. The figure below shows the simplest model of this time-delay picture: in a closed box, both kinds of supernova start at once except that the Type Ia start a fixed delay after the first stars.
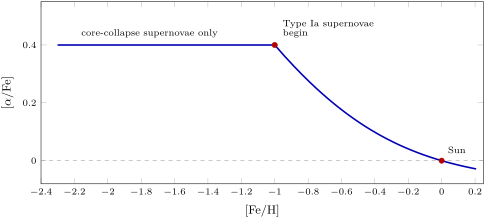
The detailed models of the Galaxy that reproduce the observed trend take two-thirds of the iron from Type Ia supernovae and one third from core-collapse supernovae, and find that the gas of the young Galaxy reached in about one to one and a half billion years. The ratio is a clock: a population that is rich in alpha elements at a given metallicity formed its stars fast, before the Type Ia supernovae could add their iron. The thick disc of the previous chapter is such a population: old, and mildly enriched in alpha elements compared with thin-disc stars of the same metallicity.
30.6 From the solar abundances to the Earth
The Earth is made of the same material as the Sun, but not of all of it. In the cooling nebula, only the elements that condensed into solids could be gathered into planetesimals; the Year 2 volume followed the sequence in which they condense. Iron condenses as metal at about the same temperature as the magnesium silicates, at , so the rocky planets kept their share of iron, while hydrogen, helium, carbon, nitrogen and the noble gases stayed in the gas. Of a gas of solar composition, only about half a per cent of the mass condenses as rock and metal.
Definition 30.12 (Volatility trend)
The volatility trend of a planetary body is the decrease of its abundances, relative to the CI chondrites and normalised to a refractory element, with decreasing condensation temperature: refractory elements stand in their chondritic proportions, moderately volatile ones are depleted the more the lower their condensation temperature.
For the silicate Earth, the Year 2 volume drew the trend against the condensation temperature. Normalised to magnesium, zirconium (condensing at ) stands at times its CI proportion, sodium () at , potassium () at , rubidium () at and zinc () at . The Earth formed from material that had already lost part of its moderately volatile elements before the planet was assembled, or lost them during its growth. Even the CI chondrites differ from the Sun in a way that follows the condensation temperature, though faintly: their moderately volatile elements stand about dex higher than the photospheric values.
So the record of this chapter runs through the planet. The oxygen, magnesium and silicon of the mantle are alpha elements from massive stars; the iron of the core came mostly from Type Ia supernovae; the thorium and uranium whose decay helps to heat the interior lie beyond bismuth, where only the r process reaches; and the whole mixture was sorted by volatility before the Earth gathered it.
30.7 Exercises
Exercise 30.1 ★
Using the solar abundances , , , and : (a) how many silicon atoms and how many oxygen atoms are there in the Sun per iron atom? (b) How many iron atoms per gold atom, and how many lead atoms per gold atom?
Solution
Solution of Exercise 30.1.
(a) and : about one silicon atom and seventeen oxygen atoms per iron atom. (b) and : beyond the iron peak the abundances fall by millions, but lead, on its own peak, is eleven times more abundant than gold.
Exercise 30.2 ★
(a) How many iron atoms per million hydrogen atoms does the Sun hold ()? (b) A halo star has . How many hydrogen atoms does it hold per iron atom? (c) Another star has one iron atom for every ten million hydrogen atoms. What is its ?
Solution
Solution of Exercise 30.2.
(a) , that is iron atoms per million hydrogen atoms. (b) A hundred times fewer: per million, one iron atom per hydrogen atoms. (c) .
Exercise 30.3 ★
The stable isotopes of xenon have mass numbers 124, 126, 128, 129, 130, 131, 132, 134 and 136. Among their isobars, tellurium () has stable isotopes 120, 122–126, 128 and 130; iodine () only 127. The s path reaches xenon at , by the decay of , and leaves it at , which decays. Classify each xenon isotope as s-only, r-only, made by both, or p nucleus.
Solution
Solution of Exercise 30.3.
and lie on the proton-rich side, off the s path, and are shielded by the stable and : p nuclei. and are on the s path but shielded from the r process by the stable and : s-only. , and are on the s path and have no stable isobar of lower (iodine has only 127): both processes. and lie beyond , where the s path leaves xenon, and are not shielded: r-only.
Exercise 30.4 ★
GW170817 lay at about , and its gamma rays arrived after the merger seen in gravitational waves. (a) How long had both signals travelled? (b) If the delay is set entirely to a difference in the two speeds, how large is that difference as a fraction of the speed of light, at most?
Solution
Solution of Exercise 30.4.
(a) , about million years. (b) . This is an upper bound, since part or all of the delay may come from the emission of the gamma rays after the merger.
Exercise 30.5 ★★
The three s-only isotopes of tellurium have proto-solar abundances , and per silicon atoms (, , ) and averaged cross-sections , and . (a) Compute for each. (b) From alone, predict the abundances of and , and compare. (c) Why can the relation not be applied to ?
Solution
Solution of Exercise 30.5.
(a) , , . (b) From : , above the measured value, and , above. Abundances that differ by a factor of five are predicted to within a few per cent from the cross-sections alone. (c) is r-only: the s flow leaves tellurium at , which decays, so no steady s flow passes through and its abundance was set by the r process.
Exercise 30.6 ★★
In the classical model, each nucleus on the s path passes on to the next a fraction of the flow, with . (a) Compute for () and for the neutron-magic (). (b) The nuclei from to on the path have cross-sections , , , , and . By what factor does fall from to ? (c) Compare with the measured values, and .
Solution
Solution of Exercise 30.6.
(a) , so for ; for , and : the magic nucleus passes on only of the flow. (b) The six factors are , , , , and ; their product is : falls by a factor of . (c) The measured fall is . The model gets the size of the step right to within , nearly all of it from and , the two nuclei with .
Exercise 30.7 ★★
A neutron of thermal energy has the speed , . (a) Compute at , the temperature of the carbon-13 layer of a red giant. (b) For , with , compute the mean time between two captures, , for , and . (c) Compare with the half-lives of () and of (). Which one is a branching point?
Solution
Solution of Exercise 30.7.
(a) , and . (b) With , is for ( per cubic centimetre): a mean time of , about years; then years at and year, two months, at . (c) decays in hours, far faster than any of these capture times: it always decays and the path does not split there. lives about two years, between the capture times at and : at the high densities of the helium flashes a good part of it captures before it decays. It is a branching point, and the abundances on either side of it measure the neutron density.
Exercise 30.8 ★★
In the Sun, is for calcium, for scandium and for titanium; for beryllium, for boron and for carbon. (a) How many times rarer is scandium than its two neighbours? (b) How many times rarer is beryllium than carbon? (c) Which feature of the abundance curve does each illustrate, and what is its cause?
Solution
Solution of Exercise 30.8.
(a) times rarer than calcium and times rarer than titanium. (b) . (c) Scandium shows the odd–even effect: nuclei with even numbers of protons are more tightly bound and are built by the capture of helium nuclei in the burning stages of massive stars, which favour them. Beryllium shows the trough of lithium, beryllium and boron: these fragile nuclei are destroyed at the temperatures of stellar interiors, and helium burning goes from helium straight to carbon, without making them.
Exercise 30.9 ★★
In the two-phase model of the chapter, the plateau is the ratio made by core-collapse supernovae, and at the ratio is solar. (a) Show that the share of the solar iron made by Type Ia supernovae is , and compute it for . (b) What plateau would give the two-thirds of the detailed models? (c) A dwarf galaxy shows its knee at . What does that say about its star formation?
Solution
Solution of Exercise 30.9.
(a) Let be the alpha elements and , the iron from the two kinds of supernova. On the plateau, times the solar ratio. At , is solar. Dividing, , and the Type Ia share is . (b) gives . (c) The Type Ia supernovae begin after the same delay in both galaxies. When they began in the dwarf galaxy, its gas had reached only , against in the Galaxy: it had turned its gas into stars ten times more slowly.
Exercise 30.10 ★★★
The CI chondrites contain, in parts per million by mass, of magnesium, of zirconium, of sodium, of potassium and of rubidium; the silicate Earth contains of magnesium and , , and parts per million of the others. Their 50 per cent condensation temperatures are (Mg), (Zr), (Na), (K) and (Rb). (a) For each element compute . (b) Plot it against the condensation temperature and describe the trend. (c) Why is magnesium chosen as the reference?
Solution
Solution of Exercise 30.10.
(a) For zirconium,
likewise for sodium, for potassium and for rubidium. (b) Zirconium, the most refractory, stands close to its chondritic proportion. The three moderately volatile alkali metals, condensing at , are depleted by factors of five to nine, rubidium, the most volatile, the most. The silicate Earth follows the volatility trend. (c) Magnesium is a major, refractory element that condenses with the bulk of the rock, and it is lithophile: it stayed in the mantle when the core formed. A siderophile reference such as iron or nickel would mix the loss to the core with the loss by volatility.
Exercise 30.11 ★★★
A leaky box loses gas in a wind at a rate times its rate of star formation, and receives none. (a) Show that its metallicity is . (b) With , compare the metallicity reached when the gas has fallen to of its initial mass for and . (c) Why do small galaxies, with weak gravity, tend to be metal-poor?
Solution
Solution of Exercise 30.11.
(a) When a mass is locked into stars, the wind removes of gas of metallicity : and . Expanding the second and subtracting leaves , which integrates to the result. (b) : for , and half as much, , for . (c) A wind lowers the effective yield by the factor . In a galaxy of small mass, supernovae drive gas out more easily, is large, and the metals are lost with the gas.
Exercise 30.12 ★★★
(a) The Sun has in its photosphere and the CI chondrites . Compute the two ratios and the fraction of its lithium the Sun has destroyed. (b) The oldest metal-poor stars show , while Big Bang nucleosynthesis predicts . By what factor does the Solar System’s lithium exceed each? (c) What do the two comparisons imply?
Solution
Solution of Exercise 30.12.
(a) in the Sun and in the CI chondrites. The Sun keeps of its lithium: it has destroyed of it. (b) and . (c) The Solar System holds almost four times more lithium than the Big Bang made: most of its lithium was made later, by some other process. The oldest stars hold three times less than the Big Bang made: either they have destroyed part of it, as the Sun has, or the prediction misses something; the two comparisons alone do not say which.
30.8 Problem: A closed-box galaxy
Problem 30.1
Weekend problem — from the solar mixture to the metallicities of the long-lived stars
Use , the solar abundances , , , the present photospheric mass fractions , , , and the proto-solar . Assume throughout that iron follows the total metallicity, .
Part I — The solar mixture.
- How many hydrogen atoms are there in the Sun per iron atom?
- Compute the number ratio . Taking a helium atom four times as heavy as a hydrogen atom, compare with .
- A star holds one iron atom for every hydrogen atoms. Compute its to two decimals.
- The same star has . Compute its , and its number of oxygen atoms per iron atom compared with the Sun’s.
- Oxygen is the most abundant metal. Estimate the star’s metal mass fraction by scaling the Sun’s with .
- Why is the metallicity of a star usually measured from iron rather than from oxygen, although oxygen dominates ?
Part II — The s process on tellurium. Use the data of Exercise 30.5.
- Explain from the chart of the nuclides why , and are s-only.
- Compute for the three isotopes and their mean.
- Predict the abundance of from the mean of the other two, and give the difference from the measured value in per cent.
- has per Si and . Compute its and say why it is not on the plateau.
- The s-only pair and has and . What share of the flow went round , and through which branching?
- Across the product falls from () to (). Which property of the nuclei with explains the drop?
Part III — The closed box. The solar neighbourhood has of gas and of stars and stellar remnants. Take the present gas to have .
- Compute the present gas fraction .
- Compute the yield per stellar generation that the closed box needs, and its ratio to .
- Compute and of the gas when the gas fraction was , then .
- Compute the gas fraction when the gas reached .
- What fraction of the total mass had then been locked into stars?
- If the present gas fraction were instead, what yield would the box need?
Part IV — The metallicity distribution.
- Show that the closed box gives a distribution of stars in proportional to , and find the of its peak.
- Compute the fraction of all stars formed so far with .
- Compute the fraction with .
- In the survey sample of 6670 F and G dwarfs, 26 have . How many does the closed box predict?
- Among the 902 stars of at most one solar mass the same 26 are found. Compute the observed fraction, and say why this subsample is the fairer comparison.
- With a present gas fraction of , what would the predicted fraction below be? Does a different gas fraction solve the problem?
- Give the fraction of long-lived stars with that the closed box predicts for the solar neighbourhood, in per cent, to two significant figures, and say what the comparison with the observed stars implies for the history of the disc.
Solution
Solution of Problem 30.1.
Part I.
1. .
2. , so , against . They agree to ; the small gap is there because a helium atom weighs a little less than four hydrogen atoms.
3. .
4. , so . The star has oxygen atoms per iron atom, against in the Sun: times more.
5. , a quarter of the Sun’s.
6. Iron has a great many lines in the spectrum of a cool star, while oxygen has few and faint ones: iron is measured far more easily and precisely, and stands in for the metals.
Part II.
7. Each sits behind a stable isobar of lower : , and stop the r-process decay chains before they reach tellurium. All three lie on the s path, which runs through tellurium from to .
8. , and ; mean .
9. The mean of the other two is , so , only above the measured .
10. , nearly twice the plateau. is r-only: the s path leaves tellurium at , so its abundance was made by the r process and owes nothing to the s flow.
11. : of the flow went round , by captures on the unstable , and before they could decay to samarium.
12. With a closed shell of 82 neutrons, these nuclei bind an extra neutron weakly and have very small capture cross-sections ( for ). The flow piles up on them and only part of it passes on: they are bottlenecks.
Part III.
13. .
14. , so , times .
15. At , , so . Since , . At , and .
16. , so .
17. : of the mass.
18. , about half as much.
Part IV.
19. The mass of stars with metallicity below is , so per unit it is . Since , , and per unit the distribution is proportional to . Its derivative, , vanishes at : the peak is at .
20. .
21. , , and .
22. , against 26: forty times too many.
23. , still more than five times below the box. The model’s stars are the long-lived ones, those of at most about a solar mass, which have all survived since they formed; among the more massive F stars, the oldest, which are also the most metal-poor, have died, and the full sample under-counts them.
24. : worse. Raising the gas fraction does not help either: as tends to 1 the fraction tends to , still more than three times the observed. No gas fraction rescues the closed box.
25. The closed box predicts that of the long-lived stars of the solar neighbourhood have , against at most observed. The disc was not a closed box: it grew by a slow infall of metal-poor gas, so that little gas ever sat waiting at low metallicity to form stars.