University Chemistry — Year 2 · Bachelor Year 2
31Chromatography
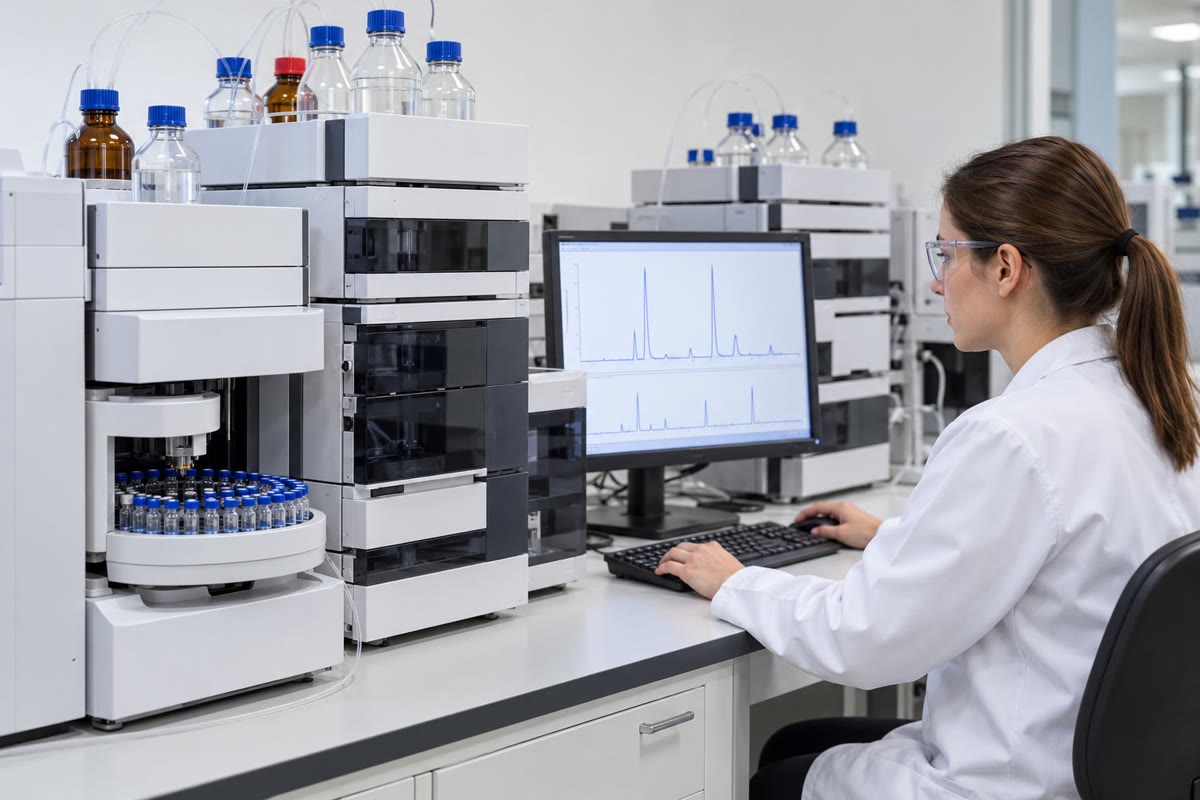
A drop of an energy drink, diluted and filtered, is injected into a steel tube no longer than a pen and packed with silica grains a few micrometres across. A few minutes later a detector has drawn a line with a handful of peaks, and from the area of one of them the laboratory reports how much caffeine the can holds, to a few per cent. Chromatography separates the components of a mixture by letting them race through a column at different speeds; this chapter explains why they travel at different speeds, why their peaks have the width they have, how to separate two neighbours, and how to turn a peak into a quantity.
You already know
The school volume: paper and thin-layer chromatography, chromatogram, eluent. The Year 1 volume: the partition coefficient, liquid–liquid extraction, the retention factor of a thin-layer plate. Chapter 7: the theoretical plate of a distillation column.
31.1 Principle
Definition 31.1 (Chromatography)
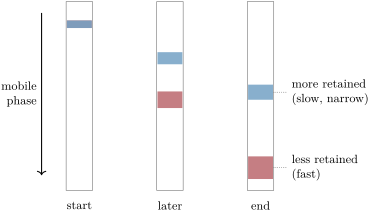
Chromatography separates the components of a mixture by distributing them between a stationary phase, fixed in a column or on a plate, and a mobile phase, a gas or a liquid that flows past it. Carrying the components through and out of the column with the mobile phase is elution.
A molecule moves only while it is in the mobile phase; while it is held by the stationary phase it waits. It switches between the two phases millions of times on its way, so its average speed is set by the fraction of time it spends in each, that is by its partition equilibrium.
Definition 31.2 (Retention)
The retention time of a compound is the time from injection to the maximum of its peak; the hold-up time is the retention time of an unretained compound, which never enters the stationary phase. The retention factor of a compound on a column is
It is not the of a thin-layer plate, which measures a distance travelled, though both describe the same partition.
Proposition 31.3 (Retention time)
If, at equilibrium, the amounts of a compound in the stationary and mobile phases of a slice of column are and , the compound moves at , where is the speed of the mobile phase, and .
Proof. A given molecule spends the fraction of its time in the mobile phase, where it moves at , and the rest at rest. Its average speed is . The column of length is crossed in , and . ∎
Proposition 31.4 (Retention and partition)
The retention factor is the ratio of the amounts in the two phases, , where is the partition coefficient (concentration in the stationary phase over concentration in the mobile phase) and , the volumes of the phases in the column.
Proof. From Proposition 31.3, . With , and , . ∎
Two compounds separate if their partition coefficients differ; the column geometry () multiplies all retentions alike. Changing the mobile phase, which changes , is the chemist’s main lever on retention.
31.2 Peak width and plate number
A band does not stay thin. Molecules of the same compound take different paths between the grains, diffuse along the column and lag behind in the stationary phase by random amounts. The peak recorded at the outlet is very nearly a Gaussian of standard deviation (in time), and the narrower it is for a given , the better the column.
Definition 31.5 (Plate number)
The plate number of a column for a compound is , where is the standard deviation of its peak in time. The plate height is , for a column of length .
The names come from the distillation column of Chapter 7: a chromatographic column behaves as if it were a stack of equilibrium stages, each high. The analogy is a way of counting, not a picture of the column.
Proposition 31.6 (Plate number from a peak)
With the width at the base between the tangents at the inflection points and the width at half height,
Proof. For a Gaussian of standard deviation and height , the inflection points are at , where the height is and the slope ; the tangent there reaches zero after more, at : . Half height is reached where , : . Substituting or in gives and , written 5.54. ∎
Proposition 31.7 (Van Deemter equation)
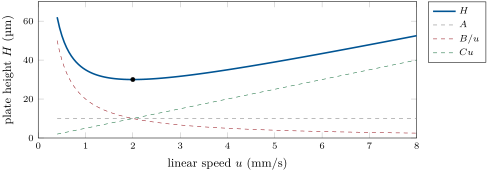
The plate height depends on the linear speed of the mobile phase as
where accounts for the different paths through the packing, for diffusion along the column (worse when the molecules stay longer) and for the slow exchange with the stationary phase (worse when the mobile phase hurries past). is smallest at , where .
Proof. Admitted at this level. ∎
The form of the equation is admitted; its minimum is not. vanishes at , and there , so ; the second derivative is positive, so this is a minimum. Small grains reduce and : that is why modern liquid chromatography uses particles of a few micrometres and high pressures to push the mobile phase through them.
31.3 Separating two compounds
Definition 31.8 (Selectivity and resolution)
For two neighbouring peaks with , the selectivity factor is , and the resolution is
the distance between the peaks divided by their mean base width.
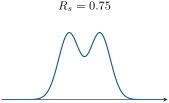
At the peaks still overlap visibly; at the signal returns to the baseline between them (baseline separation), which is the usual target for quantitative work.
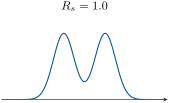
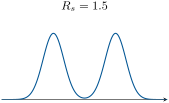
Theorem 31.9 (Resolution equation)
For two neighbouring peaks with the same plate number ,
Proof. For close peaks the two base widths are nearly equal; take both equal to that of the second peak, (Definition 31.5). Then . With (Proposition 31.3), and , so . Finally . ∎
Method 31.10 (Improving a resolution)
- Efficiency: . Doubling the column length doubles and the analysis time but multiplies by only ; smaller particles or the optimum flow rate raise at constant length.
- Selectivity: the factor is the most sensitive. Change the mobile phase (solvent, pH), the stationary phase or, in gas chromatography, the temperature.
- Retention: rises steeply up to and slowly beyond, while the time keeps growing as ; aim for between about 2 and 10.
31.4 Techniques
Definition 31.11 (Chromatographic techniques)
In gas chromatography (GC), the mobile phase is a gas (helium, hydrogen or nitrogen) and the stationary phase a liquid film coating the inside of a long capillary column, kept in an oven. In high-performance liquid chromatography (HPLC), a pump pushes a liquid mobile phase through a short column packed with small particles. In reversed phase HPLC, the stationary phase is nonpolar (silica carrying long alkyl chains) and the mobile phase a polar mixture of water with methanol or acetonitrile. In gradient elution, the composition of the mobile phase is changed during the run, in liquid chromatography, to elute strongly retained compounds faster.
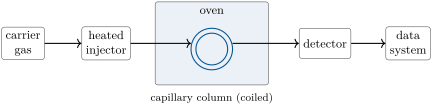

The choice between them follows from volatility. GC needs compounds that vaporise without decomposing, roughly below : solvents, fuels, fragrances, small organic molecules. Raising the oven temperature during the run (a temperature ramp) elutes heavier compounds sooner, as a gradient does in HPLC. HPLC handles everything that dissolves, including salts, sugars, drugs and proteins. In reversed phase the most polar compounds leave first and the most nonpolar last; adding more organic solvent to the mobile phase lowers every retention. Preparative column chromatography, and its faster version, flash chromatography, apply the same principle on a large scale to purify grams of product, usually on polar silica with mixtures of hexane and ethyl acetate.
31.5 Quantitative analysis
The area of a peak is proportional to the amount of compound that reached the detector, but the proportionality constant depends on the compound and on the detector. Injected volumes, of the order of a microlitre, are not perfectly reproducible. An internal standard removes both difficulties.
Definition 31.12 (Response factor and internal standard)
An internal standard is a compound, absent from the sample, added in a known amount to every solution analysed; it must be resolved from all other peaks and behave like the analyte. The response factor of an analyte relative to the internal standard is defined by
where are peak areas and concentrations in the injected solution.
Proposition 31.13 (Internal-standard quantification)
measured on a calibration solution of known and gives, for a sample spiked with the internal standard at , , whatever the volume injected.
Proof. Each area is proportional to the amount injected: , , with detector sensitivities and injected volume . The ratio no longer contains , and is a constant of the method, measured once on the calibration solution. Solving for gives the result. ∎
Method 31.14 (Quantifying with an internal standard)
- Choose a standard close in structure to the analyte, absent from the sample, eluting near it but resolved ().
- Inject a calibration solution with known and ; compute from the area ratio.
- Add the standard to the sample solution at the same ; inject; read .
- Compute , then go back through every dilution to the original sample.
An external calibration (a series of standards of the analyte alone, then the sample, all injected the same way) is simpler but relies on the injected volume and the detector staying constant between runs.
History — Colour writing, 1906
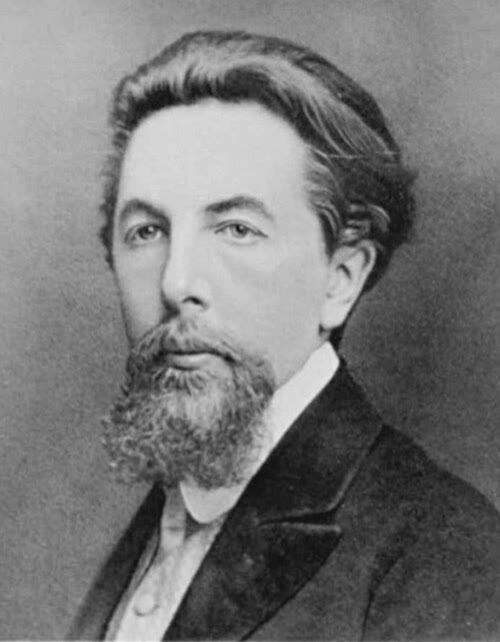
The botanist Mikhail Tsvet poured an extract of green leaves onto a glass tube filled with powdered chalk and washed it through with a solvent: the pigments separated into coloured bands, green chlorophylls and yellow carotenoids. In 1906 he named the method chromatography, “colour writing”. It was largely ignored for a quarter of a century, until it was taken up again for natural products in the 1930s. (Portrait: unknown author, public domain; Wikimedia Commons.)
Safety


Acetonitrile and methanol, the usual organic components of HPLC mobile phases, are flammable and toxic; hexane, used in column chromatography, is flammable, a health hazard and toxic to aquatic life. Solvent waste is collected, never poured down the sink.
31.6 Exercises
Exercise 31.1 ★
A compound has on a column whose hold-up time is . Compute its retention factor and the fraction of its time spent in the mobile phase.
Exercise 31.2 ★
A peak at has a base width of . Compute the plate number.
Solution
Solution of Exercise 31.2.
.
Exercise 31.3 ★
A column gives for a compound. Compute the plate height.
Solution
Solution of Exercise 31.3.
.
Exercise 31.4 ★
GC or HPLC? Ethanol in blood; a protein; caffeine in a drink; benzene in petrol; sugars in fruit juice.
Solution
Solution of Exercise 31.4.
Ethanol in blood: GC (volatile). Protein: HPLC. Caffeine in a drink: HPLC (in water, not volatile enough without preparation). Benzene in petrol: GC. Sugars: HPLC (they decompose before they boil).
Exercise 31.5 ★★
Two peaks: , ; , . Compute the resolution. Are they baseline separated?
Solution
Solution of Exercise 31.5.
: not quite baseline separated (below 1.5).
Exercise 31.6 ★★
How many plates are needed to separate two compounds with and at ?
Solution
Solution of Exercise 31.6.
, so .
Exercise 31.7 ★★
A column has , , (exercise data). Find the optimum speed and the smallest plate height.
Solution
Solution of Exercise 31.7.
; .
Exercise 31.8 ★★
Predict the order of elution of benzene, phenol and toluene in reversed-phase HPLC with a water–methanol mobile phase, and what happens when the methanol fraction is raised.
Solution
Solution of Exercise 31.8.
Phenol (polar , hydrogen bonds with water) first, then benzene, then toluene (one more , more nonpolar). More methanol makes the mobile phase less polar: all three elute earlier, in the same order.
Exercise 31.9 ★★
A calibration solution of an analyte at with the internal standard at gives areas 860 and 400. A sample spiked with the standard at gives areas 645 and 410. Compute the response factor and the concentration of the analyte (exercise data).
Solution
Solution of Exercise 31.9.
. Sample: .
Exercise 31.10 ★★★
A separation gives . What column length, relative to the present one, gives , and what does it cost in time? What other levers are there?
Solution
Solution of Exercise 31.10.
: must be multiplied by , which doubles the analysis time and the pressure. Other levers: the selectivity (mobile phase, stationary phase, temperature), smaller particles, the optimum flow rate.
Exercise 31.11 ★★★
For two Gaussian peaks of equal height and width with base width , compute the signal midway between them, relative to the peak height, at and at (neglect the far peak’s contribution at each maximum).
Solution
Solution of Exercise 31.11.
The peaks are apart, so the midpoint is from each. : each peak contributes ; the valley is at of the peak height. : , about 2 %: back to the baseline for practical purposes.
Exercise 31.12 ★★★
At constant and , compare the resolution factor and the relative analysis time for , 5 and 10. Which range of would you choose?
Solution
Solution of Exercise 31.12.
: 0.67, 0.83, 0.91; time in units of : 3, 6, 11. Going from 2 to 5 gains 25 % in resolution for twice the time; from 5 to 10, 9 % for nearly twice again. A from about 2 to 5 is the usual compromise.
31.7 Problem: Caffeine in an Energy Drink
Problem 31.1
Weekend problem — reversed-phase elution order, column performance from a chromatogram, improving the separation, and quantification with an internal standard
Exercise data (invented, not a real method). An energy drink is diluted tenfold ( to ) and theophylline is added as internal standard at in the diluted solution. Column: , reversed phase; mobile phase water–methanol; UV detection. The unretained matrix (sugars and salts) elutes at ; theophylline at (base width ); caffeine at (base width ). Calibration: caffeine and theophylline give areas 1500 and 1000. Sample: areas 970 (caffeine) and 1010 (theophylline). A can holds .
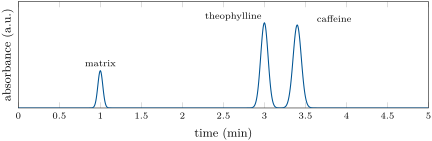
Part I — Reversed phase.
- Describe the stationary and mobile phases of a reversed-phase column.
- Why do the sugars elute at the hold-up time?
- Caffeine is 1,3,7-trimethylxanthine, theophylline 1,3-dimethylxanthine. Explain their order of elution.
- Why is theophylline a good internal standard here?
- What would happen to both retention times if the methanol fraction were raised?
- What does the hold-up time measure?
Part II — Column performance.
- Compute the retention factors of theophylline and caffeine.
- Compute the selectivity factor.
- Compute the plate number for caffeine and for theophylline.
- Compute the plate height for caffeine.
- Compute the resolution between the two peaks.
- Check it with the resolution equation.
- Are the peaks baseline separated?
Part III — Faster or better.
- To save time, the column is shortened to (same packing and flow). What becomes of the resolution?
- And of the analysis time?
- What would a column give instead, and at what cost?
- Which lever acts on ?
- Would raising help much here?
Part IV — Quantification.
- Compute the response factor of caffeine relative to theophylline.
- Why does the injected volume not matter?
- Compute the concentration of caffeine in the diluted solution.
- Compute the concentration of caffeine in the drink.
- What would go wrong if a matrix compound co-eluted with theophylline?
- What would an external calibration require instead?
- State the mass of caffeine in a can.
Solution
Solution of Problem 31.1.
1. Stationary: silica grains carrying long alkyl chains, nonpolar. Mobile: water with methanol, polar. 2. They are very polar and stay in the mobile phase: . 3. Caffeine has one more methyl group than theophylline, and theophylline an that hydrogen-bonds with water: theophylline is more polar and elutes first. 4. It is close in structure (similar response and behaviour), absent from the drink, and elutes near caffeine while being resolved from it. 5. Both would decrease: a less polar mobile phase competes better with the stationary phase. 6. The time the mobile phase takes to cross the column, the time a compound spends moving. 7. ; . 8. . 9. Caffeine ; theophylline . 10. . 11. . 12. ; the small difference comes from the equal-width assumption of the equation. 13. Yes: . 14. is halved: , just at baseline separation. 15. Halved: caffeine at . 16. , for twice the time and twice the pressure: a waste here. 17. The mobile phase composition (methanol fraction, pH, another organic solvent) or the stationary phase. 18. Little: already; at it would be 0.83 (+18 %) for an analysis time multiplied by . 19. . 20. Both peaks come from the same injection: the volume cancels in the ratio of areas. 21. . 22. Tenfold dilution: . 23. would be too large, and the caffeine result too low. 24. A series of caffeine standards injected under exactly the same conditions as the sample, a calibration line of area against concentration, and reproducible injection volumes. 25. : of caffeine per can (exercise data).