High School Physics · Grades 10–12
2Light Spectra and the Message of Light
A beam of starlight is the only sample of a star we will ever hold, and it turns out to be a generous one. Spread the beam into its spectrum — a glass prism does it, a curtain of raindrops does it — and the light becomes a message: a continuous rainbow background announces the star’s temperature, and a barcode of fine lines spells out, element by element, what the star is made of. This chapter learns to read both parts of the message — on laboratory lamps first, then on the Sun.
2.1 White light and its spectrum
Definition 2.1 (Decomposition of white light)
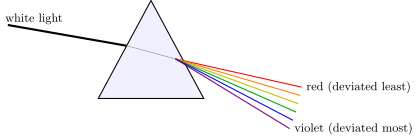
When a narrow beam of sunlight crosses a glass prism, it emerges spread into a continuous band of colors, from red to violet. This band is the spectrum of the light. Light that contains all the visible colors, like sunlight or the light of an ordinary bulb, is called white light. Light of a single pure color, which no prism can split any further, is monochromatic (a laser beam, for instance); a mixture of several colors is polychromatic. An instrument that performs the decomposition and reads off the composition of a light is a spectroscope.
Remark 2.2 (Prisms and raindrops)
The prism works because glass bends violet light a little more than red light — why it does so belongs to the study of refraction, in Chapter 3; here we only use the effect. Water does the same job: each raindrop of a passing shower acts as a tiny prism, receiving white sunlight and returning it sorted by color. A rainbow is the spectrum of the Sun, drawn across the sky.
Definition 2.3 (Wavelength, the identity card of a radiation)
Each monochromatic radiation is characterized by one number, its wavelength , measured in nanometers (). The wavelength is the identity card of the radiation: give and you have said everything there is to say about the pure color. The eye responds to wavelengths between about (violet) and (red) — the visible spectrum. Beyond the two ends the radiation continues, invisible to us: ultraviolet below , infrared above . What the wavelength actually measures — the length of one ripple of a light wave — is explained in Chapter 8; in this chapter, the number itself is what matters.
Example 2.4 (Reading wavelengths)
A green laser pointer emits at : inside the visible range, in the green. A germicidal mercury lamp emits at : ultraviolet, invisible (and dangerous to the eye precisely because invisible). The diode of a television remote emits at : infrared — point it at a phone camera, whose sensor sees a little beyond , and the invisible flashes appear on the screen.
2.2 Continuous spectra and temperature
Definition 2.5 (Continuous spectrum)
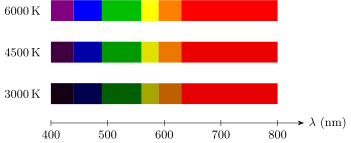
Dense, hot matter — the filament of a bulb, molten steel, the surface of a star — glows, and its light contains every wavelength over a wide range: an unbroken band of color with nothing missing. Such a spectrum is a continuous spectrum. It carries no trace of the chemical nature of the body: a white-hot iron bar and a white-hot copper bar glow alike. What it does encode — entirely — is the temperature.
Definition 2.6 (Absolute temperature)
For radiation laws, the absolute temperature is counted not from the freezing point of water but from the coldest state possible, . The unit is the kelvin (symbol ), with the same size of degree:
Thus a room at is at , and the surface of the Sun, near , is near .
Proposition 2.7 (Hotter means brighter and bluer (Wien’s law))
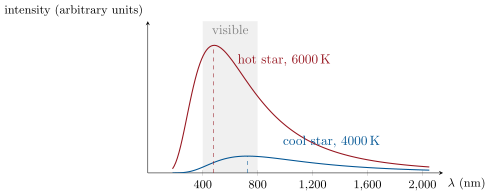
When the temperature of a dense glowing body rises,
- it radiates more at every wavelength: the whole spectrum brightens;
the wavelength at which it radiates most strongly slides toward the short-wavelength (blue) side, according to
where is the absolute temperature in kelvins.
Proof. Admitted at this level. ∎
Remark 2.8 (Where this law comes from)
Wien’s law summarizes careful measurements on furnaces and filaments made at the end of the nineteenth century. Deriving it requires the quantum theory of radiation — this spectrum is, in fact, precisely what classical physics could not explain, and the puzzle that forced Planck to invent the quantum. The honest derivation is carried out in the Year 3 volume.
Example 2.9 (Taking the Sun’s temperature)
The Sun’s continuous spectrum is most intense near . Wien’s law gives its surface temperature:
about — measured from million kilometers away, with a prism and a division.
2.3 Line spectra of excited gases
Definition 2.10 (Emission line spectrum)
A gas at low pressure, excited by an electric discharge (as in a neon tube or a sodium street lamp), glows too — but through a spectroscope its light is nothing like a rainbow. Only a few isolated wavelengths are present: thin bright lines on a black background, called spectral lines. Such a spectrum is an emission line spectrum.
Example 2.11 (Hydrogen and sodium)
Excited hydrogen emits exactly four lines in the visible: a red line at , a blue-green line at , and two violet lines at and . Excited sodium emits essentially one strong yellow-orange line at — which is why older street lamps bathe whole neighborhoods in that single color: their light contains almost nothing else.
Proposition 2.12 (The fingerprint of the elements)
Each chemical element emits its own fixed catalog of spectral lines, the same in every laboratory and at every epoch, and no two elements share the same catalog. A line spectrum therefore identifies the emitting element, as a fingerprint identifies a person.
Proof. Admitted at this level. ∎
Remark 2.13 (Why lines?)
Why an atom emits only certain wavelengths — and why those wavelengths betray the element — is explained by the quantum theory of the atom, in the final year of this volume: each element owns a ladder of energy levels, and each line marks one jump between rungs. For now we use the fingerprint as detectives do: without asking the fingers how they grew.
2.4 Absorption spectra
Definition 2.14 (Absorption spectrum)
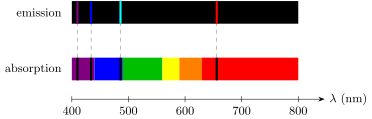
Send white light through a cool, low-pressure gas and disperse what comes out: the continuous rainbow reappears, but scored by thin dark lines. The gas has removed certain wavelengths from the passing light. Such a spectrum — a continuous background minus a set of lines — is an absorption spectrum.
Proposition 2.15 (Emission and absorption lines coincide)
A gas absorbs exactly the wavelengths that it is able to emit: the dark lines of an element’s absorption spectrum sit at the same wavelengths as the bright lines of its emission spectrum. The fingerprint of Proposition 2.12 can therefore be read in the dark as well as in the bright.
Proof. Admitted at this level. ∎
Remark 2.16 (One mechanism, two signs)
The coincidence is no accident: absorbing at climbs the same energy rung that emitting at descends — the quantum chapters at the end of this volume make this precise. Established by Kirchhoff and Bunsen in 1859, it is the key that unlocks the entire next section.
Example 2.17 (A flask of sodium vapor)
White light crosses a flask containing cool sodium vapor. The transmitted spectrum is a full rainbow with one dark line at — precisely where a sodium lamp shines brightest. Looking at the flask from the side in a dark room, one sees the stolen light re-emitted: a faint yellow-orange gleam at that same wavelength.
2.5 Spectral analysis: reading a star
Definition 2.18 (Spectral analysis)
Spectral analysis is the identification of the chemical elements contained in a source (a flame, a lamp, a star) by matching the lines of its spectrum against the laboratory catalogs of the elements.
Method 2.19 (Reading a stellar spectrum)
A star is a ball of dense hot matter (the surface) wrapped in a thinner, cooler atmosphere. Its light therefore arrives as a continuous spectrum scored by absorption lines — and each part is read separately:
- Locate the peak of the continuous background; Wien’s law (Proposition 2.7) gives the surface temperature .
- List the wavelengths of the dark lines.
- Match them against the catalogs: an element may be declared present only if all its strong lines appear.
- Conclude: the absorption happens in the star’s atmosphere, so the elements identified are those of the atmosphere.
Example 2.20 (The Sun’s recipe)
The solar spectrum carries thousands of dark lines, mapped by Fraunhofer in 1814. Among the strongest: , , and — the full hydrogen fingerprint — together with the sodium line at and a calcium pair at and . The Sun’s atmosphere contains hydrogen above all, plus traces of elements familiar from Earth’s rocks. Modern measurements refine the headline: the Sun is roughly three quarters hydrogen by mass.
Remark 2.21 (The element found in the sky first)
During the eclipse of 1868, a bright line at appeared in the spectrum of the Sun’s atmosphere — matching no known element. By Proposition 2.12 an unknown fingerprint means an unknown element, so one was announced and named after the Greek sun, helios: helium. It was finally isolated on Earth in 1895 — the only chemical element discovered in space before being found at home.
2.6 Exercises
Exercise 2.1 ★
For each radiation, say whether it is ultraviolet, visible or infrared, and give its color if visible: (mercury lamp), , , , (cutting laser).
Solution
Solution of Exercise 2.1.
: ultraviolet. : visible, blue. : visible, yellow-orange. : visible, red. : infrared — which is what makes a cutting laser doubly dangerous: powerful and invisible.
Exercise 2.2 ★
A narrow beam of sunlight falls on a glass prism.
- Describe what appears on a screen placed behind the prism.
- Which end of the band has been deviated the most?
- The sunlight is replaced by the beam of a green laser pointer. What appears on the screen now, and what does this show about laser light?
Solution
Solution of Exercise 2.2.
1. A continuous band of colors, from red to violet: the spectrum of sunlight.
2. The violet end — the prism deviates short wavelengths the most.
3. A single green spot: deviated, but not spread into a band. Laser light is monochromatic — one wavelength only, so there is nothing to sort.
Exercise 2.3 ★
Match each source to the type of spectrum it produces (continuous, line emission, or absorption): (a) the filament of an incandescent bulb; (b) a neon advertising tube; (c) molten iron in a foundry; (d) a sodium street lamp; (e) sunlight received on Earth.
Solution
Solution of Exercise 2.3.
(a) Continuous (dense hot filament). (b) Line emission (low-pressure excited gas). (c) Continuous (dense molten metal). (d) Line emission (essentially the single line at ). (e) Absorption: the continuous spectrum of the hot surface, scored by the dark lines of the Sun’s cooler atmosphere.
Exercise 2.4 ★
About rainbows:
- What plays the role of the prism?
- A rainbow is only seen with the Sun behind the observer and rain ahead. What does each ingredient supply?
- Explain why a rainbow proves that sunlight is white light.
Solution
Solution of Exercise 2.4.
1. The raindrops: each one receives white sunlight, decomposes it and sends it back sorted by color.
2. The Sun supplies the white light; the rain supplies millions of tiny prisms; the geometry works out only for light returned by the drops toward the observer, which is why the Sun must be at the observer’s back and the rain in front.
3. The drops add no light of their own — they only sort what they receive. If sorted sunlight displays every color, then every color was already contained in the sunlight: sunlight is white light.
Exercise 2.5 ★
A blacksmith heats an iron nail: it glows dull red, then bright orange, then almost white.
- Rank the three stages by temperature.
- Which two effects of Proposition 2.7 does the sequence illustrate?
- Justify the expression “white-hot is hotter than red-hot”.
Solution
Solution of Exercise 2.5.
1. Dull red bright orange almost white.
2. Both: the glow gets brighter (effect 1), and its color drifts from red toward the blue side (effect 2, the peak shrinking), so that more and more of the visible band is strongly lit — a full band reads as white.
3. A body glowing white emits strongly across the whole visible band; a body glowing red only manages the long-wavelength end. By Wien’s law the first is the hotter one.
Exercise 2.6 ★★
The Sun’s continuous spectrum peaks at .
- Compute the surface temperature of the Sun in kelvins.
- Convert it to degrees Celsius.
- Check that the peak lies inside the visible range, and state its color.
Solution
Solution of Exercise 2.6.
1.
2. .
3. : the peak is visible, in the green.
Exercise 2.7 ★★
A candle flame glows at about ; an electric hotplate set to “warm” sits at about .
- Compute for each source, and give its domain.
- The hotplate is clearly hot — a hand held above it feels the radiation — yet it looks black. Explain.
- The candle’s peak is also outside the visible range. Why can we see the flame at all?
Solution
Solution of Exercise 2.7.
1. Candle: , in the infrared. Hotplate: , far infrared.
2. At essentially all the radiation is infrared: the skin absorbs it and feels heat, but the eye receives nothing — hot, yet black.
3. A continuous spectrum is broad: even peaked at , the candle’s spectrum keeps a visible tail at the red-yellow end — weak, but enough for the dark-adapted eye.
Exercise 2.8 ★★
Laboratory catalogs give, in the visible: hydrogen ; sodium ; helium . Two discharge lamps are analyzed. Lamp A shows lines at , and , plus a faint violet line near the edge of visibility; lamp B shows a single strong line at . Identify the gas in each lamp, justifying carefully why lamp B does not contain helium.
Solution
Solution of Exercise 2.8.
Lamp A: the lines , , match hydrogen, and the faint violet line completes the catalog at : hydrogen.
Lamp B: the line sits at , sodium’s only strong visible line. Helium is excluded not by the line itself (helium does own a line at the nearby ) but by the missing ones: helium would also show , and , and none appears. An element is identified by its full catalog: lamp B contains sodium.
Exercise 2.9 ★★
White light is sent through a flask of cool sodium vapor.
- Describe the spectrum of the transmitted light.
- At which wavelength does its dark line sit, and why exactly there?
- The lamp is switched off, the room darkened, and the vapor is now excited by a discharge. Describe the new spectrum.
Solution
Solution of Exercise 2.9.
1. A continuous rainbow scored by one thin dark line: the absorption spectrum of sodium.
2. At : a gas absorbs exactly the wavelengths it is able to emit (Proposition 2.15), and sodium’s strong visible line is at .
3. The emission spectrum of sodium: a single bright yellow-orange line at on a black background — the same wavelength, with the two spectra exchanging bright and dark.
Exercise 2.10 ★★
A high-resolution spectrum of the Sun shows dark lines at , , , , and . Catalogs: hydrogen ; magnesium .
- Which elements do these lines reveal?
- In which part of the Sun are the lines produced, and why are they dark rather than bright?
Solution
Solution of Exercise 2.10.
1. , , , : the complete hydrogen catalog. and : the magnesium pair. Both elements are present.
2. In the Sun’s atmosphere, the cooler and thinner gas above the glowing surface. The surface sends up a continuous spectrum; the atmosphere removes its own wavelengths from the passing light, so the lines appear as missing light — dark against the bright background.
Exercise 2.11 ★★
Your body has a surface temperature of about .
- Convert to kelvins and compute the of your own thermal radiation.
- In which domain does it fall?
- Deduce why nobody glows visibly in a dark room, and how a thermal camera finds people anyway.
Solution
Solution of Exercise 2.11.
1. , so
2. Far infrared — more than ten times the wavelength of red light.
3. At the visible part of the radiation is utterly negligible: no visible glow, however dark the room. A thermal camera carries a sensor tuned to the radiation actually emitted, around , and sees warm bodies shine against cooler surroundings.
Exercise 2.12 ★★★
The tungsten filament of an incandescent bulb runs at .
- Compute and give its domain.
- Explain why such bulbs make poor lamps but excellent little heaters.
- What filament temperature would place at , in mid-visible? Tungsten melts at ; conclude why no filament bulb can imitate daylight, and why lighting moved to other technologies.
Solution
Solution of Exercise 2.12.
1. : near infrared.
2. The spectrum peaks beyond the visible: most of the electric power returns as invisible infrared — that is, heat — and only a small visible tail lights the room. As a lamp the bulb wastes most of its power; as a heater it is nearly perfect.
3. — far above tungsten’s melting point of . No solid filament can be pushed to daylight temperatures, so daylight-like lamps had to abandon incandescence altogether (fluorescent tubes, LEDs), producing visible light without heating a body to .
Exercise 2.13 ★★★
The spectrum of a star shows a continuous background peaking at , scored by dark lines at , , , , and . Catalogs: hydrogen ; calcium ; sodium .
- Compute the star’s surface temperature. Is it hotter or cooler than the Sun?
- Which elements does its atmosphere certainly contain?
- Is sodium abundant in this atmosphere? Justify.
Solution
Solution of Exercise 2.13.
1. : hotter than the Sun’s .
2. Hydrogen (the full set , , , is present) and calcium (both lines, and ).
3. No. Sodium’s line at is absent, while abundant sodium in the atmosphere would necessarily print it on the continuous background. If sodium is there at all, it is only in traces too faint to detect.
Exercise 2.14 ★★★
A discharge lamp contains a mixture of two gases. Its spectrum shows lines at , , , , , , and . Using the catalogs of Exercise 2.8:
- Identify the two gases.
- A classmate claims the line proves the lamp also contains sodium (line at ), since a cheap spectroscope cannot separate wavelengths apart. Without a better instrument, why is helium a sufficient explanation of this line — and what measurement would settle the question of sodium for good?
Solution
Solution of Exercise 2.14.
1. Hydrogen explains , , and ; helium explains , , and . Every observed line is accounted for: the mixture is hydrogen and helium.
2. Helium is a sufficient explanation because its three other lines (, , ) are all present — the line is then expected from helium alone, and nothing in the spectrum requires sodium. To settle the matter one needs resolution, not argument: a finer spectroscope separates helium’s single line at from sodium’s, which is in fact a close pair at and . Seeing one line there acquits sodium; seeing three convicts it.
Exercise 2.15 ★★★
In the constellation Orion, Betelgeuse glows visibly red and Rigel blue-white. Their continuous spectra peak at about and respectively.
- Compute both surface temperatures.
- Recover the ratio of the two temperatures directly from the two wavelengths, without recomputing either temperature.
- Explain the two colors, given that neither peak lies in the visible range.
- Both stars are bright to the naked eye. Why does a peak outside the visible range not make a star invisible?
Solution
Solution of Exercise 2.15.
1. Betelgeuse: . Rigel: .
2. Since is the same constant for both, .
3. Betelgeuse peaks in the infrared: inside the visible band its spectrum is strongest at the red end, so the star looks red. Rigel peaks in the ultraviolet: its visible band is strongest at the blue end, hence blue-white.
4. A continuous spectrum covers a huge range of wavelengths. Even with its peak outside the visible band, a star pours plenty of light into that band — the peak decides the tint, not the visibility.
2.7 Problem: Reading starlight
Problem 2.1
Weekend problem — reading starlight: the philosopher who said “never”, and how a prism takes a star’s temperature and reads its chemical recipe
In 1835 the philosopher Auguste Comte needed an example of knowledge forever beyond human reach, and chose it carefully: the chemical composition of the stars. Nobody would ever bottle a star. In 1859 Kirchhoff and Bunsen matched the dark lines of the Sun to the bright lines of laboratory flames, and the unreachable knowledge arrived by return of light. This problem retraces the whole path: laboratory fingerprints, glowing bodies, the Sun’s dark lines — and finally a star whose temperature and composition you will determine from your desk.
Part I — Fingerprints on file.
- Give the visible range of wavelengths in nanometers and the color at each end. Where does sit?
- A hydrogen discharge lamp shows lines at , , and . Give the color of each line.
- A sodium lamp emits essentially one line at . What does the lamp look like to the eye, and why is it hopeless to judge the color of a parked car under such a street light?
- Explain why a set of spectral lines identifies an element — and why all the strong lines of an element must be found before declaring it present.
- Predict the spectrum seen (a) when white light crosses a flask of cool sodium vapor, and (b) when the same vapor, alone in a dark room, is excited by a discharge.
Part II — Hot bodies and their colors.
- State the two effects of raising the temperature of a dense glowing body on its continuous spectrum.
- A halogen filament runs at . Compute and give its domain.
- The Sun’s continuous spectrum peaks at . Compute its surface temperature.
- That peak sits in the green — yet the Sun does not look green. Explain.
- A poker left in the forge is first felt from a distance without being seen to glow, then glows dull red, then orange-white. Explain the whole sequence with question 6.
Part III — The Sun’s dark lines.
- The solar spectrum is a continuous band crossed by thousands of fine dark lines. Which part of the Sun produces the continuous background, and which part produces the lines?
- Strong solar lines sit at , , , , , and . Catalogs: hydrogen ; sodium ; calcium . Which elements are present in the Sun’s atmosphere?
- The hydrogen lines are by far the strongest. What does this suggest about the Sun’s composition — and what do modern measurements say?
- In 1868, a line at observed in the Sun’s atmosphere matched no catalog. Reconstruct the reasoning that justified announcing a new element, and say how the story ended.
- Why are the solar lines dark, when the same atoms in a laboratory discharge give bright lines? During a total eclipse, for a few seconds, only the thin atmosphere of the Sun stays visible against a dark sky — and the same lines flash bright. Explain.
Part IV — A star on the desk. The spectrum of the bright star Vega is placed before you: a continuous background peaking at , scored by strong dark lines at , , and .
- Compute Vega’s surface temperature.
- The peak lies in the ultraviolet. Predict the star’s apparent color, and reconcile “peak outside the visible” with “bright star”.
- Identify the element dominating Vega’s atmosphere.
- Compare Vega with the Sun: temperature ratio, color, and brightness per unit of glowing surface.
- Finale — fill in the identity form that Comte declared impossible: temperature, dominant element, apparent color of Vega, all read from one beam of light. How many years did “never” last?
Solution
Solution of Problem 2.1.
1. From about (violet end) to about (red end); sits near the middle, in the green.
2. : violet; : violet-blue; : blue-green; : red.
3. A monochromatic yellow-orange glow. The color of a car is the mix of wavelengths its paint reflects; under a lamp offering only , every paint can only reflect more or less of that one wavelength — all cars appear in shades of orange and gray.
4. Each element emits a fixed catalog of lines, and no two elements share the same catalog (Proposition 2.12): a complete set of lines therefore identifies the element like a fingerprint. But a partial match proves little — distinct elements can own nearly coincident single lines (helium at , sodium at ) — so the presence claim requires all the strong lines of the catalog.
5. (a) A continuous rainbow with a dark line at : the absorption spectrum. (b) A single bright line at on black: the emission spectrum — same wavelength, bright and dark exchanged (Proposition 2.15).
6. The spectrum brightens at every wavelength, and its peak moves toward shorter wavelengths, following (Proposition 2.7).
7. : near infrared, just past the red edge — which is why halogen light is warmer-toned than daylight.
8. .
9. The peak is gentle, not a spike: the Sun emits the whole visible band with comparable strength. A full band of colors mixed together reads as white — the Sun looks white (yellowish through our atmosphere), never green.
10. Cold poker: peak deep in the infrared, no visible tail — radiation is felt, nothing is seen. Hotter: the brightening spectrum pushes a first visible tail past — the red end lights up alone: dull red. Hotter still: the whole visible band fills in while everything brightens: orange, then toward white.
11. The continuous background comes from the dense, hot glowing surface; the dark lines are printed by the cooler, thinner atmosphere above it, which absorbs its own wavelengths from the light passing through.
12. Hydrogen (, , , : complete), sodium () and calcium ( and : both) — all three are present in the Sun’s atmosphere.
13. That the atmosphere is dominated by hydrogen. Modern measurements agree and quantify: the Sun is roughly three quarters hydrogen by mass, most of the remainder being helium.
14. The line matched no known element; since each element’s catalog is fixed and unique, a line belonging to no catalog must belong to an element never yet seen in a laboratory. A new element was announced and named helium, after helios, the Sun. It was isolated on Earth in 1895 — the prediction confirmed, twenty-seven years later.
15. Seen against the brilliant continuous background, the atmosphere removes light at its own wavelengths: dark lines. During the eclipse the Moon blocks the background; the thin atmosphere then stands alone against a dark sky and its re-emitted light is all there is to see: the same wavelengths, now bright. One gas, one catalog — the sign depends on what stands behind it.
16. .
17. Blue-white: within the visible band the spectrum is strongest at the blue end. And no invisibility: the continuous spectrum floods the entire visible band on its way to the ultraviolet peak — the peak fixes the tint, not the brightness.
18. The dark lines , , , are the complete hydrogen fingerprint: hydrogen dominates Vega’s atmosphere.
19. : Vega is hotter, hence bluer (peak at against ) and, by the first part of Proposition 2.7, brighter per unit of glowing surface at every wavelength.
20. Identity form of Vega — surface temperature: about ; dominant element of the atmosphere: hydrogen; apparent color: blue-white. All of it read from one beam of light, with a prism, a catalog of laboratory lines and one division. Comte’s “never” was issued in 1835 and expired in 1859: it lasted twenty-four years.