Primary & Middle School Mathematics · कक्षा 1–9
44Proportionality and Data
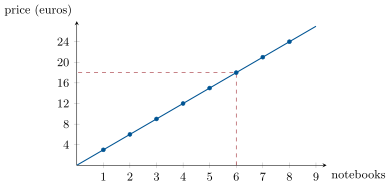
If three notebooks cost euros, six notebooks cost : double the notebooks, double the price. Quantities behaving like this are proportional — one of the most useful ideas in all of mathematics, developed further in Chapter 49. The chapter ends with reading and drawing simple data charts.
44.1 Proportional quantities
Definition 44.1 (Proportionality)
Two quantities are proportional when the values of one are obtained from the values of the other by multiplying always by the same number, called the proportionality coefficient.
Example 44.2
Notebooks at euros each:
| notebooks | ||||
|---|---|---|---|---|
| price (euros) |
Each price is the number of notebooks : the coefficient is (the unit price). A quick check that a table is proportional: all the “column quotients” must be equal — here they all equal .
Example 44.3 (A non-example)
Age and height are not proportional: a -year-old is not twice as tall as a -year-old. Check on numbers: m at years and m at years give quotients and — not equal.
Method 44.4 (Completing a proportionality table)
Three ways, to be chosen freely:
- coefficient: find the multiplier from one complete column, apply it to the others;
- columns: a column can be multiplied by a number, or two columns can be added, to produce a new column;
- back to the unit: find the value for one item first, then multiply.
Example 44.5
Five identical mugs cost euros; how much do eight mugs cost?
Back to the unit: one mug costs euros, so eight mugs cost euros.
Columns: ; three mugs cost of , i.e. ; so eight mugs cost euros. Same answer, as it must be.
44.2 Percentages
Definition 44.6 (Percentage)
“ of a quantity” means the fraction of it: of is . A percentage is a proportionality with coefficient .
Example 44.7
A class of students contains girls. Number of girls, step by step: means , and girls. Useful landmarks: is one half, one quarter, one tenth — so of is , and is : same answer, computed mentally.
44.3 Reading and drawing charts
Method 44.8 (Reading a table or chart)
Whatever the picture — table, bar chart, line graph:
- read the title and the units on both axes first;
- to answer a question, locate the right bar/column, then read the value carefully against the graduation;
- to compare, compare bars by height — but check the axis starts at , or the picture can mislead.
Example 44.9
The bar chart below shows the number of books borrowed at the school library during one week.
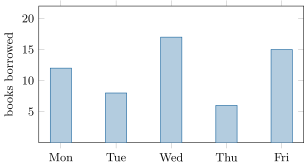
Readings: the busiest day is Wednesday ( books). Tuesday and Thursday together account for books — fewer than Friday alone (). Total for the week: books.
44.4 Exercises
Exercise 44.1 ★
Is the table proportional? Justify by computing quotients.
| kg of apples | |||
|---|---|---|---|
| price (euros) |
| age (years) | |||
|---|---|---|---|
| height (cm) |
Solution
Solution of Exercise 44.1.
Apples: quotients , , — all equal: proportional (price per kg).
Age/height: but — not equal: not proportional.
Exercise 44.2 ★
Four croissants cost euros. Find the price of one croissant, then of seven croissants.
Solution
Solution of Exercise 44.2.
One croissant: euros. Seven: euros.
Exercise 44.3 ★
Complete the proportionality table (coefficient first!):
| liters of fuel | ||||
|---|---|---|---|---|
| price (euros) |
Solution
Solution of Exercise 44.3.
Coefficient: euros per liter. Then L cost euros; euros buy L; L cost euros.
Exercise 44.4 ★
A car uses L of fuel per km. How much fuel for km? For km? How far can it go with L?
Solution
Solution of Exercise 44.4.
For km: times the fuel of km, so L. For km: L. With L: hundreds of km, i.e. km.
Exercise 44.5 ★
Compute mentally, using the landmarks of Example 44.7: of ; of ; of ; of .
Exercise 44.6 ★
In a school of students, eat at the cafeteria. How many students is that? How many do not?
Solution
Solution of Exercise 44.6.
of : students eat at the cafeteria; do not.
Exercise 44.7 ★
Using the bar chart of Example 44.9: on which days were fewer than books borrowed? How many more books were borrowed on Wednesday than on Thursday?
Solution
Solution of Exercise 44.7.
Fewer than books: Tuesday () and Thursday (). Wednesday minus Thursday: more books.
Exercise 44.8 ★
The temperatures at noon from Monday to Friday were , , , , degrees. Draw a bar chart of these data (choose a sensible graduation), and read off the warmest day.
Solution
Solution of Exercise 44.8.
Bar chart with five bars of heights , , , , (graduation every or degrees works well). Warmest day: Friday ( degrees).
Exercise 44.9 ★★
A recipe for people needs g of flour and eggs. Adapt it for people. (For the eggs, think before writing a decimal number of eggs!)
Solution
Solution of Exercise 44.9.
For people, multiply by : flour g. Eggs: — luckily a whole number. (If it were not, one would round up to have enough.)
Exercise 44.10 ★★
At a constant speed, a cyclist rides km in hour.
- How far does she ride in h? In half an hour? In h min?
- How long does she need for km?
Solution
Solution of Exercise 44.10.
1. In h: km. In half an hour: km. In h : km.
2. hours, i.e. h min.
Exercise 44.11 ★★
A shop offers “ off everything”. Compute the discount and the new price for: a ball at euros; a racket at euros. Is the new price proportional to the old price? What is the coefficient?
Solution
Solution of Exercise 44.11.
Ball: discount of euros, new price euros. Racket: discount euros, new price euros. The new price is of the old one in every case: proportional, coefficient .
Exercise 44.12 ★★★
Two candles of the same height are lit at the same time. The thick one burns down completely in hours, the thin one in hours, each at its own constant rate. After how much time is the thin candle exactly half as tall as the thick one? (Express the remaining heights after hours as fractions of the initial height.)
Solution
Solution of Exercise 44.12.
After hours, the thick candle has burned of its height: it stands at of the initial height; the thin one at . We want
Then , so hours. Check: after h the thick candle stands at and the thin one at — indeed half of it.
44.5 Problem: Maps, plans, and how to lie with a chart
Problem 44.1
Weekend problem — the scale of a map is a proportionality: lengths follow the coefficient, areas follow its square, and badly drawn charts fool the eye
Every map, floor plan and model obeys one rule: real lengths and drawn lengths are proportional (Definition 44.1). The coefficient has a famous name — the scale — and it hides two traps that this problem springs deliberately: areas do not follow the scale, and percentages, like charts, depend entirely on what they are measured against.
Part I — Reading a map. A hiking map is at scale : every centimeter on the map stands for centimeters on the ground.
- Convert cm into kilometers. What does cm of this map represent, in km?
- Two villages lie cm apart on the map; the shore of a lake is a cm curve. Give the real distances.
- A dead-straight Roman road runs km. How long is it on the map?
- A second map announces “ cm for km”. Write its scale in the form . Which of the two maps shows more detail for the same region?
- Make a small table (map distance , , cm against real distance) for the hiking map, and explain why a scale is exactly a proportionality in the sense of Definition 44.1. What is the coefficient that turns centimeters-on-the-map into kilometers?
Part II — Zoe’s bedroom plan. Zoe draws a plan of her bedroom — a rectangle of m by m — at scale .
- What are the dimensions of the room on the plan?
- Her bed measures m by m, and the doorway is cm wide. Give all three measurements on the plan.
- Now the trap. Compute the real area of the room in m, then the area of its plan in cm. Convert the real area into cm (Definition 43.5) and divide by the plan area: is the quotient ?
- Explain the number you found: on a plan, each square centimeter of paper represents a real square of cm by cm. How many real cm is that? State the rule: when lengths are divided by , areas are divided by …
- A round carpet covers cm on the plan. What real area does it cover, in cm and then in m?
Part III — How to lie with a chart (and with a percentage).
- A shop sold euros’ worth on Saturday and on Sunday. The manager draws a bar chart whose vertical axis starts at : the Saturday bar rises small units, the Sunday bar . What does the picture suggest about Sunday, and what is the truth? (Compute Sunday’s increase as a percentage of Saturday, to the nearest percent.) Which warning of Method 44.8 did the manager ignore?
- Redraw (or describe) the honest chart, with the axis starting at : how do the two bars compare now?
- A collection grows from to stamps: compute the increase as a percentage of the starting value. It then shrinks back from to : compute the decrease as a percentage of its starting value. Why are the two answers different, for the same stamps?
- Sale season: a coat at euros gets “ off”, and at the till an extra “ off the reduced price”. Compute the final price step by step. Is the total discount ? Explain to the shopper what it really is.
- Finale, back on the map of question 4 ( cm for km): a forest occupies cm of that map. What is its real area, in km? Conclude with the rule of this whole problem: lengths follow the scale, areas follow its …
Solution
Solution of Problem 44.1.
1. cm m km: one centimeter on the map is one kilometer on the ground.
2. cm km between the villages; cm km of lake shore.
3. km cm on the map.
4. km cm, so the scale is . The hiking map () is the more detailed: it uses cm of paper where the other spends only cm.
5.
| map (cm) | |||
|---|---|---|---|
| real (km) |
Real distance map distance (in these units): always the same multiplier, which is exactly the definition of proportionality (Definition 44.1). The coefficient here is kilometer per centimeter.
6. m cm and ; m cm and : the plan shows an cm cm rectangle.
7. Bed: cm by cm. Doorway: cm.
8. Real area: m. Plan area: cm. Converting: m cm, and
The quotient is not but .
9. One cm of paper stands for a real square of cm by cm, which contains cm. So when lengths are divided by , areas are divided by : areas follow the square of the scale.
10. cm, and m.
11. The picture suggests Sunday sold twice as much (a bar twice as tall). Truth: the increase is euros out of , and : about more, not more. The manager ignored the warning to check that the axis starts at (Method 44.8).
12. With the axis from , the bars rise to and small units: two bars of nearly the same height, the honest picture of a difference.
13. Up: the increase is stamps from a start of : . Down: the decrease is stamps from a start of : . Same stamps, different starting values — a percentage is always a fraction of something, and the “something” changed.
14. After off: euros. The extra applies to : discount euros, final price euros. Total discount: euros out of , so — not . The second discount acted on the already-reduced price, so its euros are smaller: percentages of different quantities do not add.
15. On that map, cm stands for km, so cm stands for km (question 9’s rule). The forest: km. Lengths follow the scale; areas follow its square.